Latest Video Highlights
Auto-fetched, DeepSeek-summarized, and synthesized. Click any card to expand the full analysis.
⚡ Creator Pulse
trailing 7 days · click to multi-select✕ Clear All-In Podcast
 Capital Allocators with Ted Seides
 Jordi Visser
 Stock Market Live
 The Compound
 TheChartGuys
 Trade Brigade
-
Creator Horizon Category (⏱️): Long-Horizon Macro / Structural — Evidence centers on Anthropic's 2026 IPO odds and board/CEO governance, not price technicals or macro cycles.
-
One-Line Thesis (💡): The All-In Podcast discusses Anthropic's 2026 IPO odds falling from a cited 96% to 76%, while a speaker claims Anthropic's CEO is sabotaging the IPO and argues a board should replace the CEO and move him to the lab.
-
Key Data Points (📊):
- Anthropic IPO in 2026 — headline question: 'Will Anthropic go public in 2026?'
- 96% — cited peak earlier this month that Anthropic will go public this year
- 76% — cited current level that Anthropic will go public this year
- 10% — quoted claim that lab founders told us there is a 10% chance of us all dying
- CEO replacement — speaker says if he and the four were Anthropic's board, they would replace the CEO, put the CEO in the lab, and find a CEO who knows how to run the company and not sabotage it
- Shareholder duty — speaker frames alleged IPO sabotage as a dereliction of duty as CEO of Anthropic -
Technical Levels & Setups OR Macro Drivers (📌):
- Declining cited odds/probability: 96% peak earlier this month to 76% now for an Anthropic IPO this year
- Governance conflict: speaker alleges Anthropic CEO is sabotaging the IPO and not acting on behalf of shareholders
- AI-safety/lab tension: lab started after telling us there is a 10% chance of us all dying; speaker questions CEO duty
- Hypothetical board action: replace CEO, move CEO to the lab, hire a CEO who knows how to run the company
- Event-driven catalyst: Anthropic IPO timing and 2026 listing question -
Risk/Reward Framework (⚖️):
- Entry: Not established by the available evidence.
- Stop: Not established by the available evidence.
- Targets: Not established by the available evidence.
- Risk/Reward: Not established by the available evidence.
- Position Size: Not established by the available evidence.
- Probability: Not established by the available evidence. -
Scenario Analysis (🔄):
| Scenario | Probability | Target | Trigger |
|---|---|---|---|
| Bull | Not established by the available evidence. | Not established by the available evidence. | Odds recover toward the cited 96% peak and Anthropic proceeds with a 2026 IPO. |
| Base | Not established by the available evidence. | Not established by the available evidence. | Odds remain near the cited 76% with no evidence of board action or CEO replacement. |
| Bear | Not established by the available evidence. | Not established by the available evidence. | Board action or CEO replacement occurs as the speaker suggests, or IPO odds fall below the cited 76%. | -
Risk Factors (⚠️):
- Evidence is a quoted excerpt; the source and methodology for the 96% and 76% odds are not provided.
- The speaker's claim that the CEO is sabotaging the IPO is an allegation/opinion, not a company disclosure.
- No Anthropic ticker, valuation, IPO date, filing, or shareholder data is established.
- No board authority or willingness to replace the CEO is established.
- The 10% chance of us all dying statement is quoted but not attributed to a named person or independently verified.
- No portfolio implication, entry, stop, target, or position sizing is supported. -
Actionable Trading/Allocation Plan (🎯):
- Monitor cited odds for an Anthropic 2026 IPO and compare against the 96% peak and 76% current level.
- Track Anthropic official statements, board communications, and IPO filings for CEO succession or governance changes.
- Verify the original context of the 10% chance of us all dying claim and attribute it to the correct speaker or source.
- Separate All-In speaker opinions about CEO performance from verifiable corporate events before drawing conclusions.
- Revisit only if new evidence provides named sources, company disclosures, or trade parameters.

-
Creator Horizon Category (⏱️): Long-Horizon Macro / Structural — Creator emphasizes AI consumer agents and tokenization as a structural inflection and next 12-month alpha driver.
-
One-Line Thesis (💡): Jordi Visser claims a time mismatch: rate-hike/bearish macro analysis is backward-looking because AI consumer agents and tokenization are a new regime, with IWM/QQQ making new lows since the iPhone while Mag 7 makes new all-time highs and a bear market runs inside a bull market.
-
Key Data Points (📊):
- IWM over QQQ makes new lows since the iPhone — creator claim on persistent relative weakness.
- Mag 7 making new all-time highs while Russell 2000 2000 names are in trouble because of AI — creator claim on dispersion.
- Meta stock was up 14% on Monday — creator claim tied to Meta AI agent launch.
- Meta AI agent partnerships with PayPal, Expedia, Shopify, Instacart — creator claim on catalyst.
- Meta AI agent launch drove Intel, AMD, and other Mag 7 — creator claim on read-through beneficiaries.
- Age bracket 55 to 64: 2.2% use AI — creator claim on older macro experts' AI adoption.
- Creator cites +17% year-over-year after discussing second derivative/earnings/profit margins; exact series not named in transcript.
- If year-over-year S&P goes negative, I'll change my mind — creator's stated invalidation condition.
- Credit spreads measured as Moody's BA yield relative to 10-year yields are not widening — creator claim.
- Jobless claims before every crisis are going higher; now they're not budging — creator claim.
- Profit margins haven't stopped going higher in a parabolic fashion; they peaked in '07 — creator claim.
- Money market funds on a three-month basis went higher — creator claim on cash levels.
- LEI just went positive; no recession occurred — creator claim against recession signal.
- Inverted yield curve and 100% probability of recession preceded Silicon Valley Bank going under but no market hiccup — creator recounting past.
- Tokenization will dramatically change M2 and monetary economics today — creator claim.
- No tokenization during the 70s, 80s, 90s, and 2000s; no AI in everyone's hands — creator claim on regime difference.
- Housing sales near all-time lows; everyone has positive owner's equity; government is saddled with debt — creator claim on rate transmission.
- ChatGPT came out in 2022; here we are now in 2026 — creator timeline. -
Technical Levels & Setups OR Macro Drivers (📌):
- AI consumer agents are the next AI moment and the creator's expected alpha driver over the next 12 months.
- Tokenization plus AI agents as inflection point: speed of intelligence changing while speed of money has to catch up.
- Time mismatch: older macro experts above 50/55 are framed as linear thinkers; 2.2% of 55-64 use AI.
- Rate-hike contagion indicators not flashing: credit spreads not widening, jobless claims not budging, LEI positive, profit margins parabolic.
- IWM/QQQ structural downtrend since the iPhone; Mag 7 vs Russell 2000 dispersion.
- Meta AI agent launch and partnerships as near-term catalyst; Meta +14% Monday and read-through to Intel, AMD, other Mag 7.
- Government debt versus corporate/household debt; creator dismisses betting on US default; housing/autos/retail/restaurants at bear-market levels because rates are higher.
- Crypto and tokenization linked to AI agents; Freedom Tech DC presentation as thematic backdrop. -
Risk/Reward Framework (⚖️):
- Entry: Not established by the available evidence.
- Stop: Not established by the available evidence.
- Targets: Not established by the available evidence.
- Risk/Reward: Not established by the available evidence.
- Position Size: Not established by the available evidence.
- Probability: Not established by the available evidence. -
Scenario Analysis (🔄):
| Scenario | Probability | Target | Trigger |
|---|---|---|---|
| Bull | Not established by the available evidence. | Not established by the available evidence. | AI consumer agents/tokenization continue; Meta agent partnerships expand; Mag 7/AI beneficiaries make new highs while IWM/QQQ stays weak and credit spreads/jobless claims do not stress. |
| Base | Not established by the available evidence. | Not established by the available evidence. | Rates stay higher while credit spreads do not widen, jobless claims do not budge, LEI stays positive, and profit margins remain parabolic; Mag 7 vs Russell 2000 dispersion persists. |
| Bear | Not established by the available evidence. | Not established by the available evidence. | Year-over-year S&P goes negative (creator's stated mind-change condition), credit spreads widen, jobless claims rise, or profit margins break. | -
Risk Factors (⚠️):
- No explicit entry, stop, target, ratio, position size, or probability is provided in the evidence.
- Creator's stated invalidation: if year-over-year S&P goes negative, he would change his mind.
- Contagion verification risk: credit spreads, jobless claims, profit margins, and LEI are the creator's own watch items but data sources and backtests are not shown.
- Meta AI agent catalyst may be a one-day stock reaction; Meta +14% Monday does not establish durability.
- 2.2% AI usage among 55-64 is an unverified statistic in the transcript.
- Tokenization's effect on M2 and monetary economics is asserted but not quantified.
- This-time-different argument could be wrong even if past LEI/yield-curve signals failed.
- Government default risk is dismissed without specific debt metrics or thresholds.
- Russell 2000 is not uniformly hurt by AI; creator notes some infrastructure names benefit. -
Actionable Trading/Allocation Plan (🎯):
- Monitor IWM/QQQ relative performance for new lows since the iPhone and Mag 7 versus Russell 2000 breadth.
- Verify credit spreads using Moody's Baa yield relative to 10-year yields; watch for widening as creator's stated stress signal.
- Track jobless claims for an upturn; creator says they are not budging currently.
- Track year-over-year S&P; creator says negative year-over-year would make him change his mind.
- Monitor the LEI after the creator says it just went positive.
- Monitor whether profit margins stop going higher in a parabolic fashion.
- Verify AI agent adoption data, including the creator's 2.2% usage claim for ages 55-64.
- Track Meta AI agent partnerships with PayPal, Expedia, Shopify, Instacart, plus downloads and read-through to Intel, AMD, and Mag 7.
- Monitor tokenization/M2 developments and crypto-AI agent intersection.
- Verify housing sales near all-time lows and homeowner equity claims.

-
Creator Horizon Category (⏱️): Short-Term Technical — Evidence analyzes SPY weekly expected move, daily 50 SMA, hourly levels, and next-week trade pathing.
-
One-Line Thesis (💡): Trade Brigade claims SPY is less than five points from an all-time high while 10-year rates are at 2007 levels, breadth is as bad as 1999, and Iran/Hermuz headlines remain a risk, and he reads weekly/daily/hourly structure as constructive above 766 but concerning below 76325.
-
Key Data Points (📊):
- 10-year interest rates are at levels not seen since 2007 — macro risk cited by creator
- Market breadth is 'just as bad as it was in 1999' — breadth warning cited by creator
- Trump rejected Iran's reopening proposal — headline catalyst; creator speculates potential 'taco trade' early next week after market close
- China tariffs resolution after the meeting — positive item cited by creator
- Cues are less than five points from the all-time high — creator says rates, breadth, and Hermuz news are not stopping the AI train yet
- SPY weekly: mostly green-bodied bar, higher low, higher high, close above prior week's range and trendline; above 38.2 fib, 20-week MA, 10-week MA, anchored VWAP stack, and high-volume node
- XBI comparison: base on base flag, hammer candle, breakout, checkback; creator sees S&P 500 potentially in a similar neighborhood
- Weekly expected move upper bound 78216 implies higher high and brand new all-time high; lower bound 76034 corrected to 76054; previous all-time high 76025
- Daily 50 SMA around 76325; Thursday low/gap-down low 76325; Monday low/gap-up low 766
- Left-side peak shelf 77485; break over it should yield all-time high retest at 77925 / 779.25
- Hourly higher low 76875; Wednesday opening print 77275; bullish pathing includes consolidation over Monday/Tuesday high
- FOMC low to recent high Fibonacci: 38.2 at 766; 61.8 near lower bound, daily 50 SMA, and structural 76025 line in the sand
- Market internals: substantial sell-side pressure Wednesday; Thursday gap down recovered; muted internals afterward; breadth problem
- Tickers/names creator mentions for liquid leaders: AMD, Intel, MU, Micron, SanDisk, SKH, Highex, ARM, Marll; Mag 7 and other 493 stocks -
Technical Levels & Setups OR Macro Drivers (📌):
- SPY weekly recovery after Thursday gap down produced a higher low/higher high and a close above the prior week's range and trendline
- Weekly anchored VWAP stack reclaimed, including the previous all-time-high breakout anchored VWAP
- SPY compared with XBI base-on-base flag: hammer candle, breakout, checkback, then aggressive upside
- Weekly expected move framed as neutral: upper 78216 is bullish new all-time high; lower 76054/76034 is near 76025 support
- Daily uptrend considered intact if market maintains a higher low above Thursday's low at 76325
- 766 treated as key short-term barometer and anchored VWAP stack / Monday low / Fib 38.2 level
- Hourly inverted head-and-shoulders possibility; higher low above 76875 keeps bullish daily base case alive
- Break over 77485 should yield an all-time-high retest at 77925 / 779.25
- China tariff resolution cited as positive; Iran/Hermuz and Trump headline cited as risk
- Creator questions whether breadth matters when positioning in liquid leaders such as AMD, Intel, MU, Micron, SanDisk, SKH, Highex, ARM, Marll -
Risk/Reward Framework (⚖️):
- Entry: Not established by the available evidence.
- Stop: Not established by the available evidence.
- Targets: all-time high retest at 77925 / 779.25; upper bound of weekly expected move 78216; break over 774.85 should yield all-time high retest at 77925 / 779.25
- Risk/Reward: Not established by the available evidence.
- Position Size: Not established by the available evidence.
- Probability: Not established by the available evidence. -
Scenario Analysis (🔄):
| Scenario | Probability | Target | Trigger |
|---|---|---|---|
| Bull | Not established by the available evidence. | 77925 / 779.25 and 78216 | Holds or reclaims 766, forms hourly higher low above 76875, and breaks over 774.85 |
| Base | Not established by the available evidence. | Not established by the available evidence. | Check back holds 766 and 76325 while market digests sideways below 774.85 |
| Bear | Not established by the available evidence. | Not established by the available evidence. | Price acceptance below 76325, loss of daily 50 SMA, and move underneath 76025/76054 | -
Risk Factors (⚠️):
- 10-year rates at 2007 levels could pressure equity valuations
- Breadth is described as just as bad as 1999, with weakness outside Mag 7 / bottom stocks
- Iran reopening proposal rejection and Hermuz headline risk; creator speculates on a taco trade
- Loss of 766 anchored VWAP stack / Monday low would be concerning
- Price acceptance below 76325, then below 76025/76054, would start raising problems
- Muted market internals after Thursday's recovery and substantial sell-side pressure on Wednesday
- Creator says he does not want another choppy balance range to form
- No formal entry, stop, position size, probability, or risk/reward ratio is stated for the trade plan -
Actionable Trading/Allocation Plan (🎯):
- Verify the creator's claim that 10-year interest rates are at levels not seen since 2007
- Verify the creator's claim that market breadth is as bad as 1999
- Monitor Iran/Hermuz headlines and China tariff follow-through after the meeting
- Track SPY levels: 766, 76875, 77275, 77485, 77925, 78216, 76325, 76054, 76025
- Compare SPY's claimed base-on-base flag setup with the XBI pattern cited by the creator
- Track the market internals dashboard for sell-side pressure and muted internals
- Check whether the hourly chart forms a higher low at 76875 and whether 766 is reclaimed after any gap close
- Watch for a break over 774.85 as the creator's stated trigger for an all-time-high retest

-
Creator Horizon Category (⏱️): Long-Horizon Macro / Structural — Evidence centers on long-run AI wealth concentration and political/philanthropic capture, not short-term technical levels.
-
One-Line Thesis (💡): Creator claims AI wealth concentration will endow three-to-six frontier companies with about $10T, and that this money will flow heavily into philanthropic/DAF, PAC, and political-movement channels that disproportionately benefit left-leaning Democratic/Obama-aligned beneficiaries, making it a political calculus rather than prosperity.
-
Key Data Points (📊):
- $10 trillion of wealth — claim that the world is about to endow three, four, five, six companies with about this amount
- Obama — creator says Obama knows most of those companies are overwhelmingly left-leaning and that he and people around him will be beneficiaries of philanthropic and charitable causes
- DAFs — frontier corporations ask recipients to stand up donor-advised funds and pledge a portion of stock
- PACs / political movements — creator says the money will go into PACs and political movements rather than only consumption or savings
- Democrats — creator says a handful of organizations that disproportionately affect Democrats will win, capture the lion's share of economic gains, and help Democrats win power
- AI / genetic AI — speaker claims society needs like curing cancer or better energy can be pursued without a 'genetic AI', implying misalignment between societal needs and commercial imperatives
- No specific tickers or company names — evidence names no public equities, levels, or valuations beyond $10T -
Technical Levels & Setups OR Macro Drivers (📌):
- AI commercial imperatives vs societal needs: creator flags misalignment between what society needs and commercial imperatives of frontier AI companies
- Political capture channel: philanthropic and charitable vehicles, DAFs, pledged stock, PACs, and political movements
- Partisan beneficiary setup: left-leaning companies and Democratic/Obama-aligned networks stand to disproportionately benefit
- Economic capture setup: organizations that affect Democrats capture the lion's share of gains and help Democrats win power
- Political calculus not prosperity: creator explicitly says this has nothing to do with prosperity -
Risk/Reward Framework (⚖️):
- Entry: Not established by the available evidence.
- Stop: Not established by the available evidence.
- Targets: Not established by the available evidence.
- Risk/Reward: Not established by the available evidence.
- Position Size: Not established by the available evidence.
- Probability: Not established by the available evidence. -
Scenario Analysis (🔄):
| Scenario | Probability | Target | Trigger |
|---|---|---|---|
| Bull | Not established by the available evidence. | Not established by the available evidence. | Creator's bullish political/economic capture scenario: three-to-six frontier AI companies are endowed with about $10T and use DAF/stock pledges and PAC/political spending to disproportionately benefit Democratic/Obama-aligned beneficiaries while capturing the lion's share of economic gains. |
| Base | Not established by the available evidence. | Not established by the available evidence. | Creator's baseline assertion is that the political calculus is already visible: frontier firms ask for DAFs and pledged stock, and money is destined for PACs and political movements rather than consumption or savings. |
| Bear | Not established by the available evidence. | Not established by the available evidence. | Invalidation/falsification: if the about $10T flows largely to consumption or savings rather than PACs/political movements, or does not disproportionately benefit left-leaning/Democratic/Obama-aligned beneficiaries, the political-capture thesis fails. | -
Risk Factors (⚠️):
- No named companies or tickers; the claim cannot be mapped to investable assets from evidence alone.
- No time horizon for when the about $10T wealth transfer occurs.
- No source or methodology for the about $10T figure or the three-to-six company count.
- Partisan political claim about left-leaning companies and Obama-aligned beneficiaries is asserted, not evidenced with data.
- DAF/stock pledge and PAC/political movement flow claim lacks specific firm names, amounts, or filings.
- No valuation, entry, stop, target, position size, probability, or portfolio implication is provided.
- AI/societal-need misalignment claim is conceptual and not tied to a measurable catalyst.
- Election/political outcome causality is asserted; different political dynamics or policy outcomes would invalidate the thesis. -
Actionable Trading/Allocation Plan (🎯):
- Identify the three-to-six frontier AI companies referenced and map any public tickers if named in the fuller transcript or video.
- Verify the about $10T wealth endowment figure against primary sources and determine the stated time horizon.
- Monitor DAF/stock pledge programs and FEC or lobbying disclosures for PAC and political-movement flows.
- Track philanthropic and charitable beneficiary networks connected to Obama-aligned organizations.
- Compare AI company commercial roadmaps against societal-need claims such as cancer and energy to test the misalignment thesis.
- Watch Democratic electoral and policy gains and whether AI-linked organizations capture disproportionate economic gains.
- Check whether wealth flows to consumption or savings instead, as a falsification marker for the political-capture thesis.

-
Creator Horizon Category (⏱️): Long-Horizon Macro / Structural — The evidence discusses AI and agentic AI as a structural societal and political force around cancer, energy, and prosperity, not short-term technical levels.
-
One-Line Thesis (💡): The All-In Podcast speaker claims that dismissing agentic AI as unnecessary for curing cancer or improving energy misunderstands the technology and turns AI into a political fight against broad prosperity, while framing agentic AI as an equalizing opportunity.
-
Key Data Points (📊):
- Leader claim as quoted by creator: curing cancer or getting better energy 'you can do that without having agentic AI' - framed as misalignment between societal needs and commercial imperatives.
- Creator claim: 'These words honestly just they made me like emotionally distressed' if a leader people listen to does not articulate accurately what is going on.
- Creator claim: 'It's sad that we've lost the plot' and 'we aren't all kind of holding hands saying my god the future is here and we all get to leap forward and we get to bring people up.'
- Creator claim: for years Obama orated beautifully about bringing people up, giving people opportunity to progress, letting people advance themselves.
- Creator claim: 'there's never been a more equalizing technology, a better economic opportunity for prosperity for everyone than these technologies, than these tools.'
- Creator claim: handwaving 'agentic' and saying we don't need agentic AI to solve cancer shows how little he actually understands how this technology works.
- Creator claim: 'it's all become just a shorthand for a political fight.'
- Creator claim: political battle says 'I am going to leave half the population behind' and argues against prosperity for all to make a party look morally superior.
- Creator claim: 'the other side has literally discovered fire and the world now has fire and we're going to go take water and throw it on the fire.'
- Creator claim: 'No one gets fired because the other guys are saying that fire is' - transcript ends mid-sentence. -
Technical Levels & Setups OR Macro Drivers (📌):
- Agentic AI capability is positioned as required for major societal goals such as curing cancer and better energy; non-agentic AI is claimed insufficient by the speaker.
- Commercial imperatives of AI companies are claimed misaligned with what society needs.
- AI discourse is claimed captured by political fight rather than technical understanding.
- AI is framed as an equalizing technology and broad economic opportunity.
- Opposition to AI is framed as metaphorically throwing water on discovered fire. -
Risk/Reward Framework (⚖️):
- Entry: Not established by the available evidence.
- Stop: Not established by the available evidence.
- Targets: Not established by the available evidence.
- Risk/Reward: Not established by the available evidence.
- Position Size: Not established by the available evidence.
- Probability: Not established by the available evidence. -
Scenario Analysis (🔄):
| Scenario | Probability | Target | Trigger |
|---|---|---|---|
| Bull | Not established by the available evidence. | Not established by the available evidence. | Creator's framing: future is here, people leap forward, bring people up, equalizing technology and prosperity for everyone. |
| Bear | Not established by the available evidence. | Not established by the available evidence. | Creator's framing: political battle leaves half the population behind, argues against prosperity for all, and throws water on the fire. | -
Risk Factors (⚠️):
- Speakers and leaders are not conclusively identified in the evidence; attribution is transcript-backed but context-limited.
- Quoted opposing claim about agentic AI and cancer or energy is not independently verified.
- Transcript cuts off mid-sentence, limiting complete thesis extraction.
- No tickers, prices, valuations, dates, levels, or financial metrics are present in the evidence.
- Political rhetoric may obscure actual AI commercial and technical developments.
- Commercial imperative versus societal need claim lacks supporting data or examples. -
Actionable Trading/Allocation Plan (🎯):
- Verify the full episode and transcript to identify the speaker and exact context of the 'agentic AI' and cancer or energy quote.
- Check original statements by any referenced leaders or Obama-era policy language for literal wording.
- Monitor AI policy and political discourse for shifts in framing around agentic AI and prosperity.
- Track AI company commentary on agentic AI commercial incentives versus societal use cases.
- Do not infer trades; no financial instruments or risk parameters are established.

-
Creator Horizon Category (⏱️): Short-Term Technical — Creator emphasizes daily and weekly technical levels such as the low of Thursday, FOMC reaction low, weekly EMA 12, sector bounces, and all-time-high breakouts for short-term and swing decisions.
-
One-Line Thesis (💡): The creator claims the NASDAQ's record weekly close and bull break are occurring despite yields breaking out, oil over $90, and unresolved Iran-US tension, and he says bulls retain control while key technical supports hold, with AI biotech as his main relative-strength focus and weaker sectors watched for weekly bounces that could fuel new S&P 500 highs.
-
Key Data Points (📊):
- Yields are breaking out; oil is over $90; no resolution between Iran and the US in sight — macro backdrop stated at open.
- NASDAQ just had its highest weekly close in history — creator headline.
- NASDAQ weekly: equilibrium/tightening range broke first resistance, then second resistance; all-time high is focus.
- Short-term bull control guide: low of Thursday; swing bull control guide: FOMC reaction low.
- SPY: if holding weekly EMA 12, creator does not shift bullish mindset.
- Industrials XLI, materials XLB, transportation IYT: weak; watching base/weekly bounce; IYT held monthly EMA 12 last four tests.
- XLV healthcare: weekly EMA 12 holding a higher low; bullish as long as holds; decent relative strength past week.
- AI biotech narrative: creator says Anthropic may lean into AI biotech to build hype for IPO; cites mRNA cancer vaccine news and Anthropic wet lab.
- ARKG: grabbed Thursday; bullish as long as $50 is support; weekly EMA 12 rider highlighted; not expecting 2021/2020-style run.
- NT: lead bull blue-sky breakout; daily stairstep breakout; best-performing bigger name blue-sky breakout.
- TEM: high-risk/high-reward; could dilute or have bad trial results; bull flag continuation; not very liquid; all-time high not far.
- mRNA: after 100% move on Cana vaccine headline, sideways into continuation; 217 is key longer-term level; things open up above it.
- MRK: held for a while; ABBV: battling all-time high.
- XBI: key 150250 support test; double bottom at the moment Thursday; if that breaks, first red flag; rate-sensitive biotech.
- MSOS: monthly equilibrium; top watch into end of year; needs news catalyst/rescheduling; rejected from low $5 range; keep holding five; break 522 on Monday to set daily higher low; if lose $5 and no catalyst, may remain in monthly equilibrium for months.
- Dollar: ripped off double bottom daily stairstep to resistance, consolidating; break resistance would pressure metals.
- Gold: clear daily downtrend lower high/lower low; basing; looking for weekly higher low. -
Technical Levels & Setups OR Macro Drivers (📌):
- NASDAQ bull break: weekly equilibrium tightening range breaking multiple resistance levels; daily higher low set.
- Weak breadth interpreted by creator as fuel for another leg up, citing repeated prior breadth complaints since 2022 low; rotation/breadth expansion described as undefeated over last three years.
- Sectors materials, industrials, transportation weekly bounce to weekly lower high could be catalyst for new S&P 500 all-time highs.
- AI biotech relative strength: XLV and biotech backdrop must be bullish for narrative; rate sensitivity links XBI to rates.
- MSOS monthly equilibrium tightens; news catalyst rescheduling needed.
- Dollar resistance break pressures metals; gold daily downtrend basing. -
Risk/Reward Framework (⚖️):
- Entry: Not established by the available evidence.
- Stop: Creator-stated invalidation/support guides: NASDAQ low of Thursday and FOMC reaction low; SPY weekly EMA 12; XLV weekly EMA 12; ARKG $50; MSOS $5; XBI 150250 support.
- Targets: NASDAQ/S&P 500 all-time highs during a weekly bounce; mRNA 217 key longer-term level; things open up above it; MSOS back to recent highs after break 522 on Monday
- Risk/Reward: Not established by the available evidence.
- Position Size: Not established by the available evidence.
- Probability: Not established by the available evidence. -
Scenario Analysis (🔄):
| Scenario | Probability | Target | Trigger |
|---|---|---|---|
| Bull | Not established by the available evidence. | NASDAQ/S&P 500 all-time highs; AI biotech continuation. | NASDAQ holds low of Thursday; SPY holds weekly EMA 12; XLV holds weekly EMA 12; XBI forms bull flag/cup and handle; weak sectors bounce. |
| Base | Not established by the available evidence. | Not established by the available evidence. | Sectors chop/back-and-forth; MSOS remains in monthly equilibrium if loses $5 without catalyst; dollar consolidates at resistance; gold bases. |
| Bear | Not established by the available evidence. | Not established by the available evidence. | XBI breaks 150250 support; financial sector confirms weekly downtrend; SPY loses weekly EMA 12; NASDAQ loses FOMC reaction low; dollar breaks resistance pressuring metals. | -
Risk Factors (⚠️):
- Yields breaking out, oil over $90, and unresolved Iran-US tension are headline risks the creator says he tries to ignore.
- Weak breadth and rotation less bullish; many names under 50-day moving average referenced.
- Rate-sensitive biotech vulnerable to rates; XBI support break called first red flag.
- TEM illiquid with dilution/trial-result risk.
- Financial sector historical fakeout one-candle flush behavior.
- FOMC odds fluctuate; another hike is factored as most likely.
- No numeric target or risk-reward ratio provided for most ideas. -
Actionable Trading/Allocation Plan (🎯):
- Verify NASDAQ and S&P 500 reaction around all-time highs and whether low of Thursday holds.
- Monitor SPY weekly EMA 12 and S&P 500 equal-weight monthly EMA 12 as creator's bull-control guides.
- Track XLF for weekly downtrend confirmation and potential monthly higher low.
- Track XLV weekly EMA 12 and XBI 150250 support; watch for bull flag/cup-and-handle.
- Track ARKG $50 support, MRK/ABBV, NT blue-sky breakout, TEM liquidity, mRNA 217 level.
- Track MSOS $5 support and 522 Monday level plus rescheduling catalyst.
- Track dollar resistance and gold lower-high/lower-low structure.
- Track FOMC odds (56%, 73%, 60s) and macro headlines versus price action.

-
Creator Horizon Category (⏱️): Long-Horizon Macro / Structural — The discussion centers on AI product liability, Section 230-style protections, antitrust/waivers, and global governance versus individual responsibility, not short-term price levels.
-
One-Line Thesis (💡): All-In hosts argue that AI policy should reject global governance and liability waivers, instead forcing frontier AI firms—called companies, not labs—to internalize product liability and competition-driven safety.
-
Key Data Points (📊):
- Episode 290; fifth annual All-In Summit — podcast episode and event context
- President Trump called in during Jensen's talk — hosts describe the call as spontaneous, not planned
- Chamath: 'We have to stop calling these companies labs. They're companies and we have to be judged on the same standards including product liability.' — central claim
- Jason: 'Frontier Labs are covertly [companies]... looking for President Trump to specifically give them what the internet companies had with section 230, which is shield them from liability' — claim discussed as conspiracy theory
- Jason: 'maybe there could be some leverage... they would give 10% of their equity to the sovereign wealth fund of the United States... and then that would result in them being given some pass when it comes to their liability' — literal 10% figure
- Sachs: 'virtually every Trump administration official' said AI companies must take responsibility and 'we will not wave product liability'; cites Speaker Johnson, Besson, and a President Trump tweet that DOJ is a guardrail — reported claim
- Sachs: 'Daario and Sam go to the United Nations and say we need some sort of global AI governance' — context
- Chamath: Zuckerberg/Alexander delayed Muse rollout 'for a couple of months to get it perfect' — literal couple of months
- Chamath: Elon could have been at FSD 3 or 4 years ago but slowed due to accident magnification — literal 3 or 4 years
- Sachs: rejects the idea that competition equals lack of safety; 'Competition is a good thing' — thesis
- Trump quote via speakerphone: 'Jensen makes the greatest chips. Everybody tries to reverse engineer them. Impossible.' — context
- Tesla/FSD, Meta/Muse, DOJ, UN, Davos, Section 230, Trump administration, sovereign wealth fund, product liability — macro/regulatory keywords emphasized; no specific tickers, prices, valuations, levels, probabilities, position sizes, stops, targets, or ratios stated -
Technical Levels & Setups OR Macro Drivers (📌):
- AI doomer panic narrative versus industry/adult response from Elon, Jensen, Sachs, and Zuckerberg calming the national discussion
- Product liability as accountability mechanism; administration officials reportedly rejecting waivers
- Frontier labs allegedly lobbying for Section 230-style liability shield or antitrust/cartel protection; characterized as back-channel rumor
- Potential sovereign wealth fund equity stake (10%) as leverage for a liability pass; Jason calls it a conspiracy theory
- Companies versus labs framing: P&Ls, shareholders, internal controls, robust testing, and same standards as other companies
- Competition versus collective/global governance: individual responsibility as northstar, not UN or global agreements
- Delayed releases (Meta Muse, Tesla FSD) cited as evidence of safety/scrutiny tradeoffs
- UN AI governance push by Daario and Sam criticized as hypocritical and out of touch
- Trump administration statements, DOJ guardrail, and existing civil/criminal/administrative liability as constraints on unsafe AI releases -
Risk/Reward Framework (⚖️):
- Entry: Not established by the available evidence.
- Stop: Not established by the available evidence.
- Targets: Not established by the available evidence.
- Risk/Reward: Not established by the available evidence.
- Position Size: Not established by the available evidence.
- Probability: Not established by the available evidence. -
Scenario Analysis (🔄):
| Scenario | Probability | Target | Trigger |
|---|---|---|---|
| Bull | Not established by the available evidence. | Not established by the available evidence. | Trump administration/DOJ and Congress continue to reject product liability waivers, and AI firms internalize responsibility, slow unsafe releases, and compete on safety/reliability as hosts cite for Meta Muse and Tesla FSD. |
| Base | Not established by the available evidence. | Not established by the available evidence. | AI safety debate remains contested: frontier firms and critics push global governance/liability concerns while administration officials publicly emphasize individual responsibility and existing liability, with no formal policy change confirmed. |
| Bear | Not established by the available evidence. | Not established by the available evidence. | Frontier labs succeed in obtaining a Section 230-style liability shield or antitrust/liability waiver, or a 10% equity-to-sovereign-wealth-fund arrangement advances, contrary to officials' stated refusal to waive product liability. | -
Risk Factors (⚠️):
- Liability-waiver and 10% equity claims are described as rumor/back-channel; Sachs says this is not first-person experience.
- No specific tickers, price levels, valuations, dates, probabilities, or portfolio implications are provided in the evidence.
- Administration statements are not necessarily final policy; regulatory/legislative outcomes remain uncertain.
- An AI incident or unsafe release could invalidate the competition-safety thesis.
- UN/global AI governance proposals could gain traction despite host criticism.
- Hosts' political framing may bias interpretation of the 'doomer' and 'adults' narratives.
- The claim that companies are seeking liability protection is not pinned down with direct evidence in the transcript. -
Actionable Trading/Allocation Plan (🎯):
- Monitor official White House, DOJ, congressional, and Trump administration statements on AI product liability waivers, Section 230-style protections, and antitrust.
- Track whether frontier AI firms associated with Daario, Sam, Zuckerberg, Elon, or Jensen publicly seek or receive liability/antitrust protections via filings, lobbying disclosures, and official announcements.
- Verify Meta Muse release timing/delays and Tesla FSD timeline claims through company statements or regulatory filings.
- Monitor UN and international AI governance proposals involving Daario/Sam and any US policy response.
- Watch for any sovereign wealth fund equity stake (10% or otherwise) in AI companies and associated policy conditions.
- Track AI product liability lawsuits, civil/criminal/administrative actions, and AI incident reports as tests of the accountability thesis.
-
Creator Horizon Category (⏱️): Long-Horizon Macro / Structural — Creator discusses Buffett's chairman succession and decades-long Berkshire Hathaway compounding legacy.
-
One-Line Thesis (💡): The Compound's transcript claims Warren Buffett stepped down as chairman (not died), highlights Berkshire Hathaway's compounding record since 1965 with See's Candy (1972), Coca-Cola (1988), and Apple (2016), and states Howie Buffett is stepping in as chairman while asserting that Berkshire Hathaway would still have outperformed the S&P 500 since 1965 even after a 99% decline.
-
Key Data Points (📊):
- Warren Buffett stepped down as chairman; he did not die — creator claim.
- Howie (Buffett's son) is stepping in to be chairman of the board — creator claim.
- 1972: acquired See's Candy (transcript spells 'Seas Candy') — creator claim.
- 1988: started buying Coca-Cola; still holds it — creator claim.
- 2016: started buying Apple — creator claim.
- Annualized return from various starting points described as 'incredible' and 'unbelievable'; exact figures not stated — creator claim.
- Berkshire Hathaway fell by 99% would still have outperformed the S&P 500 since 1965 when Buffett started running it — creator claim, attributed to Mev Faber as first heard source.
- 'Sounds fake. It's not.' — creator asserts the 99% drawdown outperformance claim is true.
- 'You have to have gone back in time and boarded in 1965 for this to be relevant to you' — creator caveat.
- Berkshire Hathaway — mentioned; ticker symbol not stated in evidence.
- Coca-Cola — mentioned; ticker symbol not stated in evidence.
- Apple — mentioned; ticker symbol not stated in evidence.
- S&P 500 — mentioned as benchmark. -
Technical Levels & Setups OR Macro Drivers (📌):
- Succession setup: Buffett exits chairman role; Howie Buffett steps in as chairman of the board.
- Long-term compounding narrative built on Berkshire Hathaway performance since 1965.
- Historical investment timeline cited as evidence of Buffett's legacy: See's Candy 1972, Coca-Cola 1988, Apple 2016.
- Creator's 'most face melting chart' and favorite investing data point: hypothetical 99% Berkshire Hathaway decline still beating S&P 500 since 1965.
- Annualized returns from multiple starting points presented as consistently strong, though no specific numbers are given. -
Risk/Reward Framework (⚖️):
- Entry: Not established by the available evidence.
- Stop: Not established by the available evidence.
- Targets: Not established by the available evidence.
- Risk/Reward: Not established by the available evidence.
- Position Size: Not established by the available evidence.
- Probability: Not established by the available evidence. -
Scenario Analysis (🔄):
| Scenario | Probability | Target | Trigger |
|---|---|---|---|
| Bull | Not established by the available evidence. | Not established by the available evidence. | Verification that Berkshire Hathaway would still outperform the S&P 500 since 1965 even after a 99% decline, as creator claims. |
| Base | Not established by the available evidence. | Not established by the available evidence. | Confirmation that Buffett stepped down as chairman and Howie Buffett is stepping in as chairman of the board. |
| Bear | Not established by the available evidence. | Not established by the available evidence. | Independent data contradicts the 99% drawdown outperformance claim or the succession details stated in the transcript. | -
Risk Factors (⚠️):
- The 99% drawdown outperformance claim lacks supporting data in the transcript and requires independent verification of Berkshire Hathaway versus S&P 500 total returns since 1965.
- No exact annualized return figures are given despite the creator describing returns from various starting points.
- Ticker symbols are not stated in evidence; mapping mentioned companies to tradable securities requires external confirmation.
- Succession timing, board mechanics, and full details beyond Howie replacing Buffett as chairman are not specified.
- No entry, stop, target, position size, risk/reward ratio, or probability is established by the available evidence. -
Actionable Trading/Allocation Plan (🎯):
- Verify Berkshire Hathaway versus S&P 500 total return history since 1965, including whether a hypothetical 99% decline would still leave it ahead.
- Confirm Buffett's chairman departure and Howie Buffett's board-chairman appointment via Berkshire Hathaway filings or official press releases.
- Check historical dates and positions cited: See's Candy acquisition in 1972, Coca-Cola purchases starting 1988, Apple purchases starting 2016.
- Seek the exact annualized return figures from various starting points referenced but not numerically stated in the transcript.
- Map company names mentioned — Berkshire Hathaway, Coca-Cola, Apple — to their respective ticker symbols.

-
Creator Horizon Category (⏱️): Short-Term Technical — Creator frames the session around intraday bond velocity, headline volatility, and a potential 'meltup or seven hours to nowhere.'
-
One-Line Thesis (💡): The session is headline- and bond-volatility-driven: diplomacy holding is cited for oil down/market up, while continued bond velocity may pressure equities, bond calm may allow a rip, and chips/memory leadership is emphasized with outcomes ranging from meltup to seven hours to nowhere.
-
Key Data Points (📊):
- Main theme claim: 'diplomacy holding up' is why oil is down and the market is going up.
- Bond velocity claim: bond velocity is taking place; if it keeps going over the weekend, creator says it 'might start to affect equities'; if it stops/chills out, 'there's not going to be much.'
- Session outcome claim: 'either going to get a meltup or we're going to go seven hours to nowhere.'
- Bond volatility claim: last two days were enough to make the quarter historic even though nothing happened until the last 48 hours.
- Rates structure claim: real yields are climbing up while break evens are not moving; creator says this is not because of inflation.
- Catalyst watch: PCE data by Wednesday.
- Catalyst watch: China full results readout Monday, attributed to Greer.
- Tickers/setups: AKAM news after the bell yesterday; Meta and Google were standouts of the week.
- Tickers/setups: Memory, SanDisk, and Micron are going up; chips seem to be doing better in the morning.
- Tickers/setups: PLI had a buyout rumor and is on the high.
- Tickers/setups: KTR jury rumor or idea was correct.
- Tickers/setups: watch insurance companies; Tesla and Intel are closer to earnings.
- Tickers/setups: AMD replaced its CFO, so people sold that off.
- Tickers/setups: Microsoft is printing on the high; Meta is on the low; IGV Cyber is down.
- Early market: Russell and NASDAQ described as 'only up by 0.9 and 2'; SPY is up a little; XLV break even; Staples are down; Financials doing good despite bonds.
- Tickers/setups: Data Dog ripped off AAM/Anthropic deal; Fastly also went up.
- Tickers/setups: Twilio downgraded but premiums are still massive with large spreads; creator also says 'down four at one point again. Same thing with Zcaler.'
- Tickers/setups: Nvidia is going straight up; Qualcomm contracts 'doubled and tripled off the morning'; G&D 'hit seven bucks last night' then came down.
- Tickers/setups: Pepsi at 52-week low; Dell on the high; SMCI mentioned if chips get real bullish; Micron and SanDisk going down later.
- AI trade claim: bond market says the AI trade is not at risk; creator says people are not going to stop the AI trade because of higher rates.
- Other mentions: Costco had earnings yesterday; Bitcoin Fridays is 'not there'; Coin and Hood mentioned; PayPal tweaking.
- Oracle discussed as tying into bonds; CRDO ripped yesterday. -
Technical Levels & Setups OR Macro Drivers (📌):
- Diplomacy headlines holding up, cited by creator as a reason oil is down and the market is up.
- Bond velocity and bond-market volatility as primary equity drivers; creator warns continuation may affect equities and calm may allow a rip.
- Real yields climbing while break evens not moving, which creator says is not inflation-driven.
- Headline-sensitive tape: PLI buyout rumor, KTR jury rumor, AKAM post-bell news, insurance companies, Tesla/Intel earnings proximity.
- Chips and memory leadership: SanDisk, Micron, Nvidia, Qualcomm, SMCI, with memory/chips starting strong.
- Rotation setup: Microsoft strength versus Meta weakness; software/cyber mixed with IGV Cyber down; financials good despite bonds; staples down; XLV break even.
- AI trade resilience claim: creator says higher rates are not a reason to stop the AI trade.
- Catalyst watch: PCE data by Wednesday and China readout Monday.
- AMD CFO replacement as a stock-specific negative reaction.
- Twilio downgrade but still-massive premiums and large spreads; Zcaler weakness. -
Risk/Reward Framework (⚖️):
- Entry: Not established by the available evidence.
- Stop: Not established by the available evidence.
- Targets: Not established by the available evidence.
- Risk/Reward: Not established by the available evidence.
- Position Size: Not established by the available evidence.
- Probability: Not established by the available evidence. -
Scenario Analysis (🔄):
| Scenario | Probability | Target | Trigger |
|---|---|---|---|
| Bull | Not established by the available evidence. | Not established by the available evidence. | Creator says if bond velocity dies/calms from here, 'you're going to rip other' and bond volatility calming historically has led to rips. |
| Base | Not established by the available evidence. | Not established by the available evidence. | Creator says if bond velocity stops here and chills out, 'there's not going to be much,' matching 'seven hours to nowhere.' |
| Bear | Not established by the available evidence. | Not established by the available evidence. | Creator says if bond velocity keeps going over the weekend, it 'might start to affect equities' and likely would be negative. | -
Risk Factors (⚠️):
- Bond velocity continuing after the weekend could affect equities, per creator; this is the main stated invalidation risk to the calm/rip scenario.
- Recent bond volatility is described as historically extreme; if it does not calm, the equity risk remains unresolved.
- Real yields climbing while break evens are not moving is creator's stated rates setup, but it is not independently verified in evidence.
- Headline-sensitive day: diplomacy/oil headlines, PLI buyout rumor, KTR jury rumor, and AKAM news can reverse quickly.
- Mixed internals: Microsoft high, Meta low, IGV Cyber down, staples down, Pepsi 52-week low, and Micron/SanDisk going down later.
- Creator provides no entry, stop, target, risk/reward ratio, position size, or probability.
- PCE data by Wednesday and China readout Monday are unresolved catalysts that could change the bond/equity setup.
- AI-trade resilience to higher rates is a creator claim, not a verified condition.
- Twilio/Zcaler premium and spread behavior may be noisy and is not tied to explicit levels. -
Actionable Trading/Allocation Plan (🎯):
- Monitor bond volatility and whether it continues or calms; compare against creator's stated condition that continuation affects equities and calm allows a rip.
- Track real yields versus break evens to test creator's claim that yields are rising without inflation-driven break-even movement.
- Watch PCE data by Wednesday and China readout Monday as stated catalysts.
- Verify PLI buyout rumor, KTR jury rumor outcome, AKAM post-bell news, and insurance-company moves.
- Monitor chips/memory leadership: SanDisk, Micron, Nvidia, Qualcomm, SMCI, and whether the bid holds or fades.
- Monitor rotation: Microsoft strength versus Meta weakness, IGV Cyber/software, XLV, staples, financials, SPY, Russell, and NASDAQ.
- Check Tesla and Intel into earnings proximity, AMD CFO replacement reaction, and Costco earnings follow-through.
- Track oil and diplomacy headlines because creator cites them as the session's macro driver.
- Observe whether the session resolves into 'meltup' or 'seven hours to nowhere' as creator framed.
- No trade levels are provided in evidence; any execution parameters would require separate verification.

-
Creator Horizon Category (⏱️): Long-Horizon Macro — The creator compares sub 3% mortgage debt against 3 and a half% inflation and 5% high-quality government bond yields and calls the 30-year mortgage an inflation hedge.
-
One-Line Thesis (💡): The creator claims paying off sub 3% mortgage debt early is never a good idea while 3 and a half% inflation and 5% high-quality government bond yields are available, because cash or bonds can offer similar flexibility without illiquidity, though 6% debt is a different conversation.
-
Key Data Points (📊):
- sub 3% mortgage rate — creator says paying off such debt is never a good idea in this rate environment
- 5% high-quality government bonds — creator cites available yield competing with mortgage prepayment
- 3 and a half% inflation — creator cites inflation rate making sub 3% debt attractive
- 6% debt — creator says this is a different conversation from 3% debt
- 3% mortgage rates — creator says if mortgage rates go back to 3%, he is backing the truck up
- 30-year mortgage — creator calls it one of the greatest inflation hedges ever invented
- most other countries do not have 30-year mortgage ability — creator claim
- cash/bonds vs illiquid asset — creator says money used to pay off mortgage could provide same flexibility and freedom and is not sitting in an illiquid asset
- weight lifted — creator says people who pay off mortgage and feel weight lifted are usually rich people who would be fine either way
- behavioral psychology — creator says it is sometimes used as an excuse to make a sub-optimal decision; perfect is enemy of good
- student loan debt — second speaker says he has so much he could not pay it off today; dislikes it but says it is different than a house -
Technical Levels & Setups OR Macro Drivers (📌):
- Yield spread: sub 3% mortgage debt vs 5% high-quality government bonds; creator frames prepayment as giving up higher yield.
- Inflation hedge: 3 and a half% inflation vs sub 3% mortgage; creator favors holding cheap long-duration debt.
- Liquidity setup: cash/bonds offer flexibility and are not illiquid, unlike home equity tied up by mortgage prepayment.
- Rate threshold: creator separates sub 3% debt from 6% debt, saying 6% is a different conversation.
- Rate-regime setup: if mortgage rates return to 3%, creator says he is backing the truck up.
- Behavioral setup: debt-free psychology can drive prepayment even when creator views math as suboptimal; creator says it is usually rich people who feel the weight lifted.
- Student loan contrast: second speaker distinguishes student loan debt from mortgage debt; cannot pay it off today and dislikes it.
- Retirement caveat: creator says even retirees still deal with inflation when considering debt prepayment. -
Risk/Reward Framework (⚖️):
- Entry: Not established by the available evidence.
- Stop: Not established by the available evidence.
- Targets: Not established by the available evidence.
- Risk/Reward: Not established by the available evidence.
- Position Size: Not established by the available evidence.
- Probability: Not established by the available evidence. -
Scenario Analysis (🔄):
| Scenario | Probability | Target | Trigger |
|---|---|---|---|
| Bull | Not established by the available evidence. | Not established by the available evidence. | Sub 3% mortgage rate coexists with 5% high-quality government bond yields and 3 and a half% inflation; creator says prepaying sub 3% debt is never a good idea. |
| Base | Not established by the available evidence. | Not established by the available evidence. | Borrower compares cash/bonds against illiquid home equity; creator says money used to pay off mortgage could give same flexibility and freedom. |
| Bear | Not established by the available evidence. | Not established by the available evidence. | Debt rate is 6% or borrower seeks psychological weight lifted; creator says 6% is a different conversation and behavioral psychology can excuse suboptimal decisions. | -
Risk Factors (⚠️):
- Creator's 5% government bond yield and 3 and a half% inflation figures are asserted without sourcing; verification needed.
- High-quality government bonds are not specified by maturity, duration, credit, or tax treatment; yield comparison to a 30-year mortgage may not be like-for-like.
- Liquidity/flexibility claim assumes cash/bonds remain accessible and ignores emergency-fund, tax, and behavioral considerations.
- Mortgage interest deduction, taxes, and insurance/escrow costs are not addressed in evidence.
- Creator's 'never a good idea' for sub 3% debt is a strong claim that may not apply to all borrowers, especially those with liquidity constraints or retirement needs.
- Second speaker's student loan debt is explicitly described as different from a house, limiting direct comparison to mortgage prepayment.
- If debt rate is actually 6% or mortgage rates return to 3%, creator's own framework changes via different conversation or backing the truck up.
- Behavioral psychology can override spread math; creator acknowledges people may make suboptimal decisions and says perfect is enemy of good.
- No tickers, specific securities, dates, or actionable price levels are provided; verification is limited to macro rate/inflation checks. -
Actionable Trading/Allocation Plan (🎯):
- Verify current yield on high-quality government bonds and compare with the specific mortgage rate in question.
- Verify current inflation rate; creator cites 3 and a half%.
- Classify the debt rate: sub 3% is creator's never-prepay case; 6% is creator's different-conversation case.
- Separate mortgage debt from student loan debt, as second speaker explicitly says they are different.
- Assess liquidity and flexibility needs before comparing cash/bonds with home equity.
- Monitor whether mortgage rates return to 3%, creator's stated trigger for backing the truck up.
- Check whether the 30-year mortgage and other-country availability claims are factually supported.
- Track behavioral/psychological cost of carrying debt; creator acknowledges it but labels it a possible suboptimal-decision driver.

-
Creator Horizon Category (⏱️): Long-Horizon Macro / Structural — The evidence supports this horizon classification.
-
One-Line Thesis (💡): The Compound guest Jonathan Boyar argues stock picking is structurally hard because only about 23.2% of top 500 US stocks held 10 years beat the S&P 500 and 27.7% over three years, while mega-cap concentration and market structure reward owning dominant businesses such as Microsoft and create setups like CRM's Anthropic partnership; he favors concentrated GARP/value opportunism, tax-aware holding, and avoiding falling knives such as Pool Corp at 400/300/200.
-
Key Data Points (📊):
- Stock-picking difficulty — Adam Parker data cited: only 23.2% of top 500 US stocks held 10 years beat the S&P 500.
- Trend — chart period runs from 2002 through today and shows stock-picking difficulty worsening.
- Buy and hold — Jonathan Boyar rejects it as an investment strategy; calls it a result of an investment strategy.
- Taxes — most accounts at Boyar Asset Management are taxable and extremely tax-sensitive; switching requires finding something roughly 25% better.
- Concentration — Jonathan says concentration is okay; 10%-15% Microsoft position if it grew that way; S&P 500 has a 6% Microsoft weight.
- Buffett/Coca-Cola — cited as one of Buffett's biggest mistakes: not selling Coca-Cola in 1998 at 60 times earnings; since then it underperformed the S&P 500.
- Microsoft drawdown — beginning of year was horrible for accounts owning Microsoft; stock went from 579 or whatever to a trough and is back.
- Equal weight — over the last 20 years equal weight significantly underperformed the cap-weighted index, though there were periods when it did not.
- Deep value — Jonathan says deep value may be the worst strategy on the planet; cigar-butt/net-net world is gone; broken retailers do not work.
- Style — Jonathan calls himself value but an opportunist; GARP-ish; high single-digit to mid-teens growers; buy something for less than it is worth.
- Pool Corp — looked somewhat cheap at 400, cheaper at 300, even cheaper at 200; they fortunately did not buy it.
- Falling knife — do not get in front of a freight train; Jonathan described maybe buying a 2% position in a freefall with hope of adding.
- Technical signal — if a stock spends a year declining and then stops going down on continued bad news, that is a technical signal nobody left to sell.
- CRM — previously bullish while stock was hammered; Anthropic partnership changed the picture from threat to partner; comeback occurred; similar setup now over last couple days.
- Market structure — money moves to where it is treated best, with the best companies; most stocks are not going to outperform the S&P 500.
- AI meltdown scenario — if Apple, Nvidia, Google, Meta all go down 70%, there may be other stocks outperforming them.
- Valuation discipline — great business can still be terrible valuation; Coca-Cola at 60 times earnings in 1998 is the cited example. -
Technical Levels & Setups OR Macro Drivers (📌):
- Mega-cap concentration/FANG/Mac 7 since at least 2017 — cited as obvious reason stock-picking hit rate worsened.
- Market structure: money moves to best companies, so most stocks may not keep up with cap-weighted S&P 500.
- Tax-sensitive taxable accounts discourage trimming/switching unless a new idea is roughly 25% better.
- Portfolio construction: willingness to be different, high concentration, multi-year patience, continuous re-evaluation of execution, competition, and valuation.
- Style setup: GARP/value opportunism in dominant or unique businesses, high single-digit to mid-teens growers, bought below worth.
- Avoid deep-value/cigar-butt/broken retailers; they may only have small, short outperformance periods.
- Technical/sentiment setup: do not catch a falling knife; look for seller exhaustion after continued bad news; Pool Corp is the cautionary example.
- Potential CRM/Anthropic partnership setup: previously hammered CRM became partner rather than threatened; similar setup claimed now over last couple days.
- Potential regime change: AI meltdown could broaden outperformance beyond Apple, Nvidia, Google, Meta. -
Risk/Reward Framework (⚖️):
- Entry: Not established by the available evidence.
- Stop: Not established by the available evidence.
- Targets: Not established by the available evidence.
- Risk/Reward: Not established by the available evidence.
- Position Size: 2% position — Jonathan described possibly buying a 2% position in a stock in freefall with hope of adding; sentence cut off.
- Probability: Not established by the available evidence. -
Scenario Analysis (🔄):
| Scenario | Probability | Target | Trigger |
|---|---|---|---|
| Bull | Not established by the available evidence. | Not established by the available evidence. | AI meltdown where Apple, Nvidia, Google, Meta all go down 70% creates room for other stocks to outperform; CRM/Anthropic partnership continues to re-rate a former laggard. |
| Base | Not established by the available evidence. | Not established by the available evidence. | Absence of AI meltdown; continued FANG/Mac 7 dominance since at least 2017; money moves to best companies and most stocks fail to outperform S&P 500. |
| Bear | Not established by the available evidence. | Not established by the available evidence. | Falling-knife value trap: stock looks cheap at 400, then 300, then 200 like Pool Corp; deep-value/broken retailers keep declining; concentrated portfolios suffer years against like Microsoft's early-year drawdown. | -
Risk Factors (⚠️):
- Falling-knife risk: Pool Corp at 400/300/200; do not get in front of a freight train.
- Deep-value/value-trap risk: cigar-butt/net-net approach gone; broken retailers do not work.
- Concentration risk: Jonathan says you need concentration and years against; Microsoft fell from 579 or whatever to a trough.
- Tax sensitivity: taxable accounts may be locked into positions; switching hurdle cited at roughly 25% better.
- Valuation risk: great business can be terrible valuation; Coca-Cola at 60 times earnings in 1998.
- Regime risk: AI meltdown could disrupt mega-cap concentration; not all prior calls worked.
- Verification risk: exact Adam Parker dataset, ticker/price levels, and CRM setup details are not fully specified in the transcript.
- Not established: no explicit entry, stop, target, or risk-reward ratio provided. -
Actionable Trading/Allocation Plan (🎯):
- Track FANG/Mac 7 concentration and equal-weight versus cap-weight S&P 500 performance.
- Monitor CRM and its Anthropic partnership; compare current setup to prior hammered-bullish call.
- Monitor Microsoft drawdown/rebound and concentration weight relative to S&P 500's 6%.
- Check Pool Corp valuation levels cited at 400, 300, 200 against fundamentals and continued bad-news price action.
- Watch for seller-exhaustion technical signal: year-long decline then flat/up price despite bad news.
- Assess tax-aware switching hurdle: whether alternative is at least roughly 25% better than incumbent.
- Track AI meltdown scenario: Apple, Nvidia, Google, Meta 70% drawdowns as potential breadth regime change.
- Separate creator claims from analyst interpretation when verifying; no trade parameters were provided.

-
Creator Horizon Category (⏱️): Long-Horizon Macro — Creator centers on next-year trillion-dollar mega-cap AI capex, free cash flow re-rating, Fed rate hikes, and historical bubble pricking rather than a specific trade.
-
One-Line Thesis (💡): The Compound claims mega-cap AI capex—Amazon, Meta, Microsoft, Alphabet estimated at a trillion dollars next year—was supposed to brake the market, but instead semis are ramping back up and the creator sees no clear bubble-pricker except Fed rate hikes or a universal bubble realization.
-
Key Data Points (📊):
- “Maybe chart of the year” — creator’s label for CapEx vs trailing 12-month FCF chart.
- CapEx of Amazon, Meta, Microsoft, and Alphabet estimated to be a trillion dollars next year — creator’s headline figure.
- Trailing 12-month free cash flow — overlay on the mega-cap CapEx chart.
- Amazon, Meta, Microsoft, and Alphabet described as 40% of the index — concentration claim.
- These companies were “asset light, now they’re asset heavy. A total re-rating.” — creator’s characterization.
- Mag 7 “sort of stalled out in the first half of the year” as investors digested what this means — creator’s market narrative.
- A guy that left OpenAI said “We’re all going to die. 10% chance.” — creator’s cited slowdown whisper.
- The semi trade is ramping back up — creator’s observed market response.
- Fed keeps raising rates — creator’s candidate for pricking the bubble.
- “That’s what finally got Japan” — creator’s historical bubble reference.
- The slowdown was supposed to crash the stock market; creator asks what it will take if not that. -
Technical Levels & Setups OR Macro Drivers (📌):
- Mega-cap AI capex boom: Amazon, Meta, Microsoft, Alphabet estimated $1T next year vs trailing FCF.
- Asset-light to asset-heavy total re-rating for these mega-caps; creator says 40% of index.
- Failed bear catalyst: capex/FCF concern and slowdown whispers did not break market; semis ramping.
- Potential bubble-pricker: Fed keeps raising rates, cited as historical mechanism (Japan).
- Narrative exhaustion: creator describes same conversation weekly and an in-between world. -
Risk/Reward Framework (⚖️):
- Entry: Not established by the available evidence.
- Stop: Not established by the available evidence.
- Targets: Not established by the available evidence.
- Risk/Reward: Not established by the available evidence.
- Position Size: Not established by the available evidence.
- Probability: Not established by the available evidence. -
Scenario Analysis (🔄):
| Scenario | Probability | Target | Trigger |
|---|---|---|---|
| Bull | Not established by the available evidence. | Not established by the available evidence. | Semi trade continues ramping back up and market moves past the slowdown/capex narrative, as creator observes has happened. |
| Base | Not established by the available evidence. | Not established by the available evidence. | Market stays in the creator-described in-between world with the same conversation every week while digesting mega-cap capex and slowdown whispers. |
| Bear | Not established by the available evidence. | Not established by the available evidence. | Fed keeps raising rates, or the slowdown narrative intensifies, or everyone discovers it is a bubble, per creator’s stated potential catalysts. | -
Risk Factors (⚠️):
- The $1T next-year CapEx figure is an estimate; actual company guidance may differ.
- The 40% index concentration claim is unverified in EVIDENCE.
- OpenAI departure/10% doom claim is vague and not sourced in transcript.
- If semis keep ramping and market ignores slowdown, bubble-prick thesis remains inactive.
- Fed rate hike path and timing are not specified.
- No valuation, entry, stop, target, or position-size levels are given. -
Actionable Trading/Allocation Plan (🎯):
- Verify the $1T aggregate capex estimate for Amazon, Meta, Microsoft, and Alphabet against company guidance and data providers.
- Track trailing 12-month free cash flow and capex trends for Amazon, Meta, Microsoft, and Alphabet.
- Monitor the semi trade trend following the creator’s observed slowdown narrative.
- Monitor Fed policy and rate-hike signals as the creator-identified bubble-pricking catalyst.
- Monitor OpenAI-related commentary and departures for AI slowdown signals.
- Verify the claim that Amazon, Meta, Microsoft, and Alphabet are 40% of the index.

-
Creator Horizon Category (⏱️): Long-Horizon Macro / Structural — Creator frames California street-vending legalization and regulatory burden as a structural incentive problem tied to an election.
-
One-Line Thesis (💡): Creator claims California has become upside down—punishing compliant small businesses and rewarding non-compliant street vendors—due to Sacramento's 2018 street-vending legalization and compounding taxes, bureaucracy, permits, electric bills, and licensing costs, and frames the election as the mechanism to reverse it.
-
Key Data Points (📊):
- Headline claim: 'if you do the right thing, you're punished and if you do the wrong thing, you're rewarded. That is upside down.' — creator's framing
- Small business: Latino couple's shoe store in South Central LA; 14 years in operation — creator anecdote
- Street vending: two city blocks of sidewalk vendors selling shoes, apparel, t-shirts — creator anecdote
- Vendor noncompliance: not paying tax, not paying electric, not paying rent, not complying with licensing — creator claim
- Timeline: vendors appeared 'last six or seven years' — creator claim
- Policy catalyst: 2018 bill in Sacramento legalized street vending in California — creator claim
- Preemption: cities can't do anything about it; counties can't do anything about it — creator claim
- Compliance burden: taxes, ridiculous bureaucracy, permits more complicated and costly every year, electric bill — creator claim
- Election framing: 'That's what this election is actually about' — creator claim
- No ticker, price level, valuation, or market instrument established by evidence -
Technical Levels & Setups OR Macro Drivers (📌):
- 2018 California street-vending legalization as structural catalyst
- City and county preemption limiting local enforcement
- Cost and compliance asymmetry: taxes, permits, bureaucracy, electric, rent, licensing
- Compliant small business losing to untaxed, unlicensed sidewalk vendors
- Election as potential policy reversal mechanism -
Risk/Reward Framework (⚖️):
- Entry: Not established by the available evidence.
- Stop: Not established by the available evidence.
- Targets: Not established by the available evidence.
- Risk/Reward: Not established by the available evidence.
- Position Size: Not established by the available evidence.
- Probability: Not established by the available evidence. -
Scenario Analysis (🔄):
| Scenario | Probability | Target | Trigger |
|---|---|---|---|
| Bull | Not established by the available evidence. | Not established by the available evidence. | Creator says the election is about turning around the upside-down incentive structure |
| Base | Not established by the available evidence. | Not established by the available evidence. | Creator says cities can't do anything about it and counties can't do anything about it |
| Bear | Not established by the available evidence. | Not established by the available evidence. | Creator says the 14-year business is going out of business because vendors are not paying tax, electric, rent, or licensing | -
Risk Factors (⚠️):
- 2018 Sacramento bill is not named or cited with a statute identifier
- No quantitative evidence on vendor counts, tax losses, or revenue impact
- Single unnamed business anecdote; no independent verification
- No election policy proposal or probability is established
- No ticker, market, or portfolio implication is established
- Creator dismisses pandemic as a cause but cites only personal inquiry -
Actionable Trading/Allocation Plan (🎯):
- Verify the 2018 Sacramento/California street-vending legalization bill and its preemption provisions
- Check city and county enforcement authority and any subsequent amendments
- Obtain sales-tax, licensing enforcement, and small-business closure data for the relevant LA areas
- Monitor election platforms and post-election policy proposals for reversing street-vending legalization or restoring enforcement
- Separate creator anecdote from verified macro indicators; no trade parameters are established

-
Creator Horizon Category (⏱️): Short-Term Technical — Creator emphasizes same-session action in bonds/oil, Oracle credit-default swaps, Meta post-event trading, and index/rotation levels.
-
One-Line Thesis (💡): Creator frames the session around bonds and oil, a 10-year yield at 5.1, Oracle credit-default-swap stress, and a post-event Meta holding pattern, with staples/healthcare leading while chips/software/cyber lag.
-
Key Data Points (📊):
- Creator: headline 'today is about bonds and oil.'
- Creator: 10-year yield already at 5.1.
- Creator: oil has come back up; higher oil may cause more bond freakout.
- Creator: Oracle has bad news tied to bonds; Oracle credit default swaps breaking out; worries about inability to fulfill contracts/payments; Oracle down four, surprising only four.
- Creator: Meta event was after hours and 'wasn't a dud'; possible delayed reaction; Meta started lower but back up; either holds and rips all day or dies after about 2 minutes.
- Creator: China event today/tonight; waiting game; China was one of only countries that didn't do too hot; rest of world stable.
- Creator: 'weeble wobble'; Monday momentum lacked matching events.
- Creator: Kroger, MO, XLP staples off to decent/great start; Kroger staple leader; MO close play went up; sold MOS for 100%.
- Creator: XLV up by 6; healthcare/drugs; J&J ripping; drugs still point4 but smaller.
- Creator: IBB barely green; biotechs active; SRZN Merc read-through/approval, up 100%, earlier up 50, may lack open options chain.
- Creator: K&F got stake taken by Starboard; Core got upgrade; Amber had rumor; watch if Skyworks gets linked.
- Creator: IGV cyber dynamic; Meta wasn't that bad; be careful Meta first 5-10-30 minutes.
- Creator: Palantir breakeven on contract; expires tomorrow; Meta right back to yesterday's level; Meta October contract still bid; short-term premiums lower.
- Creator: Meta premiums are lower; 'you want the metas when the premiums are high'; October contracts doing good; short-term premium not so much.
- Creator: Airbnb off open; premiums clapped; may need partner with Muse.
- Creator: Google Gemini 4 Pro/Gemini news but not moving; Apple breakeven; Mag 7 not helping; yesterday Mag 7 hurt more.
- Creator: chips down, IGV down, cyber down; no winner yet; need chips/software/cyber/Mag 7 leader.
- Creator: SPY down point4; NASDAQ down by 6; Dow down quarter; Russell down quarter; SPY later up for now with small moves.
- Creator: financials weeble wobbly; SPY doing decent; Dow/Russell down quarter.
- Creator: Nibbus/Nebius going very well.
- Creator: Qualcomm had Apple deal/renewal but did not do much; likes 200 level.
- Creator: Oracle down four; Sentinel; cyber names Palo Alto and Crowd not bad yesterday; Zcaler won't let down.
- Creator: Trump to decide shortly on new Taiwan arms package; could be bad for China, piss off Xi.
- Creator: Apollo Alto/Palo Alto October play is cheap; unsure juice; if led yesterday might come down later.
- Creator: GLND update/extended energy agreement; Gremlin/Germal/Greenland doing another one of those days.
- Creator: Snowflake going down; did a little time; not a recommendation; Snowflake did nothing yesterday.
- Creator: Intel and AMD solid; Intel earnings October 22nd.
- Creator: Fastly still up from yesterday; Tenable; J&J ripping. -
Technical Levels & Setups OR Macro Drivers (📌):
- Bonds/oil dual driver: 10-year at 5.1; oil back up; creator says higher oil may increase bond freakout.
- Oracle credit-default-swap breakout; creator compares to prior CDS episode and flags contract/payment fulfillment risk.
- Meta after-hours event; delayed reaction possible; first 5-10-30 minutes and 1-hour hold are key creator watchpoints.
- China event tonight; global markets stable except China did not do too hot; waiting game into after-bell catalyst.
- Rotation into staples/healthcare: XLP, Kroger, MO, J&J, XLV, IBB biotech active.
- Cyber/software/chips/Mag 7 setup: IGV cyber, software down, chips down, Mag 7 not moving, no winner yet; creator says need a leader.
- Biotech headlines: SRZN Merc read-through up 100%; IBB active.
- Options/premium setup: Meta premiums lower but October contracts bid; creator says want metas when premiums high; SRZN options maybe absent/laggy.
- Risk that yesterday's leaders fade: Palo Alto, Crowd, cyber winners may come down later. -
Risk/Reward Framework (⚖️):
- Entry: Not established by the available evidence.
- Stop: Not established by the available evidence.
- Targets: Not established by the available evidence.
- Risk/Reward: Not established by the available evidence.
- Position Size: Not established by the available evidence.
- Probability: Not established by the available evidence. -
Scenario Analysis (🔄):
| Scenario | Probability | Target | Trigger |
|---|---|---|---|
| Bull | Not established by the available evidence. | Not established by the available evidence. | Creator: Meta holds up after an hour and/or holds and rips all day; staples/healthcare continue leading; chips/software/cyber turn on. |
| Base | Not established by the available evidence. | Not established by the available evidence. | Creator: 'weeble wobble,' waiting game, today more tame than yesterday, rest of world calm, market digesting Meta and waiting on China after bell. |
| Bear | Not established by the available evidence. | Not established by the available evidence. | Creator: Meta dies after about 2 minutes; higher oil causes more bond freakout with 10-year at 5.1; Oracle CDS/payment concerns escalate; China/Taiwan arms headline negative. | -
Risk Factors (⚠️):
- Bond freakout if oil rises; creator cites 10-year at 5.1.
- Oracle CDS breakout and possible inability to fulfill contracts/payments; creator says Oracle down four.
- Meta post-event either rips or dies after about 2 minutes; creator flags first 5-10-30 minutes and 1-hour hold uncertainty.
- China event tonight and Taiwan arms package could create negative headline.
- Chips/software/cyber not leading; creator says no winner yet, IGV/cyber down, software down.
- Mag 7 not helping; Google Gemini 4 Pro news not moving; Apple breakeven.
- Low Meta premiums/short-term premium not attractive; October contracts bid; SRZN options chain may be unavailable/laggy.
- Creator's trades have no stated entry/stop/target/size/probability; claims are unverified. -
Actionable Trading/Allocation Plan (🎯):
- Monitor 10-year yield around creator-cited 5.1 and oil rebound to verify bonds/oil thesis.
- Track Oracle credit default swaps and Oracle price, with creator citing Oracle down four, for credit-stress confirmation.
- Observe Meta in first 5-10-30 minutes and after 1 hour against creator's hold-rip versus 2-minute-die framing.
- Track China event tonight and any Taiwan arms package headline for China risk.
- Monitor rotation: XLP staples including Kroger and MO, XLV/drugs/J&J, IBB biotech, financials, SPY/Nasdaq/Dow/Russell.
- Monitor IGV cyber, software, chips, Mag 7, AMD/Intel, Qualcomm Apple deal, HPE, Nvidia, Google Gemini 4 Pro, and Apple.
- Treat creator's position mentions, including Apollo Alto October, Snowflake time, and MOS sold for 100%, as claims; no entry/stop/target/size provided.

-
Creator Horizon Category (⏱️): Long-Horizon Macro / Structural — Creator frames open-model AI adoption as a broad structural force across every company, industry, researcher, teacher, student, and startup in the AI race.
-
One-Line Thesis (💡): The All-In Podcast speaker claims that $400B of venture funding went into AI-native companies in the last six months, 80% of which use open models, and that open models—largely contributed by Chinese engineers—are essential for broad US AI-race success rather than only a few technology companies winning.
-
Key Data Points (📊):
- $400 billion — venture funding into AI-native companies in the last six months, per creator claim.
- 80% — share of those AI-native companies that use open models, per creator claim.
- Vast majority — share of the world's contribution to open source today coming from China, per creator claim.
- More engineers — reason creator gives for China's open-source contribution.
- Linux, Kubernetes, all the software — examples creator cites as open-source downloads touched by Chinese contributors.
- Once you download it, it's yours; we fork it, improve it, make it ours — creator's characterization of open-source model use.
- Chinese models — creator says they are made by great researchers in China but become the downloader's.
- AI race — creator says it is not about a few technology companies winning; every company, industry, researcher, teacher, student, startup, everybody wins.
- Closed models — creator says some will still use closed models.
- No specific tickers or traded companies named — macro keywords include AI-native companies, open models, frontier labs, China, US, open source, and AI race. -
Technical Levels & Setups OR Macro Drivers (📌):
- Open models let AI-native startups build dreams different from frontier labs' dreams.
- China's large engineer base drives the majority of global open-source contribution.
- Open-source norms allow download, fork, improvement, and ownership: creator asserts downloaded Chinese models become 'yours'.
- US innovation strength described as many different ways to innovate and ideas coming from the fountain.
- Broad diffusion thesis: AI-race success requires every company, industry, researcher, teacher, student, and startup to win, not only a few tech companies.
- Closed models remain part of the mix: creator says some will use closed models. -
Risk/Reward Framework (⚖️):
- Entry: Not established by the available evidence.
- Stop: Not established by the available evidence.
- Targets: Not established by the available evidence.
- Risk/Reward: Not established by the available evidence.
- Position Size: Not established by the available evidence.
- Probability: Not established by the available evidence. -
Scenario Analysis (🔄):
| Scenario | Probability | Target | Trigger |
|---|---|---|---|
| Bull | Not established by the available evidence. | Not established by the available evidence. | 80% of AI-native companies using open models and open models enabling broad startup and industry participation. |
| Base | Not established by the available evidence. | Not established by the available evidence. | Some AI-native companies use open models while some use closed models, with broad AI-race participation across every company, industry, researcher, teacher, student, and startup. |
| Bear | Not established by the available evidence. | Not established by the available evidence. | The unresolved question 'Does it matter if open models come from China or the US?' becomes a constraint via policy, licensing, or enterprise-procurement restrictions on Chinese-origin open models. | -
Risk Factors (⚠️):
- Creator does not cite a source for the $400B venture-funding figure or the 80% open-model usage figure.
- 'Vast majority' of open-source contribution from China is unquantified; no percentage, date range, or dataset is provided.
- The provenance question about Chinese open models is raised but not resolved by the creator.
- No tickers, valuations, entry levels, exit levels, or portfolio implications are established in the evidence.
- Potential licensing, security, and geopolitical verification gaps for Chinese-origin open models are not addressed. -
Actionable Trading/Allocation Plan (🎯):
- Verify the $400B AI-native venture-funding claim over the stated six-month window against venture-capital databases.
- Verify the 80% open-model usage claim among AI-native companies via surveys, disclosures, or model-hosting data.
- Track open-source model provenance and contributor-country metrics to test the 'vast majority from China' claim.
- Monitor US and China policy, licensing, and enterprise-procurement treatment of Chinese-origin open models.
- Monitor open versus closed model adoption by startups and industries, and track broad AI-diffusion metrics across companies, researchers, teachers, and students.

-
Creator Horizon Category (⏱️): Short-Term Technical — Creator focuses on daily, weekly, and monthly chart levels, relative strength ratios, and near-term catalysts for MSOS and TRLV.
-
One-Line Thesis (💡): TheChartGuys Dan claims cannabis sector names MSOS and TRLV are showing unusual relative strength and constructive weekly/monthly technical setups, but he says a durable move still needs catalysts like Schedule III and more uplistings, with MSOS 597/725 and TRLV 1328 as key confirmations.
-
Key Data Points (📊):
- Creator claims almost 16 years trading cannabis; 2014 penny stock boom grew account $3,000 to $100,000.
- Creator cites Canadian cannabis boom 2017/2018 as another account level-up and says he treated the first day of Canadian sales as sell-the-news.
- Today cannabis is green while the majority of the market is red; creator cites NYSE 75% red, 25% green.
- MSOS monthly: higher low at 388; level 597; break 597 equals 10% upside and would be first confirmed monthly uptrend in a year.
- MSOS weekly: 468 most important support; if 468 breaks, creator would size down; $6 wall resistance; wants $5 hold as support; resistance 5 to 506; next resistances 540, 562, 597; break 6 and 725 for long-term bottom.
- MSOS overhead supply: bag holders at $8, $10, $24; creator says all-time highs not anytime soon.
- TRLV: weekly bull flag confirmed; recent high 1328 is most important resistance; topped in 13s in June, April 2024, May 2024, October 2024; wants $12 prior resistance hold as support.
- TRLV/MSOS ratio: if weekly EMA12 is support, creator says TRLV is lead bull; if lost, reassess/trim TRLV and maybe flip to GTBif.
- Holdings/disclosures: MSOS and TRLV tied as largest; has Cron; stopped out of Glass due to glaring relative weakness; Glass double topped at all-time highs.
- Catalysts: Schedule III becoming official; ideally more names uplisting; TRLV uplisting and passive index additions create institutional/passive buying.
- Social media: creator says attention is required for big sector moves; in 2013 counted Investors Hub posts to gauge OTC penny stock sentiment.
- Leaf: playing catch-up with recent relative strength; key resistance zone 1230 to 1242 had three major tops; creator says extended before transcript cuts off.
- Macro: NASDAQ and S&P 500 initially rejecting from all-time highs but strong since FOMC; semiconductors strong; breadth not great.
- Crypto and cannabis described as most high-risk, high-reward places for money. -
Technical Levels & Setups OR Macro Drivers (📌):
- Cannabis relative strength on a broad red day, with MSOS making new highs not by a lot while NYSE is 75% red.
- MSOS monthly equilibrium/balancing scales bottom; break of 597 would confirm monthly uptrend after a building base.
- MSOS weekly bull flag held weekly EMA12 and set a higher low; 468 is key support.
- TRLV uplisting plus passive index inclusion as a cited institutional/passive buying catalyst.
- TRLV weekly bull flag and relative strength vs MSOS via TRLV/MSOS weekly EMA12.
- Schedule III official and more uplistings described as dangling carrots needed to kick off sector.
- Social media attention and sentiment flagged as necessary for big cannabis moves.
- Broader market strength supports risk appetite for high-risk crypto and cannabis.
- Glass House relative weakness led creator to stop out and illustrates selling weaker names. -
Risk/Reward Framework (⚖️):
- Entry: Not established by the available evidence.
- Stop: Creator states he would size down if MSOS 468 breaks; exact stop price Not established by the available evidence.
- Targets: Not established by the available evidence.
- Risk/Reward: Not established by the available evidence.
- Position Size: Not established by the available evidence.
- Probability: Not established by the available evidence. -
Scenario Analysis (🔄):
| Scenario | Probability | Target | Trigger |
|---|---|---|---|
| Bull | Not established by the available evidence. | MSOS 597 and 725; TRLV 1328 cited confirmation/resistance levels. | MSOS breaks 597 and eventually 725, TRLV breaks 1328, and TRLV/MSOS weekly EMA12 holds as relative-strength support; catalysts like Schedule III or uplistings appear. |
| Base | Not established by the available evidence. | Not established by the available evidence. | MSOS holds 468 and $5 support, TRLV holds $12 and weekly EMA12 vs MSOS, and daily higher lows form while waiting for catalyst. |
| Bear | Not established by the available evidence. | Not established by the available evidence. | MSOS loses 468, TRLV loses weekly EMA12 relative-strength support vs MSOS, or relative weakness like Glass House recurs. | -
Risk Factors (⚠️):
- Overhead supply from bag holders at MSOS $8, $10, $24 may cap upside; creator says all-time highs not anytime soon.
- No catalyst confirmed; Schedule III and more uplistings are still dangling carrots with unknown timing.
- MSOS 468 break would be a major red flag; creator would size down.
- TRLV failure at 1328 initial test could require a daily higher low; losing weekly EMA12 ratio support triggers reassessment or trim.
- Broader market breadth not great; high-risk sectors depend on sustained risk appetite.
- Sector sentiment is emotional; creator notes people fall in love with stocks and ignore technicals.
- Transcript ends mid-sentence on Leaf, limiting full verification of Leaf setup.
- Past performance claims including $3,000 to $100,000 and 16 years are creator assertions not independently verified in evidence. -
Actionable Trading/Allocation Plan (🎯):
- Monitor MSOS monthly 597 and 725, weekly 468, $5 support, and resistance 540/562/597 for confirmation or invalidation.
- Monitor TRLV 1328 resistance, $12 support, and TRLV/MSOS weekly EMA12 ratio for lead-bull relative strength.
- Track Schedule III official news, additional cannabis uplistings, and TRLV passive index additions.
- Track broader market: NASDAQ/S&P 500 post-FOMC trend, semiconductor strength, breadth, and NYSE advancers/decliners.
- Gauge social-media attention and sentiment for cannabis as creator flags it as necessary for big moves.
- Verify creator's disclosed holdings and changes: MSOS/TRLV largest, Cron holding, stopped out Glass.
- Revisit transcript source for truncated Leaf analysis and exact trade parameters not stated.

-
Creator Horizon Category (⏱️): Long-Horizon Macro — Creator frames the oil export ban and currency-debasement setup as a long-term macro ownership thesis while discussing a current policy catalyst.
-
One-Line Thesis (💡): Creator claims the oil export ban, including a rumored 90day diesel ban, is the red button that would confirm a serious oil problem, turn US oil abundance into a rest-of-world energy/inflation problem, produce supply-side inflation, weaken foreign currencies while strengthening the dollar/currency debasement, and create nominal upside in exposed markets like Korea (EWY/EWI), while stressing that without an actual ban and global inflation none of it matters.
-
Key Data Points (📊):
- Oil export ban called the red button — creator says if they ban exports on diesel or any oil, it means a serious oil problem.
- Politico rumor of a 90day diesel ban — creator cites it as bubbling up but says nothing has happened yet.
- No export ban has occurred — creator stresses the red button has not been pressed yet.
- If exports are banned: America crude oil goes down; rest of the world oil goes up — creator's stated transmission.
- GDP is literally AI and oil — creator's claim for the K-shaped economy.
- Lowest net retail flows since CO seasonal buys — creator cites weak retail buying versus high turnover.
- Turnover highest ever — creator says people own less and trade more.
- Argentina 2022 — creator cites 9% inflation and a stronger dollar while Argentina's currency was murdered and its stock market shot up.
- Venezuela, Turkey, Zimbabwe — creator cites currency destruction and stock markets rocketing up.
- Korea memory, EWY, EWI — creator says Korea is the primary country with in-demand goods and weaker-currency effect, creating a double whammy.
- WTI and Brent — creator says WTI can go down while Brent and other costs go up.
- Long-dated oil futures — creator says he would care if they break out and then an oil export ban follows.
- 2020 March to December money supply — creator says inflation came later with supply-chain issues.
- Start a brand new one from about $500 — creator references a new portfolio/account and long-term ownership. -
Technical Levels & Setups OR Macro Drivers (📌):
- War in Iran and oil volatility did not produce a new high or new low — creator says doomerism would have clapped traders.
- Oil export ban discussion has gone mainstream across senators, Bloomberg, CNBC, Politico, and Wall Street Journal.
- Creator sees a very tight window for how the oil export ban scenario plays out.
- Ban exports -> US crude down, rest-of-world oil up -> higher energy/costs -> global supply-side inflation.
- Weaker global currencies with a stronger dollar — creator cites this as normal during conflict and as currency debasement.
- Supply-side inflation is the near-term hit; creator says he was less worried about tariff inflation.
- Currency-debasement examples: Argentina, Venezuela, Turkey, Zimbabwe.
- Korea/EWY/EWI setup: weaker currency plus in-demand memory goods, described as a double whammy.
- Long-term ownership and own land — creator repeatedly urges not getting shaken out and not becoming a doomer.
- AI and oil as the only GDP drivers — creator's K-shaped economy claim.
- Retail flows low while turnover is high — creator's ownership-versus-trading concern. -
Risk/Reward Framework (⚖️):
- Entry: Not established by the available evidence.
- Stop: Not established by the available evidence.
- Targets: Not established by the available evidence.
- Risk/Reward: Not established by the available evidence.
- Position Size: Not established by the available evidence.
- Probability: Not established by the available evidence. -
Scenario Analysis (🔄):
| Scenario | Probability | Target | Trigger |
|---|---|---|---|
| Bull | Not established by the available evidence. | Not established by the available evidence. | If an oil export ban is enacted and leads to global/supply-side inflation, creator expects weaker foreign currencies, stronger dollar, currency debasement, and nominal stock-market rises in exposed countries; Korea/EWY/EWI additionally has memory demand. |
| Base | Not established by the available evidence. | Not established by the available evidence. | If there is no oil export ban, or if a ban does not lead to global inflation/supply-side inflation, creator says none of it matters and nothing has really changed. |
| Bear | Not established by the available evidence. | Not established by the available evidence. | If export ban occurs and the rest of the world gets higher energy/cost disruption and inflation, creator says our problem turns into the rest of the world's problem, with weaker currencies and higher costs. | -
Risk Factors (⚠️):
- No actual oil export ban; Politico 90day diesel ban remains a rumor.
- If no export ban occurs, creator's stated thesis does not activate and nothing has really changed.
- If a ban does not lead to global inflation or supply-side inflation, creator says none of it matters.
- Creator warns against jumping the gun or getting married to the idea.
- A choppy, diluted, or watered-down ban may reduce or eliminate the described effects.
- Country examples such as Argentina, Venezuela, Turkey, and Zimbabwe may not map cleanly to Korea.
- Korea memory demand may persist regardless of the currency-debasement setup, so it is not purely a currency trade.
- Timeline and midterm connection are mentioned but not detailed in the evidence.
- WTI, Brent, dollar, and foreign-currency effects require separate verification. -
Actionable Trading/Allocation Plan (🎯):
- Monitor for an actual oil export ban or diesel export ban versus the Politico rumor; confirm whether policy is enacted.
- Track long-dated oil futures for a breakout, which creator identifies as a condition to care.
- Verify whether any ban produces global supply-side inflation and currency moves such as weaker foreign currencies and a stronger dollar.
- Monitor WTI versus Brent spreads, global energy costs, and inflation data.
- Monitor Korea memory demand and EWY/EWI price and currency effects.
- Check retail flow and turnover data against creator's low-flow/high-turnover claim.
- Verify the AI-and-oil GDP claim and the K-shaped economy characterization.
- Track any midterm connection if creator provides specific evidence later.
- Separate creator's long-term ownership advocacy from any trade setup; no entry, stop, target, size, or probability is provided.
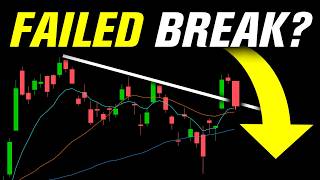
-
Creator Horizon Category (⏱️): Short-Term Technical — Analysis focuses on SPY/ES daily, hourly, and weekly levels, market internals, and next-session pathing rather than long-horizon macro or structural valuation.
-
One-Line Thesis (💡): Trade Brigade's Matt says the S&P 500 rally is not healthy or broad-based because RSP equal weight and small caps made new closing lows and Mag 7 names dragged, while SPY/ES 766 (Monday low/confluence) is the key short-term level to watch for a possible look-below-and-fail versus a bear-flag breakdown.
-
Key Data Points (📊):
- Headline: S&P 500 gave back too much of its move; RSP equal weight broke down and made a new closing low; small caps also made a new closing low in this recent sequence.
- Headline: only bright green on screens were interest rates and maybe cybersecurity; creator says he is long cybersecurity because it has not stopped him out.
- Creator framing: not calling a failed breakdown at index level because cues are 'not so bad,' but says this is not a healthy broad-based rally and stock-picking matters.
- SPY daily: CPI lower high broken; brand new highest high in trend count; can afford a higher low; soft higher low because hourly trend never flipped down.
- SPY daily: firm higher low ideally over reclaim of previous balance range lows, previous all-time high 76025, daily 50 SMA, and gap fill reversal from Friday's high.
- Monday rally described as straight-up risk-on bid and fully unwound; today's open described as unrelenting sell-off/liquidation break off highs.
- Key level into tomorrow: Monday low at 766.
- Volume today higher than volume on Monday follow-through; creator says that is not what he wants to see for simple sideways digestion.
- Feared pattern: moving goalposts from gap fill reversal to FOMC low to 50 SMA while price moves lower.
- Hourly: fail 76875 represents midpoint of balance range and important flip-flop level; failure to reclaim could look like hourly bear flag.
- Fibonacci 38.2 from lows to highs mentioned as intraday reference.
- Anchored VWAPs: all-time high anchored VWAP and FOMC anchored VWAP cited; confluence at 766.
- Upside reference: liquidation origin from today's session at 77275; 'back towards the scene of the crime.'
- Weekly: previous weekly bar high not broken before Monday gap up; risk of upper wick/inverted hammer; take out low could mean lower beyond 50 SMA.
- Market internals: sell-side volume, cumulative volume on exchange, advance/decline, cumulative build; Monday reads versus Wednesday.
- Monday drivers cited: Intel, AMD, ARM, Meta, Muse AI, cybersecurity/CYER names.
- Market profile: value shifted higher Monday bullish; Tuesday unchanged; A period single prints; B-shaped profile; liquidation break; value lower underneath Monday.
- Value area high for tomorrow roughly 77.88 on ES; cash S&P equivalent around 76875; break above could form hourly inverted head-and-shoulders.
- Nasdaq cues: not as bad; tiny breach of prior day's low then closed back inside range; extended through upper bound of weekly expected move; could afford daily higher low over 73425 with upper bound of weekly expected move. -
Technical Levels & Setups OR Macro Drivers (📌):
- Narrow leadership: Monday rally driven by Intel, AMD, ARM, Meta, Muse AI, cybersecurity; Wednesday Mag 7 drag pulled index down.
- Breadth deterioration: RSP equal weight and small caps new closing lows; not broad-based.
- Bull setup: quick look below and fail 766, hold support, reclaim/break 76875, then upside toward liquidation origin 77275 and possibly higher.
- Bear setup: failure above 76875, chop/consolidation, hourly bear flag, gap close threat, break of 766 opens lower beyond 50 SMA.
- Weekly candle setup: avoid big upper wick/inverted hammer; shallow look below/fail and rally could produce more acceptable weekly bar.
- Market profile setup: value lower underneath Monday; value area high roughly 77.88/76875 is key for dip buyers.
- Nasdaq relative setup: less bad, closed back inside range; 73425 daily higher-low reference. -
Risk/Reward Framework (⚖️):
- Entry: Not established by the available evidence.
- Stop: Not established by the available evidence.
- Targets: Not established by the available evidence.
- Risk/Reward: Not established by the available evidence.
- Position Size: Not established by the available evidence.
- Probability: Not established by the available evidence. -
Scenario Analysis (🔄):
| Scenario | Probability | Target | Trigger |
|---|---|---|---|
| Bull | Not established by the available evidence. | Not established by the available evidence. | Quick look below and fail at 766, respect moving-average stack/8 EMA, reclaim 76875, and avoid weekly inverted hammer; creator cites potential up-and-out toward 77275. |
| Base | Not established by the available evidence. | Not established by the available evidence. | Failure to go lower at top of gap 766 and balances out into end of week after a shallow look below/fail; consolidation without reclaiming 76875 may remain suspect. |
| Bear | Not established by the available evidence. | Not established by the available evidence. | Fails to get above 76875, chops/consolidates as hourly bear flag, closes gap, and/or takes out 766; creator warns lower beyond 50 SMA and ugly weekly close. | -
Risk Factors (⚠️):
- Breadth risk: RSP equal weight and small caps new closing lows undermine broad-based rally case.
- Leadership risk: reliance on narrow names; Mag 7 drag can erase index progress.
- Volume risk: higher sell-side volume than Monday follow-through suggests distribution, per creator.
- Weekly candle risk: upper wick/inverted hammer and failure at top of range.
- Narrative risk: moving goalposts to new support excuses while price moves lower.
- Verification gap: creator does not provide explicit entry, stop, target, position size, probability, or risk-reward ratio for cited setups; cybersecurity long lacks parameters.
- Transcript truncation: Nasdaq section ends mid-level 73425/upper bound. -
Actionable Trading/Allocation Plan (🎯):
- Monitor SPY/ES 766 Monday low for look-below-and-fail versus decisive breakdown; verify with price action and close.
- Track 76875 balance-range midpoint/value-area-high equivalent; reclaim versus failure informs bullish versus bear-flag reading.
- Watch 77275 liquidation origin as cited upside reference, not as a stated target parameter.
- Check weekly close for upper wick/inverted hammer risk and whether prior weekly bar high is reclaimed.
- Track RSP equal weight and small-cap breadth for new lows versus stabilization.
- Monitor Mag 7 names and Monday drivers: Google, Broadcom, Amazon, Nvidia, Apple; Intel, AMD, ARM, Meta, Muse AI, cybersecurity.
- Review market internals: sell-side volume, cumulative volume, advance/decline, market profile value area high roughly 77.88/76875.
- For Nasdaq cues, verify 73425 daily higher-low reference and behavior around upper bound of weekly expected move.
- Note creator says he is long cybersecurity; because no entry, stop, or size is disclosed, treat as a stated position, not a risk-defined plan.

-
Creator Horizon Category (⏱️): Short-Term Technical — The creator frames the note around daily consolidation, 4-hour trend changes, EMA health guides, rotation, and weekly/monthly higher-low context.
-
One-Line Thesis (💡): Joey of TheChartGuys claims a strong leg up in the 10-year yield and rising next-month FOMC rate-hike odds coincide with inevitable daily equity consolidation, while he rejects the Twitter 'generational top' narrative if EMA support and capital rotation hold.
-
Key Data Points (📊):
- S&P 500: 3.61% straight-line move; daily consolidation is not shocking or unhealthy; holding EMAs keeps all-time highs within a stone's throw; losing EMAs increases odds of staying sideways.
- NASDAQ: similar big move off lows; daily 12 EMA is a rough guide for whether consolidation remains healthy; NQE ratio monthly higher low is giving tech a tailwind; watch potential monthly lower high.
- 10-year yield: strong leg up as rate hikes for next month's FOMC rise significantly.
- Metals: continue to struggle to shape up healthy weekly higher lows.
- SMH: broke bull from potential megaphone; got monthly higher low following INTC, TSM, SNDK, MU, and NASDAQ; daily stair-step; watch 12 EMA as health guide; if lost, stays in big sloppy sideways balance area.
- IGV: green day; potential head-and-shoulders action; each leg up decreases odds; if bears defend resistance, two-day EQ is most likely; bears need increasing downside volume for monthly consolidation.
- MAGS: macro rising wedge resistance after a more confident new all-time high; daily consolidation underway; watch 12 EMA for daily higher low.
- XLF: trying to put in a bottom but closed near low of day; hourly 12 EMA resistance is sign for daily bounce; daily oversold; most likely scenario is monthly higher low; XLF SPY ratio break bearish preceded waterfall.
- XLV: weak bounce; higher high with no follow-through repeated; bears hopeful to defend all-time highs, confirm weekly downtrend, and get monthly consolidation; watch previous all-time high and monthly 12 EMA.
- XLF SPY ratio: monthly lower high expected on bounce; ratio broke bear out of sideways range when XLF came unglued.
- XLV SPY ratio: similar setup to XLF SPY but less clear; most important support cited is 2162.
- INTC: healthy at highs, within a stone's throw of all-time highs; watch daily 12 EMA; gap fill at 11137.
- SNDK: broke out of tightening range but little follow-through; a couple more red days would open door to balance within initial pullback range.
- MU: more follow-through than SNDK but relative weakness today; ideal bull look is hold breakout on back test and see another leg up; falling back into range is balance-like.
- AMD: new all-time highs, lead bull on this leg up; relative strength followed through; watch daily stair-step and hourly oversold back burner.
- Tesla: new highs but haphazard action; watching higher lows and weekly pseudo stair-step; 30% move but required sitting through corrective price action.
- SPCX: potentially getting ready to set a more confident weekly lower high and tighten up; had relative weakness today.
- Microsoft: continuing to tighten; daily range very tight; break anticipated to bring volume and volatility; bull break could help IGV negate two-day head-and-shoulders; bear break could bring IGV monthly consolidation.
- Amazon: nice move off monthly 12 EMA; now pulling back more than bulls want; bulls need daily uptrend to take step toward monthly higher low; would have hoped consolidation held 50% retrace; bears maintain control as long as 25949 is resistance.
- Apple: new all-time high, not much follow-through; watching little haphazard daily uptrend and weekly higher low room next consolidation.
- Dell: pulling back; daily consolidation healthy if 12 EMA holds; if lost, watch weekly 12 EMA.
- HACK: another leg up this week; nothing too impulsive but slinking through blue skies; weekly 12 EMA rider on watch next consolidation.
- MRNA: breaking out of tightening range; volume drains during tightening and comes back on break; daily consolidation likely; bulls look for daily higher low and watch 12 EMA; bears need break of today's low tomorrow for daily consolidation.
- NBDA: daily consolidation underway; lots of room for higher low; holding 50% retrace keeps all-time-high move hopeful; losing it may mean staying tightening and rejecting falling-wedge resistance/support line.
- Google: smoked today but staying within balance; creator has little interest in names in middle of balance; longs look better off lows, shorts off highs.
- NBIS: tightening; if back down into 212s, bulls start looking for positions; then watch whether it breaks bull for monthly bull flag or bear toward monthly 12 EMA.
- NCLD: Neoclouds ETF is a nice tightening range; if down into 22s, bulls look for favorable risk-to-reward within balance playbook.
- Creator says 12 EMA is a good health guide probably 89% of the time, then corrects to 84% of the time.
- Rotation is described as the top thing to watch; XLF bounce could partially offset NASDAQ and semiconductor consolidation; S&P 500 may not be best trading but needs to stay healthy. -
Technical Levels & Setups OR Macro Drivers (📌):
- Daily consolidation after straight-line equity moves, with EMA holds defining healthy consolidation and 4-hour trend changes shaping daily higher lows.
- Capital rotation: semis/memory consolidation could be offset by XLF bounce and IGV new highs, allowing S&P 500 to float near highs.
- Follow-the-leader setup: INTC, TSM and others set monthly higher lows before SMH, SNDK, MU, and NASDAQ followed.
- Ratio-chart warning: XLF SPY bearish range break preceded XLF waterfall; XLV SPY watched for similar monthly lower high and support at 2162.
- Tightening-range breakouts: Microsoft, MRNA, NBIS, NCLD cited for volume/volatility expansion and balance-direction decisions.
- NQE ratio monthly higher low is a tech tailwind, but potential monthly lower high could bring relative weakness back into tech.
- Metals struggling to shape healthy weekly higher lows. -
Risk/Reward Framework (⚖️):
- Entry: Not established by the available evidence.
- Stop: Not established by the available evidence.
- Targets: Not established by the available evidence.
- Risk/Reward: Not established by the available evidence.
- Position Size: Not established by the available evidence.
- Probability: Not established by the available evidence. -
Scenario Analysis (🔄):
| Scenario | Probability | Target | Trigger |
|---|---|---|---|
| Bull | Not established by the available evidence. | Not established by the available evidence. | S&P 500 and NASDAQ hold daily EMAs/12 EMA, 4-hour uptrend creates daily higher low, SMH/MAGS/INTC/AMD/Dell hold 12 EMA, XLF bounces, and IGV breaks to new highs to negate head-and-shoulders. |
| Base | Not established by the available evidence. | Not established by the available evidence. | If EMAs are lost but there is no steadily increasing bear volume to new lows, S&P 500 and NASDAQ stay sideways; IGV forms two-day EQ; semis/memory daily consolidation is offset by XLF bounce. |
| Bear | Not established by the available evidence. | Not established by the available evidence. | Lose EMAs with increasing bear volume to new lows; clear 4-hour downtrend; break low of yesterday/today; XLF SPY ratio breaks down; MSFT bear break; AMZN stays below 25949 resistance; NQE monthly lower high creates relative tech weakness; XLV confirms weekly downtrend. | -
Risk Factors (⚠️):
- Creator's bullish EMA/rotation thesis is invalidated if key daily 12 EMA/EMAs are lost across S&P 500, NASDAQ, SMH, MAGS, INTC, Dell, MRNA, or NBDA.
- Rate-hike odds and the 10-year yield move are not independently verified; the FOMC date is only described as next month.
- Twitter 'generational top' is framed as sentiment, not valuation or fundamental evidence.
- XLF bounce/rotation may fail; XLF closed out near low of day.
- XLV SPY support at 2162 is the only ratio level cited; a break would weaken the rotation cushion.
- IGV head-and-shoulders and MSFT bear break risk could bring IGV monthly consolidation.
- NQE ratio monthly lower high could bring relative weakness into tech.
- MRNA/MSFT breakout volume assumptions are not verified beyond faint volume bars.
- Metals weekly higher lows continue to fail.
- S&P 500 may not be the best trading vehicle; broad market health depends on rotation. -
Actionable Trading/Allocation Plan (🎯):
- Track the 10-year yield and next-month FOMC rate-hike odds; verify against market-implied probabilities.
- Monitor S&P 500 and NASDAQ daily 12 EMA/EMA holds plus 4-hour trend changes for daily higher-low confirmation.
- Monitor NQE ratio for monthly higher low versus monthly lower high and relative tech strength/weakness.
- Watch SMH, MAGS, INTC, AMD, Dell, SNDK, and MU for 12 EMA/stair-step support and post-breakout follow-through.
- Monitor IGV two-day head-and-shoulders/EQ and MSFT tight-range break direction with volume expansion.
- Track XLF hourly 12 EMA resistance, daily bounce, and XLF SPY ratio monthly lower high; compare with XLV SPY support at 2162.
- Watch AMZN 25949 as bear-control resistance and NBDA 50% retrace; NBIS 212s and NCLD 22s as balance low-end reference.
- Check individual levels: INTC 11137 gap fill, MRNA breakout volume, HACK weekly 12 EMA, Google balance extremes, and Tesla weekly pseudo stair-step.

-
Creator Horizon Category (⏱️): Long-Horizon Macro / Structural — The transcript centers on Bending Spoons' multi-year acquisition and operating model rather than short-term technical levels or a single dated macro trade.
-
One-Line Thesis (💡): In the transcript, host and guest Luca Ferrari claim Bending Spoons grew from a $40,000 start in 2013 and a $10,000 first acquisition into a public company host describes as roughly a $40B market cap, using reinvested free cash flow, debt, and a 50+ proprietary technology operating system to acquire and transform Eventbrite, Vimeo, Airtable, Bright, and other tech businesses.
-
Key Data Points (📊):
- Transcript claim - Bending Spoons went from zero to $1 billion in revenue in just 10 years.
- Transcript claim - 'Half a billion people use our products.'
- Transcript claim - 'We have never lost a bid before.'
- Transcript claim - Milan-based Bending Spoons announced it will buy ticketing platform Eventbrite.
- Transcript claim - 'AOL has a new parent again' (the parent is not explicitly identified in that sentence in the evidence).
- Guest Luca Ferrari claim - previous AI company launched in 2010, crashed and burned 3 years later, leaving about $40,000 in VC capital.
- Guest Luca Ferrari claim - VC sold its shares to founders for $1 nominal value.
- Guest Luca Ferrari claim - Bending Spoons started in 2013 with $40,000.
- Guest Luca Ferrari claim - first acquisition paid $10,000 give or take, an iPhone keyboard-personalization app with negligible revenue and users.
- Guest Luca Ferrari claim - core team is about 800 people; roughly three quarters are engineers, AI researchers, product designers, or product managers.
- Guest Luca Ferrari claim - Bending Spoons built an operating system of 50+ proprietary technologies.
- Guest Luca Ferrari claim - debt use started in 2017 or 2018 with basic bank loans/TLAs, later TLB, and possible future bond issuances.
- Guest Luca Ferrari claim - Bending Spoons has redeployed pretty much 100% of free cash flow toward acquisitions since the beginning.
- Host claim - Bending Spoons has '40 odd billion dollar market capish right now'; guest says he has not checked the ticker.
- Guest Luca Ferrari claim - unlevered historical returns have been consistently above 25%.
- Guest Luca Ferrari claim - higher rates would make new debt more expensive but would likely be net positive under most scenarios because asset valuations fall for a serial acquirer.
- Guest Luca Ferrari claim - almost all acquisition processes had other buyers; competition may intensify or weaken, and private equity historically is down/softer and raised less capital.
- Guest Luca Ferrari claim - acquired businesses have often been around 10, 20, or more than 20 years old, and founders often want to move on after a sale.
- Tickers - Not established by the available evidence. -
Technical Levels & Setups OR Macro Drivers (📌):
- Guest claim - buy product-market fit: Bending Spoons is not best at finding PMF but is good at engineering, design, monetization, and marketing, so it buys assets from sellers.
- Guest claim - operating-system swap: acquired businesses get their technological foundation replaced by Bending Spoons' 50+ proprietary technologies.
- Guest claim - lean teams: very small, high-talent-density teams with high ownership are used to run businesses at a 10 out of 10 level.
- Guest claim - free cash flow and debt: since 2017/2018, debt plus roughly 100% FCF redeployment funds acquisitions.
- Guest claim - public currency: as a public company, using equity tactically here and there could be a good idea.
- Guest claim - competition setup: other buyers appeared in almost all processes; PE capital supply may be softer.
- Guest claim - founder-role setup: Bending Spoons does not rely on founders staying, as sellers often want to move on.
- Analyst interpretation - the transcript presents Bending Spoons as a serial acquirer using operational integration, centralized tooling, and debt as structural growth levers. -
Risk/Reward Framework (⚖️):
- Entry: Not established by the available evidence.
- Stop: Not established by the available evidence.
- Targets: Not established by the available evidence.
- Risk/Reward: Not established by the available evidence.
- Position Size: Not established by the available evidence.
- Probability: Not established by the available evidence. -
Scenario Analysis (🔄):
| Scenario | Probability | Target | Trigger |
|---|---|---|---|
| Bull | Not established by the available evidence. | Not established by the available evidence. | Verify the trigger against the source evidence. |
| Base | Not established by the available evidence. | Not established by the available evidence. | If Bending Spoons continues reinvesting about 100% of free cash flow and integrating its 50+ technology stack into Eventbrite, Vimeo, Airtable, and Bright-type assets while facing some competing buyers. |
| Bear | Not established by the available evidence. | Not established by the available evidence. | If new debt costs rise substantially above about 9% without offsetting lower asset valuations, or if competition intensifies and integration/transformation fails to scale, the model could be pressured. | -
Risk Factors (⚠️):
- Integration scale risk: guest states transformation takes operational effort and says it 'doesn't really scale li' (cut off), implying limits to the number of deals.
- Competition risk: almost all processes had other buyers, and competition may intensify.
- Founder/authority risk: guest says founders often move on after a sale and Bending Spoons does not assume founder authority in acquired brands.
- Public-market/equity risk: guest says equity could be used tactically, but no specific issuance plan is disclosed.
- Verification risk: market cap, valuation, revenue, user count, and 'never lost a bid' are claims without independent financials in the evidence; ticker is not stated.
- Deal risk: Eventbrite acquisition is announced, but terms, financing, and regulatory approvals are not established by the available evidence. -
Actionable Trading/Allocation Plan (🎯):
- Verify Eventbrite acquisition status, terms, financing, and regulatory approvals.
- Track acquired brands Eventbrite, Vimeo, Airtable, and Bright for product, monetization, and workforce changes.
- Monitor new debt issuances and pricing versus the claimed about 9% blended cost and the interest-rate environment.
- Monitor M&A auction competition and private-equity capital availability.

-
Creator Horizon Category (⏱️): Long-Horizon Macro / Structural — The creator discusses multi-year AI adoption and labor-market claims including radiology, coding, entry jobs, white-collar jobs, and model releases rather than near-term price levels.
-
One-Line Thesis (💡): The creator claims that major AI predictions — 5-year radiology takeover, 90% AI-generated code in 6–12 months, 50% entry-job wipeout, half of white-collar jobs gone next year, and GPT2/Llama 3 safety-release warnings — have proven wrong, and calls for accountability because such predictions conflict with America winning the AI race, while also calling a 10% extinction prediction made up and irresponsible.
-
Key Data Points (📊):
- 10% of extinction is made up and it shouldn't be done; it's irresponsible — creator characterizes an AI extinction probability claim as fabricated and irresponsible
- In 5 years time radiology will be completely taken over by artificial intelligence and there'll be no radiologists — cited prediction; creator says it proved exactly the opposite
- We need more radiologists than ever in the world — creator claim on radiology labor demand
- AI has taken over radiology completely which is great; automated scan reading — creator claim on AI radiology automation
- 50% of entry jobs will be wiped out — cited prediction; creator says it has proven wrong
- GPT2 would be too unsafe to release — cited prediction; creator lists it among wrong predictions
- Llama 3 would be too unsafe to release — cited prediction; creator lists it among wrong predictions
- Half of white collar jobs would be gone next year — cited prediction; creator labels it part of the jobs apocalypse
- All of these predictions have been wrong — creator summary claim
- We have to take accountability and take account for all of the stupid predictions that were made — creator call to track wrong AI predictions
- Those predictions are inconsistent with ultimately America winning the AI race — creator macro framing -
Technical Levels & Setups OR Macro Drivers (📌):
- AI automated scan reading in radiology coexisting with rising radiologist demand, per creator
- AI code-generation adoption falling short of the cited 90% within 6–12 months prediction, per creator
- Entry-level and white-collar job-apocalypse predictions not materializing, per creator
- Safety-release warnings around GPT2 and Llama 3 cited as examples of overblown AI risk, per creator
- Accountability tracking of public AI predictions as a recurring theme, per creator
- America winning the AI race used as a framing against pessimistic AI predictions, per creator -
Risk/Reward Framework (⚖️):
- Entry: Not established by the available evidence.
- Stop: Not established by the available evidence.
- Targets: Not established by the available evidence.
- Risk/Reward: Not established by the available evidence.
- Position Size: Not established by the available evidence.
- Probability: Not established by the available evidence. -
Scenario Analysis (🔄):
| Scenario | Probability | Target | Trigger |
|---|---|---|---|
| Bull | Not established by the available evidence. | Not established by the available evidence. | AI automation in radiology expands via automated scan reading while more radiologists are still needed, and cited job-wipeout and safety-release predictions remain falsified. |
| Base | Not established by the available evidence. | Not established by the available evidence. | Some AI task automation advances, but the specific cited predictions — no radiologists, 90% AI code in 6–12 months, 50% entry jobs wiped out, half of white-collar jobs gone next year — do not materialize as stated. |
| Bear | Not established by the available evidence. | Not established by the available evidence. | Verification shows one or more cited predictions were accurately made and later validated rather than falsified, or safety/extinction risks are substantiated. | -
Risk Factors (⚠️):
- No primary data, sources, or model names beyond GPT2/Llama 3 are provided for the claim that predictions were wrong.
- Time references are vague — last year, 6 to 12 months, next year — so prediction-vs-outcome timing cannot be verified from EVIDENCE alone.
- No financial tickers, valuations, price levels, or portfolio instruments are mentioned, so market implications are not established.
- The 10% extinction claim is characterized as made up without supporting evidence or methodology.
- Radiology, code-generation, and labor-market claims require external workforce/adoption data not present in EVIDENCE.
- America winning the AI race is undefined and unquantified. -
Actionable Trading/Allocation Plan (🎯):
- Track the original public predictions and subsequent outcomes for radiology staffing, AI code generation share, entry-level jobs, white-collar jobs, GPT2 release, and Llama 3 release.
- Monitor radiology workforce statistics alongside AI scan-reading adoption to test the creator's claim that both more radiologists and complete AI radiology automation coexist.
- Monitor AI code-generation usage or share metrics against the cited 90% in 6–12 months prediction.
- Monitor entry-level and white-collar employment data against the cited 50% and half-of-jobs predictions.
- Monitor safety-evaluation and release timelines for GPT2/Llama 3-class models to assess the creator's claim that safety-release warnings were wrong.
- If assessing the 10% extinction-risk claim, verify the originating survey/model and methodology rather than relying on the podcast characterization.
- Define and track any America winning the AI race metric if that frame is used for macro conclusions.
-
Creator Horizon Category (⏱️): Long-Horizon Macro — Evidence centers on multi-decade inflation history, a 15-year public-vs-private return comparison, and 30-year mortgage/rate decisions rather than short-term technicals.
-
One-Line Thesis (💡): The Compound's Ben Carlson argues public index investors are not missing the innovation economy because the NASDAQ 100 returned almost 1500% total and 20% per year over 15 years without private unicorns, while also claiming paying off a sub-3% mortgage is never a good idea when inflation is 3 and a half% and high-quality government bonds yield 5%.
-
Key Data Points (📊):
- 1800 to 1940: US consumer prices rose just 28% total; 0.2% annual inflation over 140 years - Ben Carlson inflation-history claim.
- Since 1940: prices up more than 2,000% total; 3.7% per year - Ben Carlson claim.
- Late 19th century: prices fell 40% - Ben Carlson claim on pre-WWII deflation.
- NASDAQ 100 past 15 years: almost 1500% total return; 20% per year - Ben Carlson claim; says it did not include SpaceX, Anthropic, OpenAI, or unicorn startups.
- Ben Carlson: NASDAQ 100 15-year returns probably better than 90 to 95% of all VC funds in same timeframe.
- Nick Majoui mentioned by co-host: average startup employee nets $20,000 off shares - host claim about Majoui's writing, not fully read in evidence.
- Private AI crowd-investing anecdote from co-host: investment 4x or 5xed before public shares accessible; then went from $20 per share to about a dollar a share; now at a loss holding a penny stock.
- Graham Stephan paid off a 2.875% mortgage and said Dave Ramsey was right - question/creator reference.
- Ben Carlson: sub-3% mortgage versus 5% high-quality government bonds and 3 and a half% inflation; 6% debt is a different conversation; 3% debt is never a good idea.
- Ben Carlson: if mortgage rates go back to 3%, he would back the truck up; calls a 30-year mortgage one of the greatest inflation hedges ever invented.
- Co-host student loan anecdote: 2004, 2005 loan was about two and a half%; average is about 6.5%.
- College senior question: wants to become a sell-side equity research analyst and asks whether AI will disrupt the role; answer is truncated/not established in evidence. -
Technical Levels & Setups OR Macro Drivers (📌):
- Private-market FOMO narrative: companies staying private longer has supposedly hurt public market returns, but Ben Carlson claims NASDAQ 100 returns show missed private unicorns have not mattered to indexed public investors.
- Public-index liquidity and simplicity: Ben Carlson cites low-cost index funds in the Qs as liquid, with no moody startup founders, dilution, or exit-timing worries.
- VC power-law setup: Ben Carlson says VC only needs one or two winners while many startups fail; BLS survival figures are cited to frame private-startup risk.
- Low-rate mortgage arbitrage setup: sub-3% mortgage debt versus 5% high-quality government bonds and 3 and a half% inflation; 30-year fixed mortgage framed as inflation hedge.
- Behavioral psychology debate: paying off a mortgage may feel good, but Ben Carlson calls it suboptimal for sub-3% debt and says 6% debt is different.
- AI disruption of sell-side equity research: question raised by a college senior; creator response is not available in the truncated evidence. -
Risk/Reward Framework (⚖️):
- Entry: Not established by the available evidence.
- Stop: Not established by the available evidence.
- Targets: Not established by the available evidence.
- Risk/Reward: Not established by the available evidence.
- Position Size: Not established by the available evidence.
- Probability: Not established by the available evidence. -
Scenario Analysis (🔄):
| Scenario | Probability | Target | Trigger |
|---|---|---|---|
| Bull | Not established by the available evidence. | Not established by the available evidence. | Ben Carlson's claim that the NASDAQ 100 returned almost 1500% total and 20% per year over 15 years without private unicorns continues to validate public index exposure. |
| Base | Not established by the available evidence. | Not established by the available evidence. | Low-cost public index funds remain liquid and capture innovation-driven value creation; private-market markups do not materially affect public returns per creator claim. |
| Bear | Not established by the available evidence. | Not established by the available evidence. | Hosts warn that by the time private exposure gets to an ETF it is probably too late if companies stay private longer and retail private-holding vehicles arrive after value is captured. | -
Risk Factors (⚠️):
- No evidence-bound entry, stop, target, ratio, position size, or probability is provided for any market thesis.
- Ben Carlson's claim that NASDAQ 100 returns probably beat 90 to 95% of VC funds is stated as a guess, not sourced in the evidence.
- The startup employee $20,000 average is attributed to Nick Majoui but the transcript says the host had not read the whole piece, so it is unverified.
- The NASDAQ 100 return chart and comparison to private markets/VC funds are not independently verified in the evidence.
- Mortgage-payoff debate is framed through Ben Carlson's strong opinion; evidence does not include Graham Stephan's full post or a full counter-scenario.
- Individual liquidity needs and behavioral psychology may differ from the creator's stated framework for sub-3% mortgage debt.
- AI disruption risk for sell-side equity research is raised but the creator's answer is truncated and not established by the available evidence. -
Actionable Trading/Allocation Plan (🎯):
- Verify Ben Carlson's 1800 to 1940 and post-1940 US inflation figures against historical CPI data.
- Verify the NASDAQ 100 15-year total return near 1500%/20% annually and confirm whether SpaceX, Anthropic, OpenAI, and unicorn startups were excluded.
- Compare NASDAQ 100 returns with actual VC fund index returns for the same period; treat the 90 to 95% VC comparison as an unverified creator guess.
- Check BLS business survival rates cited: 20% one-year, almost 50% five-year, and two-thirds ten-year failure rates.
- Review Graham Stephan's 2.875% mortgage-payoff post and Dave Ramsey argument against the creator's cited 5% government bond yield and 3 and a half% inflation reference levels.
- Monitor 30-year mortgage rates near 3% and high-quality government bond yields near 5% as the creator's stated reference levels for the mortgage-payoff debate.
- Review private-holding ETF structures, including the Robin Hood private-holdings launch mentioned by hosts, for timing, liquidity, and valuation risks.
- Await a full answer to the sell-side equity research/AI disruption question because the evidence truncates before the response.

-
Creator Horizon Category (⏱️): Long-Horizon Macro / Structural — Guest (Andre) describes multiple simultaneous exponential changes—AI, healthcare/GLP-1, and deficits—and says investors must think long-dated and build specialized sleeves rather than compare AI and non-AI investments day to day.
-
One-Line Thesis (💡): Guest (Andre) argues the current investment landscape is the most unique, exciting, and uncertain he has seen because multiple exponential changes—AI, healthcare/GLP-1, and growing US deficits—require long-dated bets, narrow expert partnerships, and separate AI versus anti-AI sleeves.
-
Key Data Points (📊):
- Guest (Andre): High Vista started in 2004 and went through the GFC — firm history context.
- Guest (Andre): current environment is 'the most unique,' 'most exciting,' and 'most uncertain' he has ever seen — headline claim.
- Guest (Andre): AI is exponential on many fronts; it is a productivity tool helping firms get better margins, changes lives, and is enabling wars — AI impact claim.
- Guest (Andre): healthcare is changing exponentially; GLP-1 drugs are changing the outlook for health in profound ways forever — healthcare claim.
- Guest (Andre): US budget deficit is two trillion and growing and feels exponential; US debt was 5 trillion in the early 2000s and is 40 trillion now — deficit/debt figures.
- Guest (Andre): big deficit is very exciting for investing and not a problem if investing, but is a problem for the next generation — macro implication claim.
- Guest (Andre): venture investments are in the many billions, '20 billion value, 5 billion before' — high-valuation context as transcribed.
- Guest (Andre): extraordinary earnings growth and very high valuations create a challenge in deciding how to invest when fundamentals change quickly — valuation challenge.
- Guest (Andre): if AI works, 10 years from now may be a world 'we won't recognize'; even if only half or a quarter is possible, it is still profound — AI possibility claim.
- Guest (Andre): 'this time is different' are the most dangerous words in investing, but he says this time is different — risk phrasing.
- Guest (Andre): one approach is an AI sleeve on the assumption it will be very different, not all money, with the rest of money as anti-AI — portfolio construction claim.
- Guest (Andre): edge comes from partnering with experts in increasingly narrow areas; for AI, High Vista has writing/thinking on compute and works with hard-tech and other experts — edge sourcing.
- Guest (Andre): biotech examples include micro-cap/small-cap biotech stocks burning money, diluting shareholders, needing science specialization, with big money buy-and-hold and small money able to move — biotech setup.
- Guest (Andre): small company buyouts are bottom of private equity, mostly family-owned businesses, thousands available, negotiated sales rather than auctions, with families caring who they sell to — small-buyout setup.
- Guest (Andre): small PE sponsors and fundless/independent sponsors number maybe 2,000 in total around, with fund sizes of a few hundred million — PE sponsor figures.
- Guest (Andre): simple value investing was a great strategy but today is no longer interesting; value investing is now super nuanced — strategy obsolescence claim.
- Guest (Andre): clients have become super sophisticated—sovereign wealth funds, pension funds, family offices, endowments—so attractive strategies get analyzed and money flows quickly — competition claim.
- Guest (Andre): High Vista started with a multi-asset mandate in a single fund, looking around the world for best opportunities — business evolution context.
- Guest (Andre): manager exits are seldom performance-driven; more often alignment no longer fits, and size/denominator is a real issue in biotech — manager risk claim.
- Tickers: none explicitly named in EVIDENCE — no security-level ticker extraction possible. -
Technical Levels & Setups OR Macro Drivers (📌):
- Exponential change across AI, healthcare/GLP-1, and deficits creates rapid change, which the guest says makes an edge both more necessary and easier for specialized investors.
- High valuations in AI/venture force a long-dated mindset; guest says normal investment comparisons may not work and proposes separating AI and anti-AI sleeves.
- Compute is the guest's stated AI bet if AI works, pursued through hard-tech and narrowly specialized expert partnerships.
- Biotech micro/small-cap equities are framed as capital-inefficient, science-dependent, and size-constrained, creating opportunity for small specialized managers while big money is buy-and-hold.
- Small company buyouts and fundless/small sponsors are framed as a broad, negotiated, relationship-driven opportunity set where breadth across thousands of companies and sponsors is valuable.
- Sophisticated clients and competition have compressed generic strategies like simple value investing, pushing High Vista toward narrow specialization and early-career partner relationships. -
Risk/Reward Framework (⚖️):
- Entry: Not established by the available evidence.
- Stop: Not established by the available evidence.
- Targets: Not established by the available evidence.
- Risk/Reward: Not established by the available evidence.
- Position Size: Not established by the available evidence.
- Probability: Not established by the available evidence. -
Scenario Analysis (🔄):
| Scenario | Probability | Target | Trigger |
|---|---|---|---|
| Bull | Not established by the available evidence. | Not established by the available evidence. | Guest (Andre): AI turns out to be an incredible change/evolution/innovation over time, and 10 years from now is a world we won't recognize. |
| Base | Not established by the available evidence. | Not established by the available evidence. | Guest (Andre): create an AI sleeve on the assumption it will be very different while keeping the rest of money as anti-AI because AI and non-AI investments are hard to compare. |
| Bear | Not established by the available evidence. | Not established by the available evidence. | Guest (Andre): 'this time is different' are the most dangerous words in investing; AI may not work or only half/quarter may be possible, and high prices would never be owned in a normal environment. | -
Risk Factors (⚠️):
- High valuations: guest says investors recoil from high prices and that AI/venture prices are very high, so disappointment could invalidate the long-dated thesis.
- AI promise risk: guest explicitly allows that AI may not work as hoped, or only half/quarter of the profound outcome may occur.
- This-time-is-different risk: guest labels it the most dangerous phrase in investing even while asserting the current period is different.
- Biotech manager size risk: guest says size/denominator is a real issue and successful managers can become too big for the opportunity set.
- Alignment/exit risk: guest says manager exits are seldom performance-driven and more often because alignment no longer fits.
- Deficit/social risk: guest separates investing excitement from ugly societal/next-generation consequences of deficits and AI-enabled conflict.
- Competition risk: guest says sophisticated clients and firms quickly analyze attractive strategies and compete away alpha.
- Missing verification: no tickers, no specific AI/healthcare/PE holdings, no entry/exit levels, no position sizes, no valuation thresholds, and no dated targets are provided in EVIDENCE. -
Actionable Trading/Allocation Plan (🎯):
- Verify guest identity, High Vista's founding date of 2004, and the firm's disclosed strategy lineup against primary sources.
- Monitor whether High Vista or the guest publishes specific AI/compute investments or expert partners to test the 'narrow specialization' claim.
- Track the proposed AI sleeve versus anti-AI sleeve framing for any disclosed sizing, holdings, or performance attribution.
- Cross-check the stated deficit/debt figures—US deficit at two trillion and growing, debt from 5 trillion in early 2000s to 40 trillion now—against official Treasury/OMB data.
- Verify the venture valuation reference '20 billion value, 5 billion before' against the original video context or transcript source because the phrase is ambiguous as transcribed.
- Monitor GLP-1/healthcare thesis developments and any named biotech managers or positions, since the guest provides no tickers in evidence.
- Monitor small-buyout/fundless sponsor universe claims—thousands of family-owned businesses, maybe 2,000 small/fundless sponsors—against PE industry data.
- Assess any future manager exits against the guest's stated criteria: alignment, size/denominator, and continued motivation rather than performance alone.

-
Creator Horizon Category (⏱️): Long-Horizon Macro / Structural — The episode centers on AI hyperscaler interconnectedness, capex, free cash flow, agent moats, and funding structure as a long-cycle market story.
-
One-Line Thesis (💡): The creators debate whether the AI trade is an interconnected hyperscaler house of cards or a durable buildout, citing Nvidia's 16 times forward earnings, a trillion dollars in hyperscaler capex next year, and Meta's Muse agent as key signals.
-
Key Data Points (📊):
- FT tool cited: Anthropic, OpenAI, Alphabet, Amazon, Meta, Microsoft, Oracle, SpaceX, Nvidia, and CoreWeave shown as interconnected AI players.
- Creators claim combined market cap of listed AI-linked companies is roughly 20-something trillion, 22 [or] $25 trillion something like that.
- Bloomberg headline cited: AI's wobbly house of cards puts markets and US economy at risk.
- Jim Mororrow, CEO of Kaledine Capital Management, quoted: people may not fully grasp how wound up the market and economy are; many things could unravel.
- Creator claim: the AI trade is trading at 16 times forward earnings, using Nvidia as the AI trade proxy.
- Creator claim: Nvidia now has a lower forward PE than at any time this entire decade; the stock market is trading at a higher forward multiple than Nvidia.
- Bloomberg chart cited: capex of Amazon, Meta, Microsoft, and Alphabet estimated to be a trillion dollars next year overlaid with trailing 12-month free cash flow.
- Creator claim: these companies were asset-light but are becoming asset-heavy; this is a total rerating for 40% of the index.
- Torson Slock consensus cited: hyperscalers grow operating cash flow from 600 billion in 2025 to two trillion in 2030.
- Steve Ratner chart cited: projected IPOs for OpenAI, Anthropic, and SpaceX at $5.2 trillion for those three companies, not inflation adjusted, bigger than all tech IPOs from 1980 to 2025, almost 4,000 companies.
- OpenAI departee cited saying 10% chance we're all going to die; creators say this became a slowdown/crash whisper.
- Creator observation: after the slowdown narrative, the semi trade is ramping back up; the stock market has not come down until everyone discovers it is a bubble.
- Creator claim: Meta rose almost 12% yesterday on its Muse agent, showing AI news can still move a $2 trillion company.
- Muse agent anecdote cited: flight delayed seven hours, user asked Muse to file compensation, received $250 Delta credit in five minutes, flight rebooked, and support email answered.
- Instinct AI assistant anecdote cited: text warned of son's 6 p.m. tryout and reversible jersey, offered to add it to calendar.
- Ben Thompson cited: Meta's Muse launch is a bear signal for frontier labs; personal agents in inbox/accounts create moats, while LLMs are not wedded to users.
- Creator conjecture: switching costs between AI agents like Instinct and others are almost nothing; Instinct may have raised a couple hundred million dollars but could be out of business overnight.
- Railroad buildout analogy: funded by the public, public lost their shirts, fraud present; dot-com IPOs funded by individual investors.
- Creator distinction: today's AI buildout is funded by free cash flow and potentially debt from these companies, not mainly the public holding the bag.
- Fed cited as possible bubble-pricker: if the Fed keeps raising rates; every bubble in history, including Japan, was finally hit by rates. -
Technical Levels & Setups OR Macro Drivers (📌):
- AI flywheel: hyperscalers, model labs, and chip suppliers are interconnected through investment, loans, co-investment, earnings, and free cash flow.
- Hyperscaler capex surge: Amazon, Meta, Microsoft, and Alphabet estimated at a trillion dollars next year, pressuring free cash flow and shifting asset-light businesses asset-heavy.
- Nvidia valuation setup: 16 times forward earnings and lower forward PE than any time this decade, while the broader market trades at a higher forward multiple.
- Agent product adoption: Meta Muse and Instinct examples show AI agents handling purchases, calendar, email, and travel tasks; creators debate adoption versus privacy resistance.
- Frontier lab moat risk: Ben Thompson cited as saying personal agents create switching costs, making Muse bearish for OpenAI and Anthropic unless they build moat-like products.
- Commoditization setup: if technology works but becomes commoditized, the economy may win while hyperscalers get lower ROI; Mag Seven may underperform the rest of the market.
- Funding structure difference: today's AI capex is funded by company free cash flow and potential debt, unlike railroad and dot-com buildouts funded by public investors.
- Fed tightening risk: raising rates is cited as the historical mechanism that pricks bubbles and could pressure the AI trade. -
Risk/Reward Framework (⚖️):
- Entry: Not established by the available evidence.
- Stop: Not established by the available evidence.
- Targets: Not established by the available evidence.
- Risk/Reward: Not established by the available evidence.
- Position Size: Not established by the available evidence.
- Probability: Not established by the available evidence. -
Scenario Analysis (🔄):
| Scenario | Probability | Target | Trigger |
|---|---|---|---|
| Bull | Not established by the available evidence. | Not established by the available evidence. | Creators cite scenario one: a trillion dollars in revenue, huge ROI, and the bull market is justified. |
| Base | Not established by the available evidence. | Not established by the available evidence. | Creators cite scenario two: technology works but is commoditized; the economy wins but hyperscalers do not get as big an ROI because it becomes a commodity immediately. |
| Bear | Not established by the available evidence. | Not established by the available evidence. | Creators cite scenario three: growth falls short and things get written down; also the house-of-cards flywheel slows or reverses. | -
Risk Factors (⚠️):
- Interconnectedness/house-of-cards unwind: creators say if the AI flywheel slows or reverses, it could be very bad, though they note the biggest companies may be strong enough to push through.
- Hyperscaler free cash flow risk: a trillion dollars capex next year versus trailing 12-month free cash flow; asset-light to asset-heavy rerating for 40% of the index.
- AI commoditization risk: technology works but ROI is weak, economy wins, and hyperscalers underperform.
- Frontier lab moat risk: Ben Thompson cited as bearish for OpenAI and Anthropic if personal agents own the user relationship and switching costs are low.
- Agent adoption/privacy risk: some users resist letting AI into inbox, calendar, purchases, and accounts; creators note likely generational adoption resistance.
- Fed rate-hike risk: creators say raising rates is the usual bubble-pricker and could finally pressure the AI trade.
- Verification risk: transcript references FT tool, Bloomberg article, Steve Ratner chart, Torson Slock consensus, and Ben Thompson piece without direct links or tables in the evidence. -
Actionable Trading/Allocation Plan (🎯):
- Verify the FT hyperscaler interconnectedness tool and the list of companies: Anthropic, OpenAI, Alphabet, Amazon, Meta, Microsoft, Oracle, SpaceX, Nvidia, and CoreWeave.
- Verify the Bloomberg article headline and Jim Mororrow/Kaledine Capital Management quote on AI's house of cards.
- Track Amazon, Meta, Microsoft, and Alphabet capex versus trailing 12-month free cash flow; confirm or refute the next-year estimate of a trillion dollars.
- Monitor Nvidia's forward PE versus its own decade range and versus the stock market's forward multiple; verify the 16 times claim.
- Track the Torson Slock consensus for hyperscaler operating cash flow growing from 600 billion in 2025 to two trillion in 2030.
- Monitor the Steve Ratner chart on projected IPOs for OpenAI, Anthropic, and SpaceX at $5.2 trillion combined versus all tech IPOs from 1980 to 2025.
- Track Meta's stock reaction and Muse agent adoption after the cited almost 12% move; verify $2 trillion market cap context.
- Monitor AI agent switching costs and frontier lab moat commentary from Ben Thompson regarding OpenAI and Anthropic.
- Track Fed rate path as the cited historical bubble-pricker risk for the AI trade.
- Monitor the three AI ROI scenarios: a trillion dollars revenue/huge ROI, commoditized technology, and growth shortfall/write-downs.

-
Creator Horizon Category (⏱️): Long-Horizon Macro / Structural — Evidence centers on California governance, taxes, regulation, energy, housing, and business climate over 16 years, with a seven-week election catalyst.
-
One-Line Thesis (💡): Steve Hilton claims California's 16 years of one-party Democratic rule produced worst-in-nation poverty, unemployment, cost of living, housing, and business climate, and proposes tax cuts, deregulation, energy-policy reversal, and DMV abolition to reverse business and resident exodus.
-
Key Data Points (📊):
- Steve Hilton: Republican and British candidate for California governor; former Silicon Valley tech entrepreneur; moved to US in 2012.
- California one-party rule: 16 years; all eight statewide elected positions, legislature two-thirds Democratic majority, every big county and city, state supreme court 6-1 Democrat-appointed majority.
- Hilton claim: California has highest poverty rate, highest unemployment rate, highest cost of living, and highest housing cost in the country.
- Chief Executive Magazine ranked California 50th out of 50 for business climate for more than a decade, per Hilton.
- Sacramento legislature passed 1,118 bills last year; Hilton says printed stack was twice his height.
- Hilton plan: cut California regulations from over 420,000 to under 200,000 by end of first term.
- Hilton plan: cancel high-speed rail; 10% government headcount reduction; 5% efficiency.
- Hilton claim: gas prices at $6; target towards $3 like other states; hidden taxes low carbon fuel standard and cap-and-invest about $150 on gas price; cap-and-invest funds high-speed rail.
- Hilton claim: median California house price nearly $1 million; median individual salary $65,000.
- Hilton internal poll: 33% solidly with Hilton, 41% solidly with Basera, 26% up for grabs; most of 26% voted Democrat before but are persuadable.
- Host-stated: Poly market has Hilton at 5% chance of winning; actual polls have him as close as 8% to 20%; 90%/89% of Republican voters, 30% of independents, less than 10% of Democrats.
- Hilton claim: visited all 58 California counties; hundreds of events and town halls.
- Hilton claim: 90% chance a business in California ends up in litigation.
- Hilton claim: business leaders say if he doesn't make it in November, 'we're out'; exodus could become a stampede.
- Hilton claim: number one thing people say is 'You have to win'; seven weeks to save the state. -
Technical Levels & Setups OR Macro Drivers (📌):
- One-party Democratic control in California for 16 years as root cause of policy outcomes.
- Regulatory bloat and legislative volume: 1,118 bills last year; over 420,000 regulations.
- High taxes and cost of living: highest poverty, unemployment, housing, and cost of living claims.
- Energy policy: hidden gas taxes, low carbon fuel standard, cap-and-invest, high-speed rail funding.
- Business climate: 50th out of 50 ranking, litigation risk, donor/union/trial-lawyer influence.
- Exodus setup: residents and businesses leaving; post-November business exit threat.
- Campaign proposals: first $150k state income tax-free, regulation cut to under 200k, DMV abolition and $73 vehicle registration, high-speed rail cancellation. -
Risk/Reward Framework (⚖️):
- Entry: Not established by the available evidence.
- Stop: Not established by the available evidence.
- Targets: Not established by the available evidence.
- Risk/Reward: Not established by the available evidence.
- Position Size: Not established by the available evidence.
- Probability: Not established by the available evidence. -
Scenario Analysis (🔄):
| Scenario | Probability | Target | Trigger |
|---|---|---|---|
| Bull | Not established by the available evidence. | Not established by the available evidence. | Verify the trigger against the source evidence. |
| Base | Not established by the available evidence. | Not established by the available evidence. | Verify the trigger against the source evidence. |
| Bear | Not established by the available evidence. | Not established by the available evidence. | Hilton says if he does not make it in November, business leaders say 'we're out' and exodus of business could turn into a stampede for the exits. | -
Risk Factors (⚠️):
- Election outcome uncertain; polling and Poly market figures are not electoral results.
- Policy proposals not enacted; no legislative path established in evidence.
- Claims about poverty, unemployment, business climate, litigation risk, regulation counts, and migration are creator-stated and not independently verified in evidence.
- No financial-market tickers, valuations, entry, stop, target, or position sizing provided.
- Transcript spelling varies for opponent name (Bisera/Bera/Basera) and final sentence is incomplete.
- Seven-week timeline and poll figures are time-sensitive and may change.
- Business exodus claim is anecdotal and attributed by Hilton to business leaders. -
Actionable Trading/Allocation Plan (🎯):
- Track Hilton policy proposals: first $150k state income tax-free, regulation cut to under 200k, DMV abolition, $73 vehicle registration cap, high-speed rail cancellation.
- Monitor California budget, regulation count, business climate rankings, migration data, gas prices, and vehicle registration fees.
- Check primary and general election poll aggregates for Republican, Democrat, and independent splits.
- Watch for official debate date, participants, and post-debate polls.
- Note that evidence contains no trade or portfolio implication.

-
Creator Horizon Category (⏱️): Other — The evidence supports this horizon classification.
-
One-Line Thesis (💡): Stock Market Live frames the session around a new AI consumer-demand narrative sparked by Muse, continued Wall Street chip buying, and a same-day after-hours META Connect event, with live trading across Etrade Pro/ThinkOrSwim/Fidelity and no disclosed trade parameters.
-
Key Data Points (📊):
- Title claim: 'THE NEW AI NARRATIVE & META CONNECT - SEP 23 - Stock Market LIVE, Live Trading, Stock News'
- Description claim: 'Traders get ready for the META connect event after hours'
- Description claim: 'wall street continues to buy chips on the new AI consumer demand trend sparked by Muse'
- Ticker/keyword: META is the only clear ticker referenced via the Meta Connect event; no price level, valuation, or trade parameter is given.
- Keyword: AI consumer demand trend; 'Muse' is named as the spark, but its identity as a product, company, or ticker is not established by evidence.
- Keyword: chips; no specific chip or semiconductor ticker is named in evidence.
- Macro keyword: #fomc appears in hashtags; no FOMC claim, date, rate path, or level is provided.
- Platforms: Etrade Pro (screen shown), ThinkOrSwim (long term investing), Fidelity (long Term)
- Creator disclaimer: educational purposes only; do not copy the trades; options trading is risky and can lose most or all initial investment.
- Creator promotion: Stream Alerts and Stock & options Bootcamp at JoshAnswers.com; Nightly Watchlist/main channel tutorial link.
- No entry, stop, target, ratio, position size, probability, valuation, or price level is stated in EVIDENCE. -
Technical Levels & Setups OR Macro Drivers (📌):
- After-hours META Connect event cited as a near-term catalyst.
- Wall Street chip buying tied to the new AI consumer-demand trend.
- 'Muse' referenced as the spark for the AI consumer-demand narrative.
- Live trading context on Etrade Pro, with ThinkOrSwim and Fidelity noted for long-term investing.
- FOMC hashtag appears only as a macro keyword, without supporting policy detail.
- Educational and no-copy-trade disclaimer framing around the live stream. -
Risk/Reward Framework (⚖️):
- Entry: Not established by the available evidence.
- Stop: Not established by the available evidence.
- Targets: Not established by the available evidence.
- Risk/Reward: Not established by the available evidence.
- Position Size: Not established by the available evidence.
- Probability: Not established by the available evidence. -
Scenario Analysis (🔄):
| Scenario | Probability | Target | Trigger |
|---|---|---|---|
| Bull | Not established by the available evidence. | Not established by the available evidence. | META Connect event after hours reinforces the new AI consumer-demand narrative and the described Wall Street chip buying continues. |
| Base | Not established by the available evidence. | Not established by the available evidence. | META Connect occurs after hours and market discussion remains focused on the AI/chip narrative without disclosed levels or outcome. |
| Bear | Not established by the available evidence. | Not established by the available evidence. | META Connect event fails to sustain the new AI consumer-demand narrative or the described Wall Street chip buying reverses. | -
Risk Factors (⚠️):
- Metadata-only evidence: no transcript, chart, or on-screen levels are available, so all theses are unverified.
- No chip tickers are provided, and 'Muse' is undefined in the evidence.
- META Connect outcome and after-hours market reaction are unknown.
- Event-driven volatility risk around the META Connect event.
- Creator explicitly states options trading is risky and copying trades can lose most or all initial investment.
- FOMC appears only as a hashtag without actual macro catalyst detail.
- No entry, stop, target, position sizing, probability, or risk-reward parameters are disclosed.
- Bootcamp and watchlist links are promotional and not independently substantiated by EVIDENCE.
- Long-term platform mentions do not imply a disclosed long-term portfolio position or allocation. -
Actionable Trading/Allocation Plan (🎯):
- Review the full video or transcript for whether the creator names specific chip or AI tickers beyond META and Muse.
- Verify META Connect event timing and outcome after hours against the creator's AI consumer-demand narrative.
- Identify what 'Muse' refers to and whether it is a product, company, or ticker; if absent, mark unverified.
- Monitor named semiconductor or chip stocks for sustained buying consistent with the description's 'wall street continues to buy chips' claim.
- Check for any FOMC-related macro commentary, since metadata only contains the hashtag.
- Extract any entry, stop, target, ratio, or position size if they appear in the live stream; metadata has none.
- Treat all trade-related content as educational under the creator's disclaimer and verify independently before acting.
-
Creator Horizon Category (⏱️): Short-Term Technical — The creator compares current year-to-date index performance and breadth divergence against 1998 and 1999 analogs.
-
One-Line Thesis (💡): The Compound segment claims current market breadth is not a bearish-divergence wipeout: S&P 500 up 14% YTD with only 4% of the stock market down 30%+ YTD, versus 1998 when the S&P 500 was up 29% and 10% were down 30%+ and 1999 when the market was up 21% and 14% were down 30%+; it also flags Sentinel 1 as the creator's least-favorite cybersecurity stock because it took Sears's old ticker symbol.
-
Key Data Points (📊):
- S&P 500 up 14% year-to-date — creator's stated current market return.
- 4% of the stock market down 30% or more year-to-date — creator cites Chart Kid for this breadth figure.
- 1998: S&P 500 up 29% and 10% of the index down 30% or more — creator's historical bearish-divergence comparison.
- 1999: market up 21% and 14% of the market down 30% or more — creator's historical bearish-divergence comparison.
- Creator says current 4% versus 14% is a different planet and not remotely what happened in 1998/1999.
- Creator says the 14% of stocks making lows in 1999 were literally retailers and retailers were a very big part of the S&P 500 then.
- Sears was a Dow stock blue chip — creator cites it as an example of old retail S&P 500 composition.
- Sears ticker was S and then became SHLD when it became Sears Holding — creator's ticker-history claim.
- Sentinel 1 — creator calls it his least favorite cybersecurity stock and says he wrote it up for CNBC this week with Sean.
- Sentinel 1 — creator says he refuses to get involved even though it is breaking out, because it took Sears's old ticker symbol.
- Creator says ticker symbols are magic, like ancient runes or hieroglyphs, and that karma is attached to tickers. -
Technical Levels & Setups OR Macro Drivers (📌):
- Breadth divergence setup: compare percentage of market down 30%+ YTD against index YTD return; creator says today is 4% versus S&P up 14%.
- Historical analog setup: 1998 and 1999 had materially higher percentages down 30%+ while the market ripped, which creator calls a bearish divergence wipeout.
- Sector composition driver: creator says 1999's down stocks were retailers and that retailers were a much larger S&P 500 weight then.
- Ticker-symbol setup: creator avoids Sentinel 1 despite a breakout because it took Sears's old ticker symbol; creator frames this as bad judgment and a bad omen. -
Risk/Reward Framework (⚖️):
- Entry: Not established by the available evidence.
- Stop: Not established by the available evidence.
- Targets: Not established by the available evidence.
- Risk/Reward: Not established by the available evidence.
- Position Size: Not established by the available evidence.
- Probability: Not established by the available evidence. -
Scenario Analysis (🔄):
| Scenario | Probability | Target | Trigger |
|---|---|---|---|
| Bull | Not established by the available evidence. | Not established by the available evidence. | S&P 500 remains up 14% YTD while only 4% of the stock market is down 30%+ YTD, which creator says is not remotely like 1998/1999. |
| Base | Not established by the available evidence. | Not established by the available evidence. | Current breadth condition persists: S&P up 14% YTD and 4% of the market down 30%+ YTD; creator calls this a different planet from the 14% figure in 1999. |
| Bear | Not established by the available evidence. | Not established by the available evidence. | Percentage of market down 30%+ YTD rises toward 10% as in 1998 or 14% as in 1999 while the S&P remains up, matching the creator's described bearish-divergence wipeout analog. | -
Risk Factors (⚠️):
- Breadth figures rely on Chart Kid and are not shown with methodology, universe definition, or as-of date.
- The creator uses stock market and S&P 500 interchangeably in places, making the 4% versus 10%/14% comparison definition-dependent.
- Historical 1998/1999 analogs may not predict current market outcomes.
- Sentinel 1 thesis is based on ticker-symbol superstition rather than disclosed financial or valuation analysis.
- Sentinel 1 ticker is not explicitly stated as S in the evidence; the link is only that it took Sears's old ticker symbol.
- No entry, stop, target, position size, probability, or risk/reward parameters are established for any trade. -
Actionable Trading/Allocation Plan (🎯):
- Verify S&P 500 YTD return and the percentage of stocks down 30%+ YTD with an independent breadth dataset, including universe and date.
- Verify 1998 and 1999 S&P 500 returns and the 10%/14% down-30%+ breadth figures from a historical market-breadth source.
- Check whether the 1999 down-30%+ cohort was primarily retailers and whether retailer index weight was materially larger then.
- Verify the CNBC write-up with Sean on Sentinel 1 and the exact ticker symbol associated with Sentinel 1 and Sears.
- Monitor whether the percentage of stocks down 30%+ YTD moves toward the 10% to 14% range seen in the creator's 1998/1999 analog.
- Treat the ticker-symbol argument as a qualitative creator claim, not a fundamental or valuation signal.
-
Creator Horizon Category (⏱️): Long-Horizon Macro / Structural — The Compound hosts frame Meta's Muse launch as a potentially game-changing AI assistant and an AI-agent land grab while also citing a three-week Meta rally and CPU/on-device inference chip moves.
-
One-Line Thesis (💡): The Compound hosts claim Meta's Muse launch is a potential game-changing AI assistant that drove Meta up 28% month-to-date and ignited CPU/on-device inference chip stocks, while framing a broad AI-agent land grab whose monetization durability is not yet established.
-
Key Data Points (📊):
- Claim: Meta advertised Muse on NFL games — marketing-spend signal.
- Claim: Meta stock was $578 a share to open September; now 'like $74750' — cited price move in transcript.
- Claim: $163 per share gain in three weeks — Meta stock move.
- Claim: Meta up 28% month-to-date — Meta rally.
- Claim: Meta added between $400B and $450B in market cap in three weeks — scale of value creation.
- Claim: biggest single month value creation in Meta's history — corporate milestone.
- Claim: adding $450B is like adding Costco at $430B, Procter & Gamble at $400B, J&J at $400B, Home Depot, and Netflix at $375B–$380B — valuation context.
- Claim: Meta was trading at 16 or 17 times forward earnings before the move — starting valuation.
- Claim: one analyst went from 20 to 25 times earnings in forecast — multiple expansion.
- Claim: one product is a 20% bump on the multiple of earnings people are willing to pay — valuation narrative.
- Claim: Meta and Tesla were two worst MAG7 stocks this summer; Meta now outperforming — relative performance.
- Claim: Meta had 18-month lower lows and lower highs until this move — technical setup.
- Claim: OpenAI has a personal assistant dropping in Q4 that will instantly have a billion people testing it — competitive catalyst.
- Claim: Amazon cut off Muse; Spotify partnership exists; possible Amazon deal could send stock up another 10% — partnership risk/optionality.
- Claim: Muse became number one free app on Apple iOS App Store and Google Play Store as of yesterday; available 18+ — adoption metric.
- Claim: Muse downloaded 92,000 times in first six days — adoption metric.
- Claim: Meta AI app only did 773 downloads — comparison.
- Claim: Evercore ISI/Mahaney says Meta has a hit on its hands with Muse; $200B in AI investments not in vain; user trend suggests potentially dramatic new driver of usage/engagement; substantial new monetization opportunities in advertising, subscriptions, transaction revenue share — sell-side view.
- Claim: Qualcomm went up 9% and ARM Holdings went up 17%; AMD 'went absolutely wild' — CPU-related stock moves.
- Claim: Muse uses a secure virtual machine per user; browser sessions, tool calls, sandboxing; CPUs carry AI workload; ARM and Qualcomm bet on on-device inference — chip architecture thesis.
- Claim: Meta is a '1.4 4 trillion dollar stock knocking on the door of two trillion' — market-cap context in transcript. -
Technical Levels & Setups OR Macro Drivers (📌):
- Muse launch and cross-platform distribution across WhatsApp, Instagram, and Facebook plus NFL ads as demand catalyst.
- Rapid top-free app ranking and 92,000 downloads in first six days as product-market-fit signal.
- Meta's monetization machine and analyst estimate/multiple revisions as re-rating driver.
- CPU/on-device inference architecture benefits AMD, ARM, Qualcomm; Qualcomm +9%, ARM +17%.
- AI-agent land grab among Meta Muse, OpenAI Q4 personal assistant, and Instinct; Amazon cut off Muse.
- Betting against Zuckerberg repeatedly failed in mobile, Instagram acquisition, and metaverse; consensus can be wrong.
- Technical reversal from 18-month lower lows and lower highs; Meta vs MAG7 relative strength flip. -
Risk/Reward Framework (⚖️):
- Entry: Not established by the available evidence.
- Stop: Not established by the available evidence.
- Targets: Not established by the available evidence.
- Risk/Reward: Not established by the available evidence.
- Position Size: Not established by the available evidence.
- Probability: Not established by the available evidence. -
Scenario Analysis (🔄):
| Scenario | Probability | Target | Trigger |
|---|---|---|---|
| Bull | Not established by the available evidence. | Stock could go up another 10% if Amazon deal happens. | Muse sustains top-free app status, Meta monetizes the AI assistant, and/or Amazon deal follows Amazon cutting off Muse. |
| Base | Not established by the available evidence. | Not established by the available evidence. | Muse remains top free app and earnings estimates/multiples rise as Evercore/Mahaney suggest, without clear fade or monetization surprise. |
| Bear | Not established by the available evidence. | Not established by the available evidence. | Narrative fades as quickly as it became, switching costs remain zero, Amazon remains cut off, and OpenAI/Instinct competition intensifies. | -
Risk Factors (⚠️):
- Narrative could fade as quickly as it became; app fads seen before.
- No moat/switching costs zero for personal AI assistant; product can be commoditized.
- OpenAI deep pockets and Q4 assistant with billion-user distribution.
- Amazon cut off Muse; partnership politics unclear.
- Meta capex/AI ROI overhang and prior reason for declining PE not fully resolved.
- Multiple expansion may be narrative-driven; earnings estimates uncertain.
- Chip trade connection to Muse architecture may require verification.
- DBMF sponsor content is promotional, not independent analysis. -
Actionable Trading/Allocation Plan (🎯):
- Verify Muse's sustained app-store rank, downloads beyond first six days, and engagement; compare with Meta AI app's 773 downloads.
- Monitor Amazon-Meta relationship after Amazon cut off Muse; watch for any deal and the cited 10% stock move scenario.
- Track OpenAI Q4 personal assistant launch and Instinct competitive developments.
- Validate CPU/on-device inference thesis by monitoring AMD, ARM, Qualcomm and any Meta architecture disclosures about virtual machines, tool calls, and sandboxing.
- Check Evercore ISI note and Meta's disclosure on AI investment ROI, monetization of advertising, subscriptions, and transaction revenue.
- Independently verify DBMF AUM and sponsor claims if using the ad as market context.

-
Creator Horizon Category (⏱️): Short-Term Technical — Creator emphasizes 4-hour bull flag, daily EMA12 riders, weekly/monthly resistance breaks and near-term altcoin patterns, with only eventual monthly confirmation discussed.
-
One-Line Thesis (💡): TheChartGuys' Chart Man Dan claims bitcoin bulls are over monthly resistance with bull-flag follow-through and rising bottom probabilities, while Nasdaq all-time highs are on the table and altcoins ZEC/HYPE/NEAR/ETH show EMA12-rider or breakout setups.
-
Key Data Points (📊):
- Bitcoin: creator claims bulls are over monthly resistance; series of lower highs and lower lows has broken; follow-through on bull flag; bears converting to bulls; increasing probabilities bottom is in.
- Bitcoin support: creator says as long as 748 is support, bulls have full control; 80,000 must be maintained for full bull control; 81 to 82 is backtest level to hold for healthy consolidation.
- Bitcoin resistance/targets: after recent high of 87.4 thousand, creator cites previous support zones around 90 and 91, then 100 psychological; says he could pick four different zones between 87,000 and 100,000.
- Bitcoin timeframe: 4-hour uptrend and potential 4-hour bull flag; daily higher low; weekly higher low; eventual monthly uptrend confirmation needed for sustained move into well into 2027.
- Nasdaq: weekly equilibrium tightening; higher low likely; 12-hour falling wedge broke bull into melt-up; all-time highs on table; creator wants new all-time high ideally before end of October; no red flags.
- ETH: weaker on move but same bull break; stalling at previous support zone held three times end 2025/start 2026; ETH/BTC must hold 2-day EMA12; equilibrium constricting, break within next week; bull break means ETH gains relative strength, bear break means Bitcoin daily consolidation and ETH consolidating.
- ZEC: creator calls daily EMA12 rider; blue-sky breakout with limited overhead supply—maybe 20 hours of trading where buyers are in red; bulls trading sideways in 4-hour equilibrium; loss of daily EMA12 likely starts weekly consolidation.
- HYPE: all-time highs; previous resistance/double top from June at 75s/76s; above it consolidated, perfect backtest and hold; 4-hour EMA12 support; 100 is tough psychological battle.
- NEAR: wall of resistance in 330s broken; topped at 391; 4-hour higher low holding EMA12 off 391; rising wedge; bull break/no follow-through suggests possible 12-hour or daily consolidation.
- Macro/catalysts: FOMC last week lifted bull sentiment; CFTC giving guidelines to White House paving way for tokenization is bullish backdrop; bearish narratives included rate hike, 30-year yields hitting X-year highs, inflation, oil, Middle East headlines, but creator says bears could not break support with follow-through.
- Gold: creator cites weekly EMA12 rider during monster move as example of EMA12 support ride; Bitcoin bulls want a longer timeframe EMA12 ride.
- Megaphone pattern: creator says it served purpose, resolved with bull break; calls it piss everybody off pattern; uncertain if AI/automated trading makes it more prevalent. -
Technical Levels & Setups OR Macro Drivers (📌):
- Bitcoin megaphone resolved with bull break; falling wedge break; bear breaks with no follow-through and bearish macro narratives failing to break support led to short covering
- Nasdaq falling wedge break and melt-up after FOMC; sentiment pickup for bulls
- EMA12 rider setups: ZEC daily, HYPE 4-hour, NEAR 4-hour, gold weekly example
- Previous resistance acting as support on backtests: HYPE, NEAR, Bitcoin
- Shorter-term oversold conditions marking longer-term higher lows: 5-minute oversold for hourly higher lows, 15-minute oversold for 4-hour higher lows, hourly oversold for 12-hour or daily higher lows
- ETH/BTC 2-day EMA12 relative-strength test and ETH equilibrium constriction
- Blue-sky breakout / limited overhead supply in ZEC
- CFTC tokenization guidelines to White House; FOMC backdrop
- Potential daily consolidation if bull break/no follow-through in NEAR; ETH/BTC bear break implies Bitcoin daily consolidation -
Risk/Reward Framework (⚖️):
- Entry: Not established by the available evidence.
- Stop: Not established by the available evidence.
- Targets: Bitcoin: 90 and 91; 100 psychological (creator-cited resistance/target zones); HYPE: 100 psychological (creator calls tough psychological battle); Nasdaq: all-time highs (creator says on table and ideally before end of October; no exact price given)
- Risk/Reward: Not established by the available evidence.
- Position Size: Not established by the available evidence.
- Probability: Not established by the available evidence. -
Scenario Analysis (🔄):
| Scenario | Probability | Target | Trigger |
|---|---|---|---|
| Bull | Not established by the available evidence. | Bitcoin resistance zones 90 and 91; 100 psychological; Nasdaq all-time highs; HYPE 100 psychological (creator-cited levels, not formal targets). | Bitcoin holds 81-82 backtest and 80,000 support, monthly uptrend eventually confirms, Nasdaq hits new all-time high ideally before end of October, ETH/BTC holds 2-day EMA12, ZEC/HYPE/NEAR continue EMA12 riders. |
| Base | Not established by the available evidence. | Not established by the available evidence. | Bitcoin daily consolidation but holds 81-82 backtest; ZEC trades sideways in 4-hour equilibrium while daily EMA12 catches up; ETH/BTC equilibrium tightens into next week. |
| Bear | Not established by the available evidence. | Not established by the available evidence. | Bitcoin fails 80,000 or 81-82 backtest; ETH/BTC breaks bear; ZEC loses daily EMA12; NEAR bull break/no follow-through leads to 12-hour or daily consolidation; bearish macro narratives regain control. | -
Risk Factors (⚠️):
- Creator's bottom-is-in probability is qualitative; no numeric probability given.
- Monthly uptrend not yet confirmed; creator says sustained move into 2027 needs eventual monthly uptrend confirmation.
- If Bitcoin goes straight up without building base, creator says move could conclude faster.
- Overhead resistance between 87,000 and 100,000; creator says he could draw four different zones, adding ambiguity.
- ETH/BTC 2-day EMA12 is key; if lost, relative-strength thesis and ETH/BTC bull break invalid.
- ZEC blue-sky breakout depends on limited overhead supply; loss of daily EMA12 likely signals weekly consolidation.
- NEAR shows bull break/no follow-through; potential 12-hour/daily consolidation.
- Macro bearish narratives (rate hike, 30-year yields, inflation, oil, Middle East) could reassert despite failure to break support.
- No exact entry, stop, risk/reward, position size, or numeric target/entry/stop levels provided for a complete trading plan. -
Actionable Trading/Allocation Plan (🎯):
- Monitor Bitcoin monthly uptrend confirmation, 80,000 support, 81-82 backtest, and 90/91/100 resistance zones.
- Monitor Nasdaq for new all-time high, especially before end of October, as creator's bull-confidence marker.
- Monitor ETH/BTC 2-day EMA12 and ETH equilibrium break within next week to resolve Bitcoin-vs-ETH focus.
- Monitor ZEC daily EMA12 and 4-hour equilibrium; note loss of daily EMA12 as weekly-consolidation signal per creator.
- Monitor HYPE previous resistance as support, 4-hour EMA12, and 100 psychological level.
- Monitor NEAR 391 higher low, 4-hour EMA12, and bull break/no follow-through for potential 12-hour/daily consolidation.
- Verify macro catalysts: CFTC tokenization guidelines to White House and FOMC-driven sentiment.
- Check whether bearish macro narratives (rate hike, 30-year yields, inflation, oil, Middle East) continue to fail to break support with follow-through.

-
Creator Horizon Category (⏱️): Long-Horizon Macro / Structural — The creator contrasts structural private-credit segments — commoditized sponsor direct lending versus bespoke collateralized/problem-solving loans — and describes a long-lived avoidance of direct lending rather than a short-term trade.
-
One-Line Thesis (💡): The creator claims the vast bulk of private credit is uncollateralized sponsor direct lending that their firm avoids as commoditized, preferring bespoke loans where collateral, complexity, and problem-solving provide an easier edge.
-
Key Data Points (📊):
- private credit — creator says the vast bulk is direct lending; no ticker or fund named
- direct lending — creator says 'we’ve always avoided' it; describes corporate loans to sponsors
- direct lending definition — creator describes lending to sponsors uncollateralized, where you make a loan and hope there is enough profits
- collateral — creator says 'we want to see the collateral'; rationale for avoiding direct lending
- complexity — creator says 'we want to get paid for complexity'; rationale for bespoke loans
- commoditization — creator calls direct lending 'far more commodity-based commodity space in the lending markets'
- direct lending returns — creator says 'it used to be you got very high returns'; current adequacy questioned
- risk compensation — creator says 'not sure you're getting paid enough for the risks'
- sponsor conflict — creator describes fighting/arm wrestling the PE sponsor to renegotiate or extend if sponsor cannot exit
- capital abundance — creator says 'there’s ton of money in it'; edge difficult
- edge — creator says 'We can’t easily get an edge there' in direct lending
- bespoke loans — creator favors solving someone’s problem one loan at a time; cites lots of complexity and value creation
- bespoke opportunity — creator says 'The pie is fantastic' and 'we can get an edge far more easily' -
Technical Levels & Setups OR Macro Drivers (📌):
- Direct lending segment: sponsor-focused corporate lending, uncollateralized, profit-dependent, described as vast bulk of private credit.
- Creator’s avoidance setup: want collateral and complexity premium; avoid commoditized direct lending.
- Edge setup: bespoke one-off loans solve borrower problems and create value, where creator says edge is easier.
- Risk setup: if loans underperform, lender fights PE sponsor over renegotiation/extension when sponsor cannot exit.
- Capital cycle setup: 'ton of money' in direct lending; commoditized space may compress risk-adjusted returns; creator unsure paid enough.
- Historical return setup: direct lending used to offer very high returns; creator implies regime may have changed. -
Risk/Reward Framework (⚖️):
- Entry: Not established by the available evidence.
- Stop: Not established by the available evidence.
- Targets: Not established by the available evidence.
- Risk/Reward: Not established by the available evidence.
- Position Size: Not established by the available evidence.
- Probability: Not established by the available evidence. -
Scenario Analysis (🔄):
| Scenario | Probability | Target | Trigger |
|---|---|---|---|
| Bull | Not established by the available evidence. | Not established by the available evidence. | Verification condition: bespoke lending continues to present complexity, value-creation, and 'edge far more easily' as creator claims. |
| Base | Not established by the available evidence. | Not established by the available evidence. | Verification condition: direct lending remains 'the vast bulk of private credit' and 'a pretty commoditized space' with 'a ton of money in it,' while creator continues to avoid it. |
| Bear | Not established by the available evidence. | Not established by the available evidence. | Verification condition: direct lending risks materialize via uncollateralized sponsor loans and 'arm wrestling the PE sponsor' over renegotiation/extensions when sponsors cannot exit. | -
Risk Factors (⚠️):
- No quantitative evidence on direct lending returns, spreads, defaults, recoveries, or collateral coverage.
- No fund, vehicle, ticker, vintage, or portfolio position named; cannot verify creator's exposure.
- Creator's edge claim for bespoke loans is qualitative; no deal-level pricing, collateral, or competition data.
- Direct lending may not be as commoditized or undercompensated as claimed; no current spread/yield evidence.
- Sponsor renegotiation risk depends on documentation and leverage; not established.
- Historical 'very high returns' statement lacks time frame or performance data. -
Actionable Trading/Allocation Plan (🎯):
- Verify private credit composition — direct lending versus other private credit — using external industry data such as Preqin, PitchBook, IMF, or Federal Reserve reports.
- Check current direct lending spreads, yields, covenant protections, and default/recovery data to test creator's 'not paid enough for the risks' claim.
- Assess bespoke/opportunistic private credit strategies for collateral, complexity premium, and borrower problem-solving evidence.
- Monitor PE sponsor-lender disputes and loan amendment/extension activity as a verification signal for the sponsor arm-wrestling risk.
- Identify the guest/firm and any fund strategy to confirm whether their stated avoidance of direct lending is actionable or only philosophical.
- Compare historical direct lending returns to current vintages to verify 'used to get very high returns.'

-
Creator Horizon Category (⏱️): Long-Horizon Macro / Structural — The claims center on multi-year aircraft development, engine vertical integration, regulatory legalization, and a five-year 10+ GW power buildout rather than near-term price levels.
-
One-Line Thesis (💡): Boom CEO claims a Mach 1.7 supersonic airliner with 130 airline orders and a U.S. regulatory unlock, while also pitching the same engine core as 42 MW behind-the-meter data-center power and 10+ GW of grid additions over five years.
-
Key Data Points (📊):
- Creator claims Mach 1.7 Overture speed and 130 orders from major airlines — headline supersonic passenger thesis.
- Creator claims whole airplane was built by essentially 50 people.
- Creator claims XB1 became first privately developed jet to break sound barrier in 2025; first supersonic Starlink installation.
- Creator claims boomless cruise/mach cutoff uses atmospheric refraction to redirect sonic boom upward; works up to Mach 1.3, or 50% faster over land; full speed over water.
- Creator claims 1973 U.S. supersonic ban ended June 6 last year via executive order; Supersonic Legalization Act passed House unanimously and got out of Senate committee unanimously recently; needs rest of Senate.
- Creator claims Rolls-Royce outsourcing failed and Boom now makes own engine from scratch; first vertically integrated jet engine core being assembled and going to test stand next month.
- Creator claims undisclosed factory made first parts last week; will scale to multiple gigawatts per year; over next 5 years aim to add 10+ gigawatts to grid.
- Creator claims data-center product uses supersonic engine core with fan removed and generator added; 42 megawatts behind-the-meter power generation; no water; tens of gigawatts of demand in inbox; first engine run next month then auction it all off.
- Creator claims Overture round trip across Atlantic at Mach 1.7 takes 3 hours; break-even fare about $3,500 round trip; will probably go for more; any dollar above that United makes good money.
- Creator claims goal is 4 years for plane but cannot say with certainty; host frames potentially 2030 give or take; CEO prioritizes fast over predictable and earliest physically possible.
- Creator claims Boeing hasn't built a new airplane in 20 years; latest airliner is carbon fiber copy of first; last new airplane launched 2004; interns born after that.
- Creator claims Concord was zero out of three on safe/comfortable/affordable; Boom should do three out of three.
- Ticker/valuation note: no ticker symbols, valuation, or financial statements are cited; Boeing and United are named without tickers. -
Technical Levels & Setups OR Macro Drivers (📌):
- Regulatory catalyst: U.S. overland supersonic ban ended by executive order; congressional legalization act advancing unanimously so far.
- Technical catalyst: boomless cruise/mach cutoff enables up to Mach 1.3 over land without ground-level boom.
- Engine vertical integration: in-house turbine blades/parts and first integrated core on test stand next month after Rolls-Royce breakup.
- Data-center pivot: Mach 1.7 engine core repurposed for 42 MW behind-the-meter generation with no water; first engine run next month then auction.
- Manufacturing scale: undisclosed factory made first parts last week; multiple GW/year capacity; 10+ GW over 5 years.
- Demand signal: 130 airline orders and tens of gigawatts of inbound data-center demand claimed.
- Incumbent inertia: Boeing no new airplane in 20 years, last launch 2004; creator frames David vs Goliath with Goliath asleep. -
Risk/Reward Framework (⚖️):
- Entry: Not established by the available evidence.
- Stop: Not established by the available evidence.
- Targets: Not established by the available evidence.
- Risk/Reward: Not established by the available evidence.
- Position Size: Not established by the available evidence.
- Probability: Not established by the available evidence. -
Scenario Analysis (🔄):
| Scenario | Probability | Target | Trigger |
|---|---|---|---|
| Bull | Not established by the available evidence. | Not established by the available evidence. | Supersonic Legalization Act passes full Senate, first engine test/run succeeds, factory scales to multiple GW/year, and Overture advances toward 4-year goal with 130 orders intact. |
| Base | Not established by the available evidence. | Not established by the available evidence. | First vertically integrated engine core reaches test stand next month and first parts from factory scale, while Overture timing slips beyond 4-year goal and data-center auction determines commercial demand. |
| Bear | Not established by the available evidence. | Not established by the available evidence. | Executive order is reversed or Senate legalization stalls, engine test/factory ramp slips, Overture timing remains uncertain, or claimed order/demand pipelines fail verification. | -
Risk Factors (⚠️):
- Regulatory reversal: creator says executive order could theoretically be reversed; full Senate passage not yet done.
- Execution: creator acknowledges many hard problems and success not guaranteed; previous Rolls-Royce outsourcing failed.
- Timing: creator cannot say with certainty; 4-year goal not a committed date; host's 2030 framing is speculative.
- Manufacturing scale: factory made first parts last week; multiple GW/year and 10+ GW over 5 years unproven.
- Demand verification: 130 airline orders and tens of GW inbound demand not independently verified in evidence.
- Data-center commercialization: first engine run next month and auction not yet completed; 42 MW, no-water, behind-meter claims unverified.
- Capital intensity: Bezos passed on seed round; building Concord described as expensive; no financials or valuation provided.
- Competitive: private jet makers may enter supersonic; Boeing could respond despite creator calling it asleep.
- No ticker/valuation mapping: Boeing and United named without tickers; no public-market instrument explicitly tied to Boom. -
Actionable Trading/Allocation Plan (🎯):
- Track Senate action on Supersonic Legalization Act and whether the June 6 executive order is made permanent or challenged.
- Verify first vertically integrated jet engine core assembly, test-stand timing next month, and first engine run.
- Verify factory first-part milestone and ramp toward multiple GW/year and 10+ GW over 5 years.
- Verify data-center auction, customer contracts, 42 MW behind-meter output, and no-water claims.
- Verify 130 airline orders and identify counterparties/carriers.
- Monitor Overture timeline against 4-year goal and host's 2030 give-or-take framing.
- Verify XB1 boomless cruise/mach cutoff up to Mach 1.3 and full-speed over-water claims independently.
- Map named companies Boeing and United and any Boom-related public tickers if they emerge; no tickers are cited in transcript.
- Compare stated $3,500 round-trip transatlantic break-even fare with airline economics and fuel/engine assumptions.

-
Creator Horizon Category (⏱️): Short-Term Technical — Description frames near-term trader focus on continuation after a 1% SPY day and 3% NASDAQ move, with memory/chips/META in focus.
-
One-Line Thesis (💡): The SEP 22 stream headline centers on whether equities continue after a 1% SPY day and 3% NASDAQ move, with all eyes on memory, chips, META, a China event, and META connect in focus.
-
Key Data Points (📊):
- Title: CHINA, META, LEOPOLD, KOREA - SEP 22 - Stock Market LIVE, Live Trading, Stock News — headline keywords are China, META, Leopold, Korea, and Sep 22.
- Description: traders look for stock market to continue after 'finally getting a 1% day on the SPY & 3% move on the NASDAQ' — literal index move claims.
- Description: 'All eyes are on the outperformance of Memory, chips & META' — stated relative-strength focus.
- Description: 'China event and META connect in focus' — literal catalyst phrases.
- Title includes LEOPOLD — entity/ticker not established in metadata.
- Title includes KOREA — country/market reference not detailed in metadata.
- Creator lists platforms: Etrade pro (screen shown), ThinkOrSwim (long term investing), Fidelity (long term) — operational context.
- Creator promotes Stock & options Bootcamp at https://www.JoshAnswers.com and a nightly watchlist/main channel tutorial.
- Creator disclaimer: educational purposes only; options trading risky; potential to lose most or all initial investment; do not copy trades. -
Technical Levels & Setups OR Macro Drivers (📌):
- Creator-stated continuation setup: traders look for the stock market to continue after a 1% SPY day and 3% NASDAQ move.
- Creator-stated relative-strength focus: outperformance of Memory, chips & META.
- Creator-stated event catalyst focus: China event and META connect.
- Headline watch items: China, META, Leopold, Korea.
- Live trading context: Etrade pro screen shown; ThinkOrSwim and Fidelity referenced for long-term investing.
- Educational/options bootcamp promotion and nightly watchlist are part of stream context. -
Risk/Reward Framework (⚖️):
- Entry: Not established by the available evidence.
- Stop: Not established by the available evidence.
- Targets: Not established by the available evidence.
- Risk/Reward: Not established by the available evidence.
- Position Size: Not established by the available evidence.
- Probability: Not established by the available evidence. -
Scenario Analysis (🔄):
| Scenario | Probability | Target | Trigger |
|---|---|---|---|
| Bull | Not established by the available evidence. | Not established by the available evidence. | Literal stated focus: stock market continues after the 1% SPY day and 3% NASDAQ move, with outperformance of Memory, chips & META and attention on China event/META connect. |
| Base | Not established by the available evidence. | Not established by the available evidence. | Creator-stated expectation: traders look for the stock market to continue after finally getting a 1% day on the SPY & 3% move on the NASDAQ. |
| Bear | Not established by the available evidence. | Not established by the available evidence. | Verification condition: stock market does not continue after the 1% SPY day and 3% NASDAQ move described, contrary to stated trader focus. | -
Risk Factors (⚠️):
- Metadata-only evidence: no transcript, so entry, stop, target, size, probability, and risk/reward are not established.
- The 1% SPY and 3% NASDAQ moves are creator-stated in the description and not independently verified in the evidence.
- China event and META connect are named catalysts but not defined or scheduled in the evidence.
- Leopold and Korea are headline keywords with no explained entity, ticker, or macro linkage in the evidence.
- Memory and chips are sector labels; specific tickers, valuations, or earnings details are not established.
- Creator discloses options-trading risk and potential loss of most or all initial investment; educational-only disclaimer. -
Actionable Trading/Allocation Plan (🎯):
- Verify actual SPY and NASDAQ daily performance for the referenced session to confirm the 1% and 3% claims.
- Review full stream/transcript for any stated levels, entries, stops, targets, probabilities, or position sizing; none are present in metadata.
- Identify which memory and chip tickers the creator discusses; evidence only states sector labels.
- Clarify what 'China event' and 'META connect' refer to via transcript, calendar, or company event schedule.
- Determine what 'Leopold' and 'Korea' refer to in the title; metadata does not establish entity or ticker.
- Confirm whether META is discussed as a ticker, corporate catalyst, or both in the stream.
- Track platform context: Etrade pro screen shown for live trading; ThinkOrSwim and Fidelity described for long term.

-
Creator Horizon Category (⏱️): Long-Horizon Macro / Structural — Creator frames AI hardware energy efficiency and first-principles computing as a multi-year structural bottleneck and paradigm shift.
-
One-Line Thesis (💡): Naveen Rao of Unconventional AI claims AI is the next evolution of humanity, but current digital hardware is energy-inefficient and a power gap is looming, so Unconventional AI is pursuing physics-based oscillator computing to achieve a thousand X power efficiency within three and a half years.
-
Key Data Points (📊):
- Unconventional AI — AI chip startup; Naveen Rao co-founder/CEO; rethinking foundations of how a computer works for power efficiency.
- 1000x power efficiency — initial goal within 5 years, revised to three and a half years because progress was faster than anticipated.
- Google — 3.2 quadrillion tokens/month; at 10 joules/token equals 12 gigawatts.
- US data centers — about 40 gigawatts today.
- World data centers — under 100 gigawatts today.
- Energy shortfall — creator estimates running out of energy pretty fast, in like 3 years or so.
- AI market — call it a trillion-dollar market in 2030, maybe bigger.
- Token serving cost — about 50% is energy; rest is CAPEX hardware and floor space.
- Business case — monetize every watt 1,000x better than existing hardware.
- Databricks — 2023 join forces; that business is a quarter of total revenue of Databricks today.
- Nirvana Systems — founded 2014; first AI chip company; sold to Intel; Rao ran AI group at Intel.
- ChatGPT — happened in 2022; after it, Rao's GPU platform was best game in town for people building their own models.
- Human brain — about 20 watts.
- Monkey brain — about 1 watt; cell phone about 1 watt.
- Human cortex — moves about 16 billion bits/sec; 13-14 billion neurons.
- GPU/high-end system — moves nearly 30 trillion bits in and out of memory per second outside chip; inside chip probably 10-100x more.
- Moore's law — making transistors smaller has largely ended; no longer seeing efficiency gains just from smaller transistors.
- ENIAC — 1945, artillery trajectory calculation, built to be faster than humans.
- Computers — mechanical, analog around turn of century, digital in 1930s/1940s; 1945 operation similar to today.
- Uno — open-source simulated image generation model built on a set of oscillators; first demonstration of scale, training, and useful output.
- Sparsity — transcript ends mid-sentence: Sparsity mean. -
Technical Levels & Setups OR Macro Drivers (📌):
- Exponential AI compute demand versus linear energy supply creates a gap to solve with technology.
- Data center planning shifts from floor space to networking to GPUs to energy; power contract first, monetize every watt.
- Current digital abstractions are lossy; most energy goes into moving information; hardware substrate innovation is needed for true intelligence.
- Unconventional AI top-to-bottom stack: theorists, models trained on real data, physical circuit architecture/design/model, then system/board/product.
- Physics-based and dynamical systems computing: metronome synchronization, bird flocking, ant colonies, brain physics; connect oscillators to generative AI.
- Uno oscillator image-generation model was open-sourced and simulated; state-space trajectories conditioned on airplane/car/bird outputs.
- Moore's law efficiency scaling has ended; frequency and single-thread scaling already stalled.
- Biology as proof: brains achieve intelligence at 20W/1W/8mW; synthetic systems move far more bits.
- Databricks 2023 combination provides a distribution and commercial validation claim, described as a quarter of Databricks revenue today. -
Risk/Reward Framework (⚖️):
- Entry: Not established by the available evidence.
- Stop: Not established by the available evidence.
- Targets: Not established by the available evidence.
- Risk/Reward: Not established by the available evidence.
- Position Size: Not established by the available evidence.
- Probability: Not established by the available evidence. -
Scenario Analysis (🔄):
| Scenario | Probability | Target | Trigger |
|---|---|---|---|
| Bull | Not established by the available evidence. | Not established by the available evidence. | Unconventional AI achieves a thousand X power efficiency within three and a half years and monetizes every watt 1,000x better than existing hardware. |
| Base | Not established by the available evidence. | Not established by the available evidence. | AI compute demand continues growing exponentially toward the trillion-dollar 2030 market while the energy gap persists and the first-principles hardware stack progresses from simulation/Uno to physical circuits. |
| Bear | Not established by the available evidence. | Not established by the available evidence. | Energy shortfall binds in roughly 3 years as creator estimates, Moore's law efficiency gains remain largely ended, and current abstractions keep moving too many bits. | -
Risk Factors (⚠️):
- No public ticker, valuation, funding, revenue, or customer data in evidence; Unconventional AI is a private startup.
- 1000x power efficiency and the three-and-a-half-year timeline are creator claims, not independently verified.
- Uno is a simulated/open-source image model, not evidence of a physical chip or system product.
- Energy calculations rest on assumptions: 10 joules/token, Google's 3.2 quadrillion tokens/month, and linear energy scaling.
- Transcript cuts off mid-sentence on sparsity; technical details are incomplete.
- Databricks revenue contribution claim is unverified.
- No entry, stop, target, position sizing, or probability parameters are provided.
- No discussion of competition, manufacturing, capital intensity, regulatory issues, or customer adoption.
- Thesis could be invalidated if efficiency breakthroughs occur in existing GPU/digital architectures or if AI demand forecasts change. -
Actionable Trading/Allocation Plan (🎯):
- Track Unconventional AI disclosures for the 1000x power-efficiency milestone and the revised three-and-a-half-year target.
- Verify Uno oscillator model open-source results, scaling, and image-generation quality.
- Monitor Google token volume and energy disclosures to test the 3.2 quadrillion tokens/month and 12 GW estimate.
- Monitor US and world data center power capacity versus the 40 GW and under-100 GW baselines, plus power contract trends.
- Watch for physical hardware, board, system, or product evidence from Unconventional AI, not just simulated models.
- Verify the Databricks revenue contribution claim and any commercial traction.
- Compare AI token serving cost energy share versus the stated about 50%.
- Map public-market read-throughs to AI chips, data centers, or power only if evidence identifies tickers; none established here.

-
Creator Horizon Category (⏱️): Long-Horizon Macro — Creator frames the issue as a US innovation boom with job creation and US-China tech competition, while warning about political and protest risks over time.
-
One-Line Thesis (💡): Creator claims the US innovation boom is creating jobs and that the US is finally ahead of China on tech, but warns that politicians with talking points/grant cuts and protests spilling into canceled projects could cut the knees off tech innovation.
-
Key Data Points (📊):
- Headline claim: US is finally ahead of China when it comes tech — creator's macro keyword.
- Headline claim: jobs are going to be created in the US innovation boom — creator's macro keyword.
- 18 hours a day — creator says in Taiwan they build fabs 18 hours a day.
- 14 hours — creator says workers take a bathroom break after 14 hours.
- 17th in math — creator cites US rank while contrasting with Taiwan fab work.
- Politicians with flip-phones and blackberries — creator warns against them determining US technology innovation.
- Protests spilling over into canceled projects — creator identifies this as a worry.
- Politicians with talking points and grant — creator warns they can cut the knees off tech in this innovation boom.
- Tickers: none cited in the available evidence. -
Technical Levels & Setups OR Macro Drivers (📌):
- US innovation boom as a job-creation engine.
- US technology leadership versus China.
- Political decision-making by officials the creator depicts as technologically illiterate.
- Protest activity spilling over into canceled projects.
- Grant cuts and political talking points as policy risks to tech innovation. -
Risk/Reward Framework (⚖️):
- Entry: Not established by the available evidence.
- Stop: Not established by the available evidence.
- Targets: Not established by the available evidence.
- Risk/Reward: Not established by the available evidence.
- Position Size: Not established by the available evidence.
- Probability: Not established by the available evidence. -
Scenario Analysis (🔄):
| Scenario | Probability | Target | Trigger |
|---|---|---|---|
| Bull | Not established by the available evidence. | Not established by the available evidence. | Creator's stated positive condition: US is finally ahead of China when it comes tech, and innovation-boom jobs are created. |
| Base | Not established by the available evidence. | Not established by the available evidence. | Current condition in excerpt: US is ahead of China on tech and the innovation boom is creating jobs, while creator's worries remain unrealized. |
| Bear | Not established by the available evidence. | Not established by the available evidence. | Protests spill over into canceled projects, or politicians with talking points and grant cut the knees off tech in this innovation boom. | -
Risk Factors (⚠️):
- Political technology illiteracy: creator explicitly worries politicians with flip-phones and blackberries determine technology innovation.
- Protest spillover: creator explicitly worries protests spill over into canceled projects.
- Grant cuts and talking points: creator warns these can cut the knees off tech in the innovation boom.
- US math ranking: creator cites 17th in math as context for competitiveness concern.
- No tickers, projects, grants, politicians, or timeline named in the excerpt; claims cannot be mapped to specific securities.
- US-ahead-of-China tech claim is not independently substantiated in the evidence.
- Job-creation claim is not quantified or sourced in the evidence. -
Actionable Trading/Allocation Plan (🎯):
- Verify creator's US-ahead-of-China tech claim against third-party competitiveness metrics.
- Monitor policy actions for grant cuts or talking points targeting tech innovation, which creator identifies as a risk.
- Track protest activity and whether it leads to announced canceled projects.
- Track job creation tied to the US innovation boom for corroboration.
- Search the full video for any named tickers, grants, politicians, or project cancellations absent from this excerpt.

-
Creator Horizon Category (⏱️): Long-Horizon Macro / Structural — Evidence describes a data-center investment's effect on local sales tax collections and teacher salary supplements, not trade timing.
-
One-Line Thesis (💡): A speaker claims that because of our investment, the tax surplus would go straight to teachers, and describes sales tax collections going from 5% 10% to about 60 or 70% and peaking at about 260%.
-
Key Data Points (📊):
- because of our investment, the tax surplus would go straight to teachers.
- there are six taxing entities in our parish.
- The Richland Parish School Board collects 51% of the taxes for the district.
- sales tax collections go from 5% 10% which is normal for a school system to about 60 or 70%.
- at that time the number of workers at the data center site increased.
- those collections peaked at about 260%.
- we have a 1 cent and a 1/2 cent sales tax that's dedicated to employee salaries.
- In December of 2025, we gave out a 1/2 cent sales tax check.
- That check doubled from the previous year. So it went from roughly about $4,000 to about $8,000
- we hadn't seen a full year of spiked increases in sales tax collections. That happened this past June.
- our certified employees received an increase of about $40,000 in their sales tax.
- They got a $50,000 check.
- the check the previous year was $10,000.
- if you take that December increase and the June increase, it was a net of about $45,000 for our teachers. -
Technical Levels & Setups OR Macro Drivers (📌):
- Increase in number of workers at the data center site coincided with sales tax collection increases.
- 1 cent and 1/2 cent sales taxes are dedicated to employee salaries.
- Sales tax increases are announced at school board meetings, and educators can estimate larger sales tax checks.
- At the time worker count at the data center site increased, collections peaked at about 260%.
- December 2025 check predates a full year of spiked increases; the June check followed the full-year spiked sales tax collections. -
Risk/Reward Framework (⚖️):
- Entry: Not established by the available evidence.
- Stop: Not established by the available evidence.
- Targets: Not established by the available evidence.
- Risk/Reward: Not established by the available evidence.
- Position Size: Not established by the available evidence.
- Probability: Not established by the available evidence. -
Scenario Analysis (🔄):
| Scenario | Probability | Target | Trigger |
|---|---|---|---|
| Bull | Not established by the available evidence. | Not established by the available evidence. | Verification condition: data center site worker count and sales tax collections continue increasing beyond the cited about 260% peak. |
| Base | Not established by the available evidence. | Not established by the available evidence. | Verification condition: sales tax collections remain near the cited about 60 or 70% increase or about 260% peak, sustaining the cited teacher sales-tax checks. |
| Bear | Not established by the available evidence. | Not established by the available evidence. | Verification condition: sales tax collections revert toward the cited 5% 10% normal or the data center site worker count declines. | -
Risk Factors (⚠️):
- Independent verification of sales tax percentages, dollar checks, or data center identity is not provided in evidence.
- Cited teacher check amounts include $40,000 increase, $4,000 check, $50,000 check, $10,000 previous year, and $45,000 net, which are not fully reconciled in the evidence.
- Evidence does not establish whether the increased data center site worker count persists.
- Evidence lacks ticker, valuation, position, target, or portfolio implication.
- Exact year of 'this past June' is not stated in evidence. -
Actionable Trading/Allocation Plan (🎯):
- Verify Richland Parish School Board meeting minutes and tax collection reports for December 2025 and June distributions.
- Identify the data center project and verify workforce counts tied to the cited sales tax increases.
- Reconcile the $4,000/$8,000, $40,000, $50,000, $10,000, and $45,000 teacher-check figures against board records.
- Track monthly parish sales tax collections to test whether cited about 60 or 70% and about 260% increases persist.
- Confirm whether the 1 cent and 1/2 cent sales taxes are legally dedicated to employee salaries and how surplus is allocated.
- Check whether any publicly traded company, ticker, or valuation is tied to the referenced data center.
-
Creator Horizon Category (⏱️): Short-Term Technical — Creator says 'we're going to look out two a month from now and I view these as opportunities relative to the Stock selling off on this moment,' placing the actionable view on a tactical selloff-rebound timeframe.
-
One-Line Thesis (💡): The Compound speaker claims Elon Musk wants AI slowdown because his model effort is way behind Anthropic and OpenAI, that only regulatory capture could let anyone catch those leaders, and that the related selloff in semis and stocks is an opportunity looking out two months.
-
Key Data Points (📊):
- Elon Musk said 'Yeah, we actually do need to slow down' — creator frames this as Musk needing to slow down to catch up.
- Musk 'knows from a model perspective, they're way behind anthropic and open AI' — creator's competitive claim.
- Anthropic and OpenAI 'are so far ahead no one could really catch them unless there's a regulatory capture type of moment' — creator's structural AI-leadership claim.
- 'semis did' get crushed — creator references semiconductor selloff during a 'black Monday'/'black month' event.
- 'we're going to look out two a month from now and I view these as opportunities relative to the Stock selling off on this moment' — creator's stated two-month opportunity framing.
- Musk 'has talked about the concept of safety and he he's been consistent with that' — creator's concession on Musk safety messaging.
- No specific ticker, price, level, valuation, entry, stop, target, ratio, position size, or probability appears in EVIDENCE — verification gap. -
Technical Levels & Setups OR Macro Drivers (📌):
- AI model race: Anthropic and OpenAI depicted as far ahead; Musk's model effort and other rivals implied behind.
- Musk slowdown narrative: creator attributes it to competitive catch-up rather than pure safety.
- Regulatory capture cited as the only route that could let rivals catch Anthropic and OpenAI.
- Semis and stocks selloff on 'black Monday'/'black month' event.
- Contrarian setup: creator views the current stock/semis selloff as an opportunity over two months. -
Risk/Reward Framework (⚖️):
- Entry: Not established by the available evidence.
- Stop: Not established by the available evidence.
- Targets: Not established by the available evidence.
- Risk/Reward: Not established by the available evidence.
- Position Size: Not established by the available evidence.
- Probability: Not established by the available evidence. -
Scenario Analysis (🔄):
| Scenario | Probability | Target | Trigger |
|---|---|---|---|
| Bull | Not established by the available evidence. | Not established by the available evidence. | Creator says current stock/semis selloff is an opportunity looking out 'two a month from now.' |
| Bear | Not established by the available evidence. | Not established by the available evidence. | Creator notes 'semis did' get crushed and everyone expected a 'black Monday'/'black month' stock crush. | -
Risk Factors (⚠️):
- No tickers, entry, stop, target, ratio, position size, or probability provided — cannot verify creator's risk parameters.
- Regulatory capture claim is speculative and unverified in EVIDENCE.
- Claim that Musk's slowdown is due to being behind Anthropic/OpenAI is creator interpretation, not confirmed by the Musk quote alone.
- Selloff attribution to the weekend event and AI competition is asserted but not quantified.
- Two-month opportunity view lacks valuation, catalyst schedule, or benchmark trigger.
- Potential invalidation: if Anthropic/OpenAI leadership does not persist or regulatory capture does not occur, the structural gap claim weakens. -
Actionable Trading/Allocation Plan (🎯):
- Monitor OpenAI and Anthropic model releases/benchmarks for evidence they remain far ahead.
- Track any AI regulatory-capture developments as the catalyst referenced by creator.
- Monitor semiconductor sector price action over creator's stated two-month horizon to test the opportunity framing.
- Seek exact tickers, levels, position sizing, or targets if provided outside this transcript; none appear in EVIDENCE.
- Verify whether the 'black Monday'/'black month' selloff in stocks and semis continues or reverses.
-
Creator Horizon Category (⏱️): Short-Term Technical — The video title frames a live pre-market prep focused on a broad gap up and a possible same-session rally, i.e., a short-term technical horizon.
-
One-Line Thesis (💡): Trade Brigade's metadata headline claims a broad gap up ('GAP UP EVERYWHERE') and asks whether another 'LOCK OUT Rally!?' is underway, but no tickers, levels, catalysts, or trade parameters are provided in the available evidence.
-
Key Data Points (📊):
- "[LIVE] Pre-Market Prep – GAP UP EVERYWHERE – Another LOCK OUT Rally!?" — video title headline
- "We are live every trading day at 8:00 AM EST" — creator's stated schedule
- "futures traders and options traders" — stated audience
- Tickers/macro keywords — Not established by the available evidence beyond broad "GAP UP EVERYWHERE" and "LOCK OUT Rally!?" phrasing. -
Technical Levels & Setups OR Macro Drivers (📌):
- Creator headline: GAP UP EVERYWHERE — broad gap-up setup
- Creator headline: Another LOCK OUT Rally!? — possible continuation rally thesis framed as a question
- Live pre-market technical analysis for futures traders
- Live pre-market technical analysis for options traders
- Scheduled live every trading day at 8:00 AM EST -
Risk/Reward Framework (⚖️):
- Entry: Not established by the available evidence.
- Stop: Not established by the available evidence.
- Targets: Not established by the available evidence.
- Risk/Reward: Not established by the available evidence.
- Position Size: Not established by the available evidence.
- Probability: Not established by the available evidence. -
Scenario Analysis (🔄):
| Scenario | Probability | Target | Trigger |
|---|---|---|---|
| Bull | Not established by the available evidence. | Not established by the available evidence. | Literal title phrases "GAP UP EVERYWHERE" and "Another LOCK OUT Rally!?" — verify whether the creator presents a broad gap-up continuation rally. |
| Base | Not established by the available evidence. | Not established by the available evidence. | Literal title "[LIVE] Pre-Market Prep" — verify what the creator actually says in the video, since metadata only establishes a pre-market prep session. | -
Risk Factors (⚠️):
- Metadata-only evidence; no actual tickers, levels, catalysts, or trade rationale are available.
- Headline is interrogative ("Another LOCK OUT Rally!?") and does not assert a confirmed rally.
- No entry, stop, target, risk/reward, position size, or probability is stated.
- No specific market instruments are identified beyond broad categories: futures and options. -
Actionable Trading/Allocation Plan (🎯):
- Verify the video/live squawk for the creator's actual tickers, levels, and trade plans not present in the metadata.
- Check whether "GAP UP EVERYWHERE" is defined by specific instruments or index futures in the full session.
- Confirm the creator's definition and invalidation criteria for "LOCK OUT Rally."
- Treat any trading parameters as absent unless the full video provides them; none are in the available evidence.

-
Creator Horizon Category (⏱️): Short-Term Technical — Creator frames Sep 21 action around post-option-expiration moves, live trading, and BoJ/Fed reaction.
-
One-Line Thesis (💡): Creator's Sep 21 headline claims center on GLND, GRML and MINERALS, with the market set to return after a big option expiration while oil/geopolitics lurk and BoJ/Fed reaction drives moves after expiration.
-
Key Data Points (📊):
- GLND, GRML & MINERALS — tickers/sectors highlighted in title
- SEP 21 — stream/publication date
- #fed #fomc — macro keywords in title/description
- BoJ & Fed Reaction — catalyst cited in description
- One of the biggest option expirations — event cited in description
- The moves come AFTER the expiration — creator's stated sequencing
- Market set to return after a big expiration — description claim
- oil and geopolitics still lurk around the corner — cited risk factors
- Trading on 3 different platforms: Etrade pro (screen shown), ThinkOrSwim (long term investing), Fidelity (long Term) — platform disclosure
- Stream is for educational purposes; options trading risky; do not copy trades — disclaimer
- No literal price levels, entries, stops, targets, probabilities, valuations, or position sizes appear in the evidence. -
Technical Levels & Setups OR Macro Drivers (📌):
- Post-option-expiration move setup: creator says moves come after expiration
- BoJ and Fed reaction as macro catalyst
- Oil and geopolitics as lingering risk drivers
- GLND, GRML, MINERALS focus in title
- Live trading in real time across options/equities with viewer questions
- Big option expiration followed by market return -
Risk/Reward Framework (⚖️):
- Entry: Not established by the available evidence.
- Stop: Not established by the available evidence.
- Targets: Not established by the available evidence.
- Risk/Reward: Not established by the available evidence.
- Position Size: Not established by the available evidence.
- Probability: Not established by the available evidence. -
Scenario Analysis (🔄):
| Scenario | Probability | Target | Trigger |
|---|---|---|---|
| Bull | Not established by the available evidence. | Not established by the available evidence. | Verification condition: post-expiration market return is accompanied by no oil/geopolitics escalation and BoJ/Fed reaction resolves without a risk-off shock; creator states no upside target. |
| Base | Not established by the available evidence. | Not established by the available evidence. | Literal evidence: Market set to return after a big expiration; moves come AFTER the expiration. |
| Bear | Not established by the available evidence. | Not established by the available evidence. | Literal evidence: oil and geopolitics still lurk around the corner; big option expirations + BoJ & Fed Reaction as event risk. | -
Risk Factors (⚠️):
- Metadata-only evidence; no actual stream trade claims, levels, or outcomes are available.
- Creator provides no specific entry, stop, target, ratio, or position size.
- Oil and geopolitics still lurk around the corner — cited risk.
- Post-option-expiration and BoJ/Fed reaction can create volatility; creator says moves come after expiration.
- GLND, GRML, MINERALS are named but no valuation, fundamentals, or ticker confirmation is provided.
- Options trading risk disclaimer: creator says you are more than likely to lose money copying; consult a professional. -
Actionable Trading/Allocation Plan (🎯):
- Verify GLND and GRML tickers and the MINERALS sector reference against exchange data and the linked nightly watchlist.
- Monitor the Sep 21 post-option-expiration session for moves after expiration as claimed.
- Track BoJ and Fed/FOMC reaction headlines to validate the stated macro catalyst.
- Monitor oil and geopolitical developments as the creator's cited lurking risks.
- Extract any specific levels, entries, stops, targets, or position sizes from the stream itself; metadata establishes none.
- Review creator's linked Bootcamp/Watchlist only for stated educational context, not as verified recommendations.

-
Creator Horizon Category (⏱️): Long-Horizon Macro / Structural — The discussion is structural, centered on mobile-gaming ad-market scale, deep-learning recommendation systems, and AppLovin's claimed shift from game user acquisition into e-commerce discovery, not short-term technical levels.
-
One-Line Thesis (💡): All-In Podcast guest Adam Farugi claims AppLovin is an under-the-radar mobile-gaming ad platform hiding inside 100,000 mobile games, with roughly $20B own-platform ad spend and a ~$50B mobile-gaming ad ecosystem, using deep-learning recommendation models to move from game-to-game intent into e-commerce discovery and compete with Facebook/Meta-style performance advertising.
-
Key Data Points (📊):
- Video framing: 'Adam is probably the best founder no one's ever heard of' and there is an 'ad platform hiding inside 100,000 mobile games' that is 'quietly outperforming Facebook ads for e-commerce brands'.
- Video framing: of 'thousand plus IPOs,' the number one most valuable is 'AppL. Appe.' - ticker/name caption is ambiguous and not fully established.
- Adam Farugi describes AppLovin/Apploving as an advertising company helping mobile game developers monetize that space.
- Adam says the company disclosed nearly two years ago, in January, that there was $11B per year of ad spend on its own platform.
- Adam says since that disclosure, the platform has grown roughly 60% year-over-year.
- Adam grosses that growth up to a nice round number today: about $20B.
- Adam says mobile gaming is monetized by other ad companies too; more than double again and round off to about $50B of advertising spent every year in the mobile gaming ecosystem.
- Adam says social was a $50B opportunity not very long ago; mobile gaming space is growing quickly.
- Adam says rewarded ads and engagement create the possibility to create intent, historically driving users from one game experience to the next.
- Adam claims deep-learning models are now powerful enough to take the same mobile-game ad space and give adults a shopper-behavior experience, tapping larger economies.
- Adam says advertising was ML 1.0 and the first implementation of technologies now driving AI; large language models have greater economic value than advertising, but advertising is a very profitable deep-learning implementation.
- Adam says recommendation systems and large language models are related and research ports both ways.
- Adam says he started his career in 2005, when ads were spam and technologies were weak; Facebook paired data with technology to make ads relevant; most shopping recommendations today come from Instagram.
- Adam says in AppLovin's domain people love the ads, including mini-games appearing in other games and playing previews.
- Adam distinguishes bottom-of-funnel intent ads, which he says will almost exclusively compete with Google search, from discovery ads that create new demand and drive Facebook's ad business and what AppLovin aspires to do.
- Adam says AppLovin does not track location at all and mic parsing is not realistic; social-network relationships or search behavior may drive ad relevance.
- Adam says the better ad technologies get, the faster GDP growth, because digital ad economy is a big part of GDP.
- Adam says the company started in Silicon Valley, is in Palo Alto, he is based in LA, and engineering offices are in Palo Alto, Beijing, and Singapore.
- Adam says the company did not raise much venture money and went public in April 2021 at about a $28B market cap.
- Adam says 2021 had $600M of EBITDA, a $28B IPO market cap, and a high of $40B.
- Adam says he stopped talking to investors, started buying back stock, and since then bought roughly $6B of the company's stock.
- Adam says the company implemented a performance stock plan across key people, not just the CEO, to retain talent during the downturn.
- Adam says the deep-learning model launched in April 2023 and the company was still not talking to investors.
- Adam says in September 2023 he went to New York, the stock was about $80, and in that week the stock went from $80 to $150 and market cap from $28B to $55B.
- Quoted claim in evidence: 'They're going to print something like $6 billion in cash this year' - speaker, entity, and period are not fully attributed in the provided transcript.
- Interviewer claim in evidence: OpenAI has an ad product now and ChatGPT has said they're going to make it free; the discussion asks how advertising changes with chatbot queries. -
Technical Levels & Setups OR Macro Drivers (📌):
- Mobile casual gaming scale: over 1B daily players who are adults and heads of households, supporting a claimed ~$50B annual mobile-gaming ad ecosystem.
- Rewarded ad and mini-game preview engagement creates intent and discovery rather than only bottom-of-funnel search demand.
- Expansion from game-to-game user acquisition into e-commerce shopper-behavior discovery, which Adam says taps larger economies.
- Performance-based ad selling: better algorithm drives advertiser return, which drives advertiser scaling.
- Quiet operating posture and limited press/VC early funding, which Adam says let the company build without a high public profile.
- Competitive AI ad backdrop: LLM/OpenAI ads may compete with Google search on known-intent transactions, while discovery ads remain the Facebook/Meta-style prize AppLovin pursues. -
Risk/Reward Framework (⚖️):
- Entry: Not established by the available evidence.
- Stop: Not established by the available evidence.
- Targets: Not established by the available evidence.
- Risk/Reward: Not established by the available evidence.
- Position Size: Not established by the available evidence.
- Probability: Not established by the available evidence. -
Scenario Analysis (🔄):
| Scenario | Probability | Target | Trigger |
|---|---|---|---|
| Bull | Not established by the available evidence. | Not established by the available evidence. | Adam's claim that deep-learning models let the same rewarded-ad space add shopper behavior and tap larger economies is validated by scaling e-commerce discovery ad spend beyond mobile-gaming user acquisition. |
| Base | Not established by the available evidence. | Not established by the available evidence. | AppLovin/Apploving maintains the claimed mobile-gaming ad footprint: own-platform ad spend grossed to about $20B and ecosystem around $50B, with roughly 60% year-over-year growth since the last disclosure. |
| Bear | Not established by the available evidence. | Not established by the available evidence. | Evidence-cited competition from Google/OpenAI/LLM ads in bottom-of-funnel search closes the transaction loop without economic expansion, while privacy/creepiness concerns constrain discovery-ad targeting. | -
Risk Factors (⚠️):
- Thesis relies on Adam's own unaudited figures and forward gross-ups; no current audited financial statements are in evidence.
- Bottom-of-funnel ad demand may be absorbed by Google/LLM/OpenAI ad products; Adam says that model will almost exclusively compete with Google search.
- Discovery-ad expansion into e-commerce may fail if deep-learning recommendation models do not replicate Meta-style ad performance.
- Privacy or regulatory backlash around location, microphone, or relationship-based ad targeting could impair relevance; Adam says AppLovin does not track location and mic parsing is not realistic.
- Buyback support may become less aggressive as market cap rises; Adam says the company cannot buy back all that aggressively anymore.
- Transcript is truncated and caption-garbled; ticker, current market cap, current price, current ad spend, and speaker attribution for the '$6B cash this year' quote are not fully established.
- No entry, stop, target, position size, probability, or risk-reward ratio is stated by the creator. -
Actionable Trading/Allocation Plan (🎯):
- Verify AppLovin/Apploving ticker and legal entity from exchange filings because transcript captions show 'AppL. Appe.' and 'Apploving'.
- Reconcile claimed $11B own-platform ad spend, roughly 60% year-over-year growth, about $20B current gross-up, and about $50B mobile-gaming ecosystem TAM against company disclosures and third-party ad-spend estimates.
- Track the April 2023 deep-learning model launch and any disclosed advertiser ROI or e-commerce discovery metrics.
- Monitor OpenAI, Google, and other LLM ad product rollouts to see whether they compete on bottom-of-funnel search intent or discovery.
- Follow privacy and regulatory actions on location, microphone, and social-graph ad targeting as potential constraints.
- Clarify the '$6 billion in cash this year' quote: speaker, entity, and period are not established in the provided evidence.

-
Creator Horizon Category (⏱️): Short-Term Technical — Creator analyzes daily/weekly charts, rotation, and levels such as weekly 12 EMA and FOMC lows for S&P 500/NASDAQ and individual tickers.
-
One-Line Thesis (💡): TheChartGuys' Joey maintains a bullish stance on S&P 500 and NASDAQ, expecting weekly higher lows while watching for semiconductor/memory leadership to return and XLF/XLV to weaken as rotation resumes.
-
Key Data Points (📊):
- Headline: broad market rotation; semiconductors and memory trying to come back on the map, impacting sectors that held the torch while they cooled.
- Headline: metals bulls try to shape healthy weekly higher lows at a 'do or die' spot.
- Headline: crypto — 'Is crypto showing us that maybe this move has some juice left in it?'
- S&P 500: weekly 12 EMA acts as support, so bulls have nothing to worry about.
- S&P 500: daily lower high resistance; watch for inverse head and shoulders; bulls need daily uptrend for healthy weekly higher low.
- S&P 500: if lose FOMC lows, red flag and point toward monthly consolidation.
- S&P 500: needs increasing bear volume to get back down to lows.
- Oil has been ripping but hasn't taken S&P 500 down.
- NASDAQ: tightening range bear break, no follow-through, right back to resistance; bulls need regain daily uptrend.
- NASDAQ: weekly higher low could lead to weekly uptrend and monthly bull flag.
- Tech split: semis/memory vs Mag 7/software; 2026 and 2025 move driven by semis/memory under AI narrative.
- INTC and TSM monthly higher lows done; AMD back near all-time highs.
- MU: still sideways; needs through highs with follow-through and above double top for confident monthly higher low.
- SNDK: similar EQ high/low/lower high/higher low; right up on resistance; break would set monthly higher low.
- Rotation: if semis/memory show bullish signs, be cautious of XLF and XLV as the B team.
- Semis bullish sign: bear break, no follow-through; weekly downtrend confirm without follow-through and snap back up on September 3.
- XLF: weak; daily downtrend guide; room for daily lower high compared to 5762 and FOMC lows.
- XLF/SPY ratio: monthly lower high likely; testing monthly EMAs; now broken down; financial sector out.
- XLV: testing weekly 12 EMA; if higher low healthy; if lose weekly 12 EMA, monthly consolidation.
- Russell: still quite weak; part of monthly consolidation gang; daily downtrend guide.
- SMH: still sideways range; need break bull with follow-through for monthly higher low; bumping resistance; bit of a megaphone.
- IGV: question of head-and-shoulders confirm for monthly consolidation before all-time highs vs holding weekly EMAs; support 9972, resistance 11057.
- MAGS: new all-time highs 7116, 7125; macro rising wedge; weekly 12 EMA rider, daily 12 EMA rider.
- Microsoft: tightening range; break bull -> all-time highs; break bear -> monthly consolidation.
- Amazon: monthly consolidation underway; looking for higher low; testing 12 EMA.
- Apple: working back up to all-time highs; weekly 12 EMA guide.
- Google: still sideways; middle of range.
- Meta: battling key multi-top; gapped above marginally Friday then sold off; if bulls hold daily 12 EMA, cool off and go back; lose daily 12 EMA -> weekly consolidation.
- Tesla: still grinding near highs; take out 35405 to believe stairstep break bear; then weekly higher low; Tesla/QQQ ratio weekly 12 EMA intact for all 2026 below.
- SPCX: not quite daily uptrend; two-day uptrend guide; most important support 142.87; anticipate lower high and tightening range.
- XBI: bounce from weekly 12 EMA; potential rising wedge or head and shoulders; bears need take out two-week 12 EMA; lose weekly 12 EMA could offer right neckline buy within H&S off two-week 12 EMA.
- Crypto: no specific levels, probabilities, or triggers provided beyond question of whether move has juice left. -
Technical Levels & Setups OR Macro Drivers (📌):
- Weekly 12 EMA support on S&P 500 keeps bull case intact.
- If S&P 500 loses FOMC lows, monthly consolidation setup becomes primary risk.
- Rotation: weakness in XLF/XLV when semis/memory strengthen.
- Semiconductor/memory monthly higher lows in INTC, TSM, AMD as leadership signal.
- MU needs above double top with follow-through for confident monthly higher low.
- SNDK at resistance; break would set monthly higher low.
- SMH/QQQ ratio must clear lower highs to confirm semis leadership.
- XLF/SPY ratio monthly lower high and breakdown puts financial sector out of favor.
- XLV testing weekly 12 EMA; loss opens monthly consolidation.
- IGV holding weekly EMAs vs head-and-shoulders confirm; support 9972 and resistance 11057.
- MAGS macro rising wedge with weekly/daily 12 EMA riders; new all-time highs 7116/7125.
- Meta daily 12 EMA hold vs weekly consolidation if lost.
- Tesla 35405 takeout and Tesla/QQQ weekly 12 EMA as rotation signals.
- SPCX two-day uptrend guide with support 142.87.
- XBI weekly 12 EMA bounce vs two-week 12 EMA invalidation and potential H&S neckline.
- Crypto question of whether move has juice left, but no specific levels given. -
Risk/Reward Framework (⚖️):
- Entry: Not established by the available evidence.
- Stop: Not established by the available evidence.
- Targets: Not established by the available evidence.
- Risk/Reward: Not established by the available evidence.
- Position Size: Not established by the available evidence.
- Probability: Not established by the available evidence. -
Scenario Analysis (🔄):
| Scenario | Probability | Target | Trigger |
|---|---|---|---|
| Bull | Not established by the available evidence. | Not established by the available evidence. | S&P 500 weekly 12 EMA acts as support and weekly higher low forms; NASDAQ sets weekly higher low and weekly uptrend, making monthly bull flag possible. |
| Base | Not established by the available evidence. | Not established by the available evidence. | S&P 500 holds weekly 12 EMA but faces daily lower high resistance; NASDAQ remains range-bound after bear break no follow-through; rotation persists. |
| Bear | Not established by the available evidence. | Not established by the available evidence. | S&P 500 loses FOMC lows, red flag pointing toward monthly consolidation; XLF/XLV lose key EMAs or support. | -
Risk Factors (⚠️):
- S&P 500 losing FOMC lows invalidates bullish weekly higher low thesis and points to monthly consolidation.
- Semis/memory monthly higher lows need follow-through; MU and SNDK still at resistance.
- SMH/QQQ ratio rejecting lower highs could keep semis out of favor.
- XLF/SPY ratio monthly lower high broke down; financial sector weakness may continue.
- XLV losing weekly 12 EMA could trigger monthly consolidation and B-team fall out of favor.
- IGV head-and-shoulders confirmation could lead to monthly consolidation before all-time highs.
- Meta losing daily 12 EMA could lead to weekly consolidation.
- Tesla needs 35405 takeout; otherwise no weekly higher low and no sustainable rotation signal.
- Metals have breached 50% retrace and creator acknowledges unhealthy argument; need daily uptrend regain.
- XBI losing weekly 12 EMA could trigger right neckline within head and shoulders off two-week 12 EMA.
- Crypto has no concrete level, probability, or trigger in evidence; whether move has juice left remains unresolved.
- GDX weekly context is cut off in transcript.
- Geopolitical events can shift anything at any time.
- Oil ripping has not taken S&P 500 down, but that remains a cross-asset risk to monitor. -
Actionable Trading/Allocation Plan (🎯):
- Monitor S&P 500 weekly 12 EMA as support and FOMC lows as invalidation.
- Monitor NASDAQ daily uptrend regain and weekly higher low for weekly uptrend and monthly bull flag potential.
- Track semis/memory monthly higher lows: INTC, TSM, AMD, MU, SNDK; watch MU above double top and SNDK at resistance.
- Track XLF/SPY ratio monthly higher low after breakdown; XLF daily downtrend and 5762 level.
- Track XLV weekly 12 EMA; loss would signal monthly consolidation.
- Track IGV support 9972 and resistance 11057 for head-and-shoulders confirmation vs weekly EMA hold.
- Track MAGS all-time highs 7116/7125, rising wedge, and 12 EMA riders.
- Track Microsoft range break, Amazon monthly higher low, Meta daily 12 EMA, Tesla 35405 and Tesla/QQQ weekly 12 EMA.
- Track SPCX two-day uptrend and support 142.87.
- Track XBI weekly 12 EMA and two-week 12 EMA for potential H&S neckline.
- Track metals 50% retrace, daily uptrend regain, and weekly higher low.
- Verify crypto criteria: transcript asks if juice remains but provides no levels; monitor for creator follow-up levels.
- Note GDX weekly context missing due transcript cutoff.

-
Creator Horizon Category (⏱️): Long-Horizon Macro / Structural — Creator frames crypto/AI convergence as the most important macro inflection point and a change unlike any in history, spanning a 16-year buildout to the current September/October window.
-
One-Line Thesis (💡): Jordi Visser claims the week and month story is crypto, arguing AI-agent adoption and tokenization make September/October a critical inflection point and the most important macro trade, while stocks face multiple compression even if they grind higher.
-
Key Data Points (📊):
- Creator headline: 'The story of the week and the story for the month is crypto.'
- Creator claim: last May–June said by September–October would be the most important inflection point for crypto because of merging AI agents.
- Creator claim: AI and crypto are together; crypto does not exist without AI and was built for AI.
- Creator claim: 46-name crypto index made new highs for the year today; Bitcoin overlaid correlation remains basically one for one.
- Creator claim: 46-name index new highs puts Bitcoin up significantly from here, another 15% from here.
- Creator claim: some 46-name portfolio verticals 21% in a day, almost 100% for the month.
- Creator claim: 10% chance AI kills humanity; 100% chance crypto was built for AI.
- Creator claim: no another big bull market in stocks like Q1/first two quarters for AI; multiple compression is the old system.
- Creator claim: Fed chose to raise rates in a hawkish hike; only stock surge would come if they cut rates.
- Creator claim: stocks still get returns but bonds basically unchanged; long-short stocks may rally between now and end of first quarter but wouldn't bet heavy / not much return.
- Creator claim: liquidity + AI + blockchain perfect convergence; M2 does not matter anymore relative to tokenization and velocity of money.
- Creator claim: at that AI point, explosion in GDP, military edge, robots, science and technology, cognitive labor.
- Creator claim: analogies include China 2003–2013 ghost cities and dot-com buildout to iPhone 2007; about 16 years from internet to iPhone.
- Creator claim: crypto was never meant for human beings; $900 trillion wealthiest people, banks, institutions would not adopt it, but AI agents will.
- Creator claim: Anthropic researcher believes more than 10% chance AI could kill all humans; Anthropic warns AI agent swarms could seize the internet within a year.
- Creator claim: bearish forecasts include GPU prices falling and frontier model companies selling their brains to nobody; open source is not as good.
- Creator claim: Mag seven near all-time highs; demand greater than supply for a long time.
- Creator claim: oil soaring higher on Monday, 10-year rates get to 2007 levels for the first time, Fed hawkish hike.
- Creator claim: China is not buying Silicon Valley's call for an AI slowdown; oil prices went up.
- Creator claim: tokenization names include Zcash, Bit Tenzor, Near, Ethereum, Solana, Bitcoin; Micron is easy for people to understand. -
Technical Levels & Setups OR Macro Drivers (📌):
- AI-agent adoption as the first intended non-human user base for crypto; creator says agents are already starting to use it.
- Tokenization and stablecoins moving transactions on-chain because it will be cheaper, with gradual explosion in velocity of money.
- Automated AI researcher milestone as catalyst for GDP, cognitive labor, robots, science and technology.
- Liquidity + AI + blockchain convergence; creator says M2 is less relevant relative to tokenization and velocity.
- Software vs semis rotation: Monday cyber gapping up, semis down, 10% biggest software-vs-semis outperformance per creator.
- Stocks: multiple compression despite earnings growth; Fed hawkish hike; possible rally into end of first quarter but limited return per creator.
- Crypto assets: ETH, BTC, SOL as layer ones; 46-name index new highs; Bitcoin another 15% from here per creator.
- AI infrastructure demand greater than supply; Mag seven near all-time highs; recursive self-improvement evident in faster model releases and safety concerns. -
Risk/Reward Framework (⚖️):
- Entry: Not established by the available evidence.
- Stop: Not established by the available evidence.
- Targets: Bitcoin: another 15% from here (creator claim).
- Risk/Reward: Not established by the available evidence.
- Position Size: Not established by the available evidence.
- Probability: Not established by the available evidence. -
Scenario Analysis (🔄):
| Scenario | Probability | Target | Trigger |
|---|---|---|---|
| Bull | Not established by the available evidence. | Bitcoin: another 15% from here (creator claim). | 46-name crypto index makes new highs for the year; Bitcoin correlation remains one-for-one; AI agents/tokenization adopt; stocks rally between now and end of first quarter. |
| Base | Not established by the available evidence. | Not established by the available evidence. | Stocks deliver returns but multiple compression limits upside; crypto leadership continues while market otherwise quiet; liquidity + AI + blockchain convergence gradually plays out. |
| Bear | Not established by the available evidence. | Not established by the available evidence. | AI slowdown/safety fears gain traction, oil/rates shock persists with 10-year rates at 2007 levels and Fed hawkish hike, GPU price declines or data-center geopolitical backlash. | -
Risk Factors (⚠️):
- Verification gap: creator does not present entry, stop, position size, ratio, or trade probability; explicit trade parameters are absent.
- Verification gap: 46-name portfolio names are not shown in evidence; only verticals and performance figures are disclosed.
- Analyst risk: creator's timing depends on AI-agent/tokenization adoption and may be delayed by AI slowdown calls, safety/regulatory headlines, or geopolitical data-center backlash.
- Creator-cited bearish possibility: GPU prices fall, frontier labs sell brains to nobody, open source improves; creator dismisses but acknowledges may change over time.
- Market risk: creator says no big stock bull market like first two quarters; multiple compression and rate/oil shocks could persist.
- Evidence cut off mid-sentence at 'As I've talked ab...' so the full week recap and final points are incomplete.
- Ticker/name accuracy risk: transcript includes phonetic or misspelled names such as 'Bit Tenzor', 'Daario', 'Leopold Ashen Brener', and 'Jim Chenos', requiring source verification. -
Actionable Trading/Allocation Plan (🎯):
- Track creator's 46-name crypto index for new highs and Bitcoin correlation/another-15% claim.
- Compare QTD performance of ETH, BTC, SOL versus S&P, NASDAQ, and semis to test leadership rotation claim.
- Monitor AI-agent, tokenization, and stablecoin adoption plus on-chain velocity as thesis triggers.
- Monitor automated AI researcher milestone and Aschenbrenner Situational Awareness framing.
- Monitor Fed rate path, 10-year yield at 2007 levels, oil prices, and software-vs-semis relative performance.
- Verify named instruments/tickers: Bitcoin, Ethereum, Solana, Zcash, Near, Bit Tenzor/Bittensor, Micron, Mag seven.
- Check Anthropic/OpenAI safety and regulatory headlines and view-count hype claims for sentiment risk.
- Await creator's subscriber crypto video and details on 10 verticals and names behind paywall.

-
Creator Horizon Category (⏱️): Other — Transcript consists of live product-demo banter about an AI/robotic coffee machine and office purchase interest, with no market horizon stated.
-
One-Line Thesis (💡): The creator frames an AI/robotic coffee machine as 'the future,' questions whether it is AI and American AI, and discusses office purchase affordability, but provides no financial thesis, ticker, level, valuation, date, or risk parameter.
-
Key Data Points (📊):
- This is the future — creator's framing of the AI/robotic coffee machine demonstration.
- Is it AI though? — creator questions whether the device is actually AI.
- Is it American AI? — creator questions whether the AI is American.
- How much is one of these? — pricing question, with no figure given.
- If you have to ask, you can't afford it — speaker's affordability quip.
- Should we get one for the office? — office purchase consideration.
- I typed in the LLM — speaker references inputting an order into an LLM.
- It's handing it to you — device observed handing an item to the user.
- taste test — speakers conduct a taste test.
- Mhm — ambiguous reaction to the taste test. -
Technical Levels & Setups OR Macro Drivers (📌):
- AI/robotic product demonstration framed as 'the future.'
- Uncertainty over whether the device qualifies as AI.
- National-origin question about whether the AI is American.
- Office purchase interest and affordability banter.
- Reference to ordering via an LLM. -
Risk/Reward Framework (⚖️):
- Entry: Not established by the available evidence.
- Stop: Not established by the available evidence.
- Targets: Not established by the available evidence.
- Risk/Reward: Not established by the available evidence.
- Position Size: Not established by the available evidence.
- Probability: Not established by the available evidence. -
Scenario Analysis (🔄):
| Scenario | Probability | Target | Trigger |
|---|---|---|---|
| Bull | Not established by the available evidence. | Not established by the available evidence. | Device works as demonstrated ('It's handing it to you') and is confirmed to be AI or 'American AI' if that question is resolved. |
| Base | Not established by the available evidence. | Not established by the available evidence. | Office purchase discussion proceeds after the unanswered price question ('How much is one of these?'). |
| Bear | Not established by the available evidence. | Not established by the available evidence. | Affordability quip 'If you have to ask, you can't afford it' implies cost may be prohibitive, with no price disclosed. | -
Risk Factors (⚠️):
- No financial claims, tickers, valuations, levels, dates, or portfolio implications are present in the evidence.
- No price figure is disclosed despite the pricing question.
- The AI and American AI questions are raised but not answered in the transcript.
- The taste-test result is ambiguous ('Mhm') and not substantiated.
- The transcript is fragmentary casual demo banter, not investment research. -
Actionable Trading/Allocation Plan (🎯):
- Verify whether the video identifies any ticker or company; the transcript contains none.
- Verify product price and AI sourcing if later disclosed by the creator.
- Monitor for follow-up on the office purchase discussion or a fuller product review.
- Treat any market implication as unsupported by this evidence unless additional sourced material is provided.
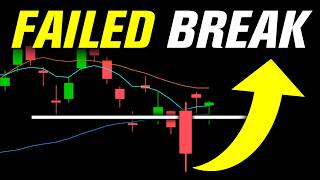
-
Creator Horizon Category (⏱️): Short-Term Technical — The creator analyzes SPY weekly, daily, and hourly chart levels plus next-week triggers around FOMC, quad-witching, PPI, and range boundaries.
-
One-Line Thesis (💡): Trade Brigade's Matt asks whether the market bottomed and can return to all-time highs, concluding the weekly SPY hammer shows buyers in control but the daily trend remains down until a break above roughly 76367s confirms the next weekly uptrend leg.
-
Key Data Points (📊):
- SPY weekly candle: green-bodied hammer, third weekly hammer in a row, close at highs of overall range — creator says structurally buyers are in control.
- SPY weekly bar-to-bar: still a lower high and lower low, but closed back inside previous week's range — creator calls location more neutral.
- Creator claim: sellers cannot gain traction underneath a previous week range low; each prior week low was broken then market closed back inside range.
- Trigger: break above roughly 76367s, this week's high, would be first previous week range high break since the all-time high and could start weekly trend resuming upward.
- Weekly expected move: upper bound 77156 implies a higher high versus last week's high; lower bound 75182 is a slightly higher low versus the FOMC low but below key inflection.
- Key inflection point: 76025 — previous left side peak, gap level, bottom end of balance range, and 50 SMA.
- Daily trend: creator says cannot call uptrend yet because highs are lower highs and lows are lower lows.
- Post-FOMC action: Thursday gapped up over 76025; Friday quad-witching hammered at the level, tested lower, and closed at daily highs.
- Potential pattern: quasi inverted head and shoulders / 'mosquito pattern'; range midpoint cited at 76785; continuation move back to all-time highs is described as wishful thinking unless supported.
- Bear path: loss of 76025, lower high under 75665 (PPI gap down low), rotation back to equal lows, downtrend remains.
- Hourly level: 76325; consolidation above it could allow a daily higher low and continuation higher.
- Hourly bear setup: look above and fail at level, lose 76025, consolidate underneath, retest FOMC low; loss of Tuesday/PPI low 75665 — creator says not game over but does not look good.
- Friday low: 75875 — creator says failure there from OPEX/quad-witching would be an early negative indication.
- Fibonacci from last major lower high to FOMC low: Friday low is 38.2; 61.8 is 76464; no closes above 61.8 since FOMC low; more closes above 61.8 raise likelihood of 100% retracement.
- NYSE internals: Friday volume flows net out at exchange level; advance-decline line not technically over zero; cumulative build lackluster — creator says not everything firing.
- Market profile: value never shifted lower on FOMC; value higher Thursday and overlapping up Friday; Tuesday/PPI low is key retracement watch.
- NASDAQ/Q's: at range high; anchored VWAPs show still underneath some stack; FOMC and PPI gap-down anchored VWAP confluence near 76025.
- Creator teases six additional trade ideas later in the show; those specific ideas are not established in the available evidence. -
Technical Levels & Setups OR Macro Drivers (📌):
- Weekly SPY hammer sequence and repeated reclaims of prior week range lows suggest seller exhaustion to creator.
- Break above roughly 76367s would confirm weekly range-high break and potential resumption of upward weekly trend.
- Daily trend remains down with lower highs/lower lows; recovery is not yet a confirmed uptrend.
- 76025 is the central pivot: previous left-side peak, gap level, balance-range bottom, and 50 SMA; Thursday gap up and Friday hold are constructive.
- Potential inverted head-and-shoulders requires a new hourly higher high over Monday high to flip hourly trend up.
- Anchored VWAPs: previous all-time-high anchored VWAP acting as support; breakout-bar anchored VWAP reclaim if last week's high breaks; FOMC/PPI anchored VWAP confluence near 76025.
- Fibonacci confluence: 75875 Friday low aligns with 38.2; 76464 is 61.8; market has not closed above 61.8 since FOMC low.
- Friday internals were weak/net out, but creator gives benefit of doubt due to OPEX/quad-witching and prefers Monday's reading as arbiter.
- Market profile shows value not shifting lower on FOMC and moving higher/overlapping up afterward.
- Nasdaq/Q's at range high may see some pushback; anchored VWAP work still shows resistance overhead. -
Risk/Reward Framework (⚖️):
- Entry: Not established by the available evidence.
- Stop: Not established by the available evidence.
- Targets: All-time highs (numeric level not established by the available evidence); 76785 (midpoint of range); 77156 (weekly expected move upper bound)
- Risk/Reward: Not established by the available evidence.
- Position Size: Not established by the available evidence.
- Probability: Not established by the available evidence. -
Scenario Analysis (🔄):
| Scenario | Probability | Target | Trigger |
|---|---|---|---|
| Bull | Not established by the available evidence. | All-time highs / 76785 range midpoint / 77156 weekly expected move upper bound | Take out roughly 76367s this week's high; new hourly higher high over Monday high; reclaim 76025/76325 and 76464 fib 61.8; hold over Friday low 75875. |
| Base | Not established by the available evidence. | Chop/slop; no specific target established by the available evidence. | Stay over Friday low 75875/fib 38.2 but no closes above 76464 fib 61.8; contained within weekly expected move 75182 to 77156. |
| Bear | Not established by the available evidence. | Retest FOMC low; loss of PPI low 75665; rotation back to equal lows | Fail above 76025 and lose it, or lose Friday low 75875, or produce a lower high under 75665. | -
Risk Factors (⚠️):
- Daily trend is still objectively down with lower highs and lower lows; recovery has not changed it.
- Break above roughly 76367s is unconfirmed and would be the first prior-week range high break since the all-time high.
- Friday NYSE internals were weak: volume flows net out, advance-decline not over zero, cumulative build lackluster.
- Quad-witching/OPEX may distort Friday flow readings; Monday is presented as a more solid arbiter.
- Loss of 76025 would invalidate the constructive inflection-point hold and invite sell-side pressure.
- Loss of Friday low 75875 is cited as an early bearish indication.
- Loss of PPI low 75665 would raise the bearish scenario and rotation back to equal lows.
- Weekly expected move lower bound 75182 would put price back below the 76025 key inflection point.
- No closes above fib 61.8 at 76464 since the FOMC low, so upside retracement remains unconfirmed.
- Creator cautions not to get overly positive at range high resistance without confirmation. -
Actionable Trading/Allocation Plan (🎯):
- Monitor whether SPY takes out roughly 76367s this week's high, which creator says would be the first prior-week range high break since the all-time high.
- Track acceptance or rejection at 76025, the key inflection point described as previous left side peak, gap level, balance-range bottom, and 50 SMA.
- Watch Friday low 75875 and fib 38.2 as an early support/failure level.
- Watch PPI gap-down low 75665; creator says losing it does not look good for the constructive setup.
- Monitor for a new hourly higher high over the Monday high to flip the hourly trend up.
- Monitor reclaim of 76464 fib 61.8, which creator says would increase odds of 100% retracement.
- Compare Monday internals with Friday quad-witching-skewed readings, especially volume flows and advance-decline.
- Track weekly expected move bounds 77156 upper and 75182 lower for containment context.
- Monitor NASDAQ/Q's at range high and anchored VWAP confluence near 76025/76325.
- Verify whether market profile value continues shifting higher or overlaps up after FOMC.
-
Creator Horizon Category (⏱️): Long-Horizon Macro / Structural — The talk centers on multi-decade institutional failure, regulatory capture, and prevention frameworks rather than near-term trading catalysts.
-
One-Line Thesis (💡): Bill Gurley claims that catastrophes such as Surfside, 737 Max, Katrina, Fukushima, and Challenger combine technical failures with institutional failures, and that preventing recurrence requires independent searchers plus CAPA root-cause/prevention processes while blockers and regulatory capture obstruct.
-
Key Data Points (📊):
- Bill Gurley/All-In Podcast — speaker says he will not talk about AI; topic is catastrophes/failure analysis and human/institutional response.
- Surfside Champlain Towers, June 2021 — 98 died; design errors from beginning, poor maintenance schedule, condo board ignored inspection report.
- Surfside investigations — New York Times 3D investigation; four other parallel investigations; NIST assigned after 9/11 to building collapse; Matheny Reimann and Bell spent five years; Alan Kilshimer hired by Surfside; Judge Randal grand jury; 17 victim lawsuits under single class; Miami Herald staffed up to 37 people and won Pulitzer.
- 737 Max — two crashes October 2018 and March 2019; Airbus fuel-efficient plane took share; Boeing attached fuel-efficient engine to old 737; engine too big moved forward; secret MCAS software; Ethiopian Airways sensor malfunction; 45 days after first crash almost everyone knew MCAS at fault and no one grounded plane; Boeing/FAA blockers; Ted Cruz accused FAA head of being captured.
- 737 Max searchers — US Senate commission, House commission, DOJ; KNKT Indonesian agency inspected black boxes; Dominic Gates Seattle Times 16 years, Pulitzer; Peter Robison book Flying Blind; 57 whistleblowers to Senate; victims' families; pilot union recorded Boeing and FOIA requests.
- CAPA — five steps: detect, investigate, confirm root cause, correct, prevent; required by FDA for pharmaceuticals/medical devices and by aerospace regulations.
- Hurricane Katrina, 2005 — 1,800 deaths, 400,000 displaced, $125B damage; Category 3; levees gave way from underneath; House and Senate commissions; Mark Schleifstein and John McQuaid series three years earlier, two Pulitzers; NSF bake-off; LSU team; ASCE paid $1M and became blockers; Raymond Seed 42-page report; 90 recommendations; $15B seawalls held 20 years.
- Challenger — January 1986; O-rings on solid rocket boosters not designed for cold; subcontractor objected night before launch and was shut down; Rogers Commission added mostly insiders; Richard Feynman Caltech professor; transcript cuts off before conclusion.
- No tickers, price levels, valuations, entry/stop/target, position sizing, or portfolio implications are stated in the provided evidence. -
Technical Levels & Setups OR Macro Drivers (📌):
- Technical failure plus institutional failure pattern across Surfside, 737 Max, Katrina, Fukushima, Challenger.
- Regulatory capture as recurring blocker: Boeing/FAA accused by Senator Ted Cruz; TEPCO/NISA almost friends; regulatory capture phrase from Gurley's earlier talk.
- Blockers circle wagons under spotlight: Boeing accused pilots; FAA refused Senate document requests; Army Corps/ASCE blocked; TEPCO/NISA blocked.
- Searchers and independent investigations: press, whistleblowers, victims' families, unions, FOIA, grand jury, NIST, KNKT, DOJ, bipartisan congressional committees.
- CAPA root-cause/prevention process required in FDA and aerospace; root cause cannot be skipped.
- Prevention examples: Florida condo rules and coastal states; Katrina 90 recommendations and $15B seawalls held 20 years.
- Independent commission design: Kurokawa Fukushima committee had no institutional connection to regulator/power company and full authority.
- Bipartisan response in 737 Max: DeFazio House, Ted Cruz and Wicker Senate; no partisanship. -
Risk/Reward Framework (⚖️):
- Entry: Not established by the available evidence.
- Stop: Not established by the available evidence.
- Targets: Not established by the available evidence.
- Risk/Reward: Not established by the available evidence.
- Position Size: Not established by the available evidence.
- Probability: Not established by the available evidence. -
Scenario Analysis (🔄):
| Scenario | Probability | Target | Trigger |
|---|---|---|---|
| Bull | Not established by the available evidence. | Not established by the available evidence. | Prevention follows root-cause findings: Florida condominium rules adopted by multiple states and coastal states; Katrina 90 recommendations implemented and $15B seawalls held 20 years. |
| Base | Not established by the available evidence. | Not established by the available evidence. | Multiple searchers and blockers interact; investigations sometimes run into each other, sometimes help, all trying to determine failure cause. |
| Bear | Not established by the available evidence. | Not established by the available evidence. | Blockers/regulatory capture prevent root cause or grounding: 45 days after first 737 Max crash almost everyone knew MCAS was at fault and no one grounded the plane before second crash. | -
Risk Factors (⚠️):
- Evidence is partial transcript; Challenger section cut before conclusion; later claims and any investable conclusions unverified.
- No tickers, price levels, valuation, catalysts, or portfolio implications in evidence; market mapping would be unsupported.
- Gurley's institutional-failure/regulatory-capture assertions require independent verification against primary documents, court records, and official reports.
- Prevention outcomes are jurisdiction-specific; evidence cites Florida and multiple coastal states, not universal adoption.
- Regulatory capture and blocker claims may be contested by named agencies/companies; transcript only summarizes. -
Actionable Trading/Allocation Plan (🎯):
- Verify Surfside findings via NIST, Miami Herald/New York Times investigations, court records, and Florida condominium rule changes.
- Verify 737 Max claims via KNKT, Senate/House committees, DOJ, Seattle Times Dominic Gates reporting, whistleblower letters, and FAA/Boeing documents.
- Verify Katrina claims via House/Senate commissions, NSF/LSU reports, Raymond Seed 42-page report, and status of 90 recommendations and $15B seawalls.
- Verify Fukushima claims via Kurokawa commission report, TEPCO/NISA documents, and English-first publication statement.
- Verify CAPA requirements and adoption in FDA/aerospace regulatory frameworks.
- Monitor whether any named speaker or channel later provides tickers, valuations, entry/stop/target, or portfolio implications; none are in this evidence.

-
Creator Horizon Category (⏱️): Short-Term Technical — Creator centers the note on a $7 trillion expiration, same-day arbitrage/7-hours-to-nowhere behavior, and expected bigger moves after expiration into Tuesday/Wednesday next week.
-
One-Line Thesis (💡): On the cited $7 trillion options-expiration day after a Bank of Japan hike and recent Fed, markets are absorbing it without crazy reactions while Nvidia's sales-doubling headline, Netflix's extreme downgrade, Nike/N and Mbappe, Micron/SK Highix, Boeing/FAA, Alibaba/China meeting next week, PCE, and a chip/memory/crypto bid versus software/cyber/staples/financials/healthcare weakness are highlighted.
-
Key Data Points (📊):
- $7 trillion of expiration/value expires today — creator's central options-expiration figure.
- Bank of Japan hike and Fed the other day — creator says people are absorbing them extremely well with no crazy reactions.
- Moves expected after expiration, maybe Tuesday/Wednesday next week — creator says he believes bigger moves come after expiration.
- Morning arbitrage expected on expiration day; after first hour short-term premiums decline — creator's intraday setup.
- '7 hours to nowhere' possible — creator's phrase for choppy expiration-session behavior.
- Nvidia doubling of sales headline yesterday — creator says everybody wanted to talk about it today.
- Netflix down on extreme downgrade — creator says price target lowered by like 50% or something; later says price target 50% below TSM.
- Nike and N all because of Mbappe — creator's individual-move example.
- Cyber rumors last night — creator mentions without confirming.
- Watch Micron, SK Highix, O, Nike, COO, Netflix, Baba, Boeing — creator's watchlist.
- Boeing had something with the FAA this morning — creator's catalyst.
- Baba/China meeting next week — creator's catalyst; Alibaba up three.
- PCE next week or end of month likely most volatility — creator's macro catalyst.
- Chips were doing very good in memory then faded; later chips up by 6 — creator's rotation observation.
- IGV down one, cyber down one almost — creator's software/cyber weakness.
- SPY up by 0.04, Russell down 04, NASDAQ up by .3, Dow Jones down by a quarter — creator's index levels.
- SPY right at open; yesterday had way bigger individual moves — creator's tape comparison.
- MSTR up seven and Bitcoin up four; crypto better than chips — creator's crypto strength claim.
- Google up three and Google doing very good; Amazon, Apple, Nvidia, Microsoft part of Mag 7 — creator's mega-cap observation.
- Broadcom off to rip; Broadcom 'make free at 100'; contract above it going for less; 'I take it' — creator's Broadcom options trade claim.
- Meta gave up all gain / rug pulled off open — creator's failed setup.
- Philip Morris raised dividend — creator's staples catalyst.
- Oil below 100 — creator notes input/rate-sensitive context.
- French 5-year CDS surges 41 basis points, highest since liberation day — creator cites France risk.
- Dollar is up/back into momentum zone; dollar up has killed momentum this year — creator's macro risk.
- Yen/rate hike a big factor — creator's macro driver.
- Biotech unnecessarily way too strong yesterday; IBB right at break even; XLV up — creator's healthcare/biotech observation.
- Staples down, financials down, healthcare gave it up; staples big winners/losers — creator's sector rotation.
- Good debt, don't need high rates, love high rates; vulnerable input cost/energy/oil staples hit — creator's staples framework.
- Photonics plays getting bid; creator did not go too crazy; all very very small — creator's position-size commentary.
- SanDisk insane; SanDisk doing better than Micron; DRAM catching bid — creator's memory subtheme.
- Watch Korea — creator's memory/DRAM geographic cue.
- CoreWeave, Robin Hood, Intel, ARM, SMCI down again; Broadcom/Dell vibes — creator's tickers.
- HubSpot analyst item off open; it didn't move — creator's failed reaction.
- Airbnb/travel, Oracle, eBay, Coinbase, Circle, HP, CRM, Workday, Walmart, AAT, WMB, IBM — creator mentions across tape.
- Jana Partners advocating stuff at Netflix — creator mentions as part of Netflix/company news.
- Other ones made for yesterday are down 40 — creator's trade-performance claim.
- Not a recommendation. You will lose money. — creator disclaimer.
- October coming; post-expiration mid-next-week more activity — creator's timing. -
Technical Levels & Setups OR Macro Drivers (📌):
- $7 trillion options expiration is treated as the dominant same-day mechanical driver, with creator expecting compression/arbitrage and then larger moves after expiration.
- Bank of Japan hike plus recent Fed are cited as macro inputs that markets are absorbing without crazy reactions, but yen and dollar remain key watch items.
- Nvidia sales-doubling headline is described as a delayed-reaction catalyst for chip/memory names.
- Netflix extreme downgrade with price target lowered by about 50% or 50% below TSM is treated as an idiosyncratic downside driver.
- Boeing/FAA news, Alibaba/China meeting next week, PCE next week or end of month, and Philip Morris dividend increase are listed catalysts.
- Rotation setup: chips/memory/DRAM, Broadcom, Google, crypto/MSTR/Bitcoin show strength while software, cyber, staples, financials, and healthcare give it up.
- Staples framework: companies with good debt that do not need high rates may love high rates; those vulnerable to input cost/energy/oil may be hit.
- Photonics plays are watched but creator says exposure was all very very small. -
Risk/Reward Framework (⚖️):
- Entry: Not established by the available evidence.
- Stop: Not established by the available evidence.
- Targets: Not established by the available evidence.
- Risk/Reward: Not established by the available evidence.
- Position Size: Not established by the available evidence.
- Probability: Not established by the available evidence. -
Scenario Analysis (🔄):
| Scenario | Probability | Target | Trigger |
|---|---|---|---|
| Bull | Not established by the available evidence. | Not established by the available evidence. | Creator's 'after expiration ... bigger moves' expectation plus observed chips up by 6, memory/DRAM strength, Broadcom rip, Google up three, MSTR up seven, and Bitcoin up four; verify follow-through Tuesday/Wednesday next week. |
| Base | Not established by the available evidence. | Not established by the available evidence. | Creator's '7 hours to nowhere' / morning arbitrage / SPY right at open with individual moves but no sustained index trend; verify expiration pinning and first-hour short-term premium decay. |
| Bear | Not established by the available evidence. | Not established by the available evidence. | Creator's dollar-up-kills-momentum risk plus software/cyber/staples/financials/healthcare weakness and French 5-year CDS/yen/BOJ rate-hike macro stress; verify if dollar stays in momentum zone and post-expiration moves resolve lower. | -
Risk Factors (⚠️):
- Options expiration may pin or distort same-day price action, delaying the creator's expected post-expiration moves.
- Creator gives no defined entry, stop, target, risk/reward ratio, probability, or numeric position size for the discussed setups.
- Creator explicitly says: 'Not a recommendation. You will lose money.'
- Dollar up is cited as having killed momentum this year, which could invalidate bullish rotation setups.
- Netflix downgrade severity and Nvidia sales-doubling headline require verification; creator notes hype versus material impact uncertainty.
- Ticker ambiguities in transcript, including 'N', 'O', 'COO', 'WMB', 'AAT', 'Cheek/Vitus', and similar shorthand, create verification risk.
- French 5-year CDS surge of 41 basis points and yen/BOJ rate-hike context are unresolved macro risks.
- Sector rotation is unstable in the transcript: chips fade, Meta gives up gains, staples/financials/healthcare give it up, and cyber/software remain weak. -
Actionable Trading/Allocation Plan (🎯):
- Verify the $7 trillion expiration figure against options-expiry data for the cited expiration day and track post-expiration behavior into Tuesday/Wednesday next week.
- Confirm the Bank of Japan hike, recent Fed action, and market reaction via official central-bank statements and rate-market pricing.
- Verify the Nvidia sales-doubling headline and whether it is new information or a delayed reaction.
- Confirm Netflix downgrade details, including whether the price target was lowered by about 50% or set 50% below TSM.
- Check Boeing/FAA news, Alibaba/China meeting next week, Philip Morris dividend increase, and PCE release timing.
- Track dollar/yen and French 5-year CDS as macro stress indicators cited by creator.
- Monitor chip/memory/DRAM complex: Micron, SK Highix, SanDisk, WDC, Broadcom, Intel, AMD, TSM, Nvidia, and Korea cues.
- Monitor software/cyber versus chips: IGV, cyber names, and creator's claim that chips are almost a direct inverse to software/cyber.
- Monitor crypto-linked equities and assets: MSTR, Bitcoin, Coinbase, Circle, and creator's claim that crypto is doing better than chips.
- Monitor Mag 7 leaders cited: Google, Amazon, Apple, Meta, Microsoft, Nvidia.
- Monitor staples/financials/healthcare/XLV, oil below 100, and creator's staples debt/input-cost framework.
- Track photonics plays qualitatively but note creator said exposure was all very very small and did not go too crazy.
- Verify the creator's 'other ones made for yesterday are down 40' claim with a timestamped trade record if available.
-
Creator Horizon Category (⏱️): Long-Horizon Macro / Structural — Creator frames consumer discretionary through the capital cycle and changing sector classifications rather than a short-term technical setup.
-
One-Line Thesis (💡): Creator claims consumer discretionary is cyclical and the smart approach is to follow the capital cycle, while shifting consumer discretionary spending—such as iPhone spending now categorized in tech—changes how companies are classified.
-
Key Data Points (📊):
- Creator claim: consumer discretionary is cyclical — the stated problem with the sector.
- Creator claim: smart thing to do with consumer discretionary is follow the capital cycle.
- Creator framework: define a stock as industrial, technology, consumer company, staple, or whatever it is not anything that is consumer discretionary.
- Creator claim: un-categorized companies are changing because consumer discretionary spending has changed.
- Creator example: now it is like iPhone spending, and that is in tech.
- Tickers: none stated in evidence — no ticker symbols appear.
- Levels/valuations/dates/probabilities: none stated in evidence. -
Technical Levels & Setups OR Macro Drivers (📌):
- Creator says the capital cycle framework applies to consumer discretionary.
- Creator says sector classification drifts as consumer discretionary spending changes.
- Creator example: iPhone spending sits in tech rather than consumer discretionary.
- Creator says un-categorized companies are changing. -
Risk/Reward Framework (⚖️):
- Entry: Not established by the available evidence.
- Stop: Not established by the available evidence.
- Targets: Not established by the available evidence.
- Risk/Reward: Not established by the available evidence.
- Position Size: Not established by the available evidence.
- Probability: Not established by the available evidence. -
Scenario Analysis (🔄):
| Scenario | Probability | Target | Trigger |
|---|---|---|---|
| Bull | Not established by the available evidence. | Not established by the available evidence. | Verification condition: continued shift of consumer discretionary spending into categories such as tech, as creator cites iPhone spending being in tech. |
| Base | Not established by the available evidence. | Not established by the available evidence. | Creator's stated approach: follow the capital cycle for consumer discretionary. |
| Bear | Not established by the available evidence. | Not established by the available evidence. | Creator's stated problem: consumer discretionary remains cyclical. | -
Risk Factors (⚠️):
- No specific tickers, levels, valuations, dates, position sizes, or probabilities are provided to verify the thesis.
- The creator's classification framework is qualitative and does not define which un-categorized companies are changing.
- Capital cycle efficacy for consumer discretionary is asserted but not evidenced with data.
- No time horizon or market context is established for the claimed sector shift. -
Actionable Trading/Allocation Plan (🎯):
- Monitor changes in consumer discretionary spending and sector classification, particularly examples like iPhone spending being counted in tech.
- Verify which companies the creator would place in industrial, technology, consumer, staple, or un-categorized buckets.
- Track capital cycle indicators for consumer discretionary to test the creator's stated framework.
- Request tickers, levels, valuations, horizons, and position-sizing parameters if the creator provides them elsewhere.
-
Creator Horizon Category (⏱️): Long-Horizon Macro — Discussion centers on mortgage rates, 10-year Treasury, inflation, and stock-market performance on the year as a macro backdrop, not a specific short-term technical setup.
-
One-Line Thesis (💡): The speaker says mortgage rates (6% to 7%), the 10-year (4% to 5%), and inflation ('2 and 12%' to 3 and a half%) form a bad macro backdrop while the stock market is up 13% on the year, and warns financial professionals may over-trust the stock market telling you it's okay even though it has been a good predictor recently and will eventually get it wrong.
-
Key Data Points (📊):
- Mortgage rates this year have gone from 6% to 7% — speaker-stated macro move.
- The 10 years has gone from 4% to 5% — speaker-stated macro move.
- Inflation has gone from '2 and 12%' to 3 and a half% — speaker-stated macro move; transcript figure is ambiguous.
- Stock market's up 13% on the year — speaker-stated equity performance.
- Speaker says the macro backdrop prompts 'Oh my gosh, that that is not good.'
- Speaker says the stock market has been a pretty good predictor and hasn't seeded us wrong recently.
- Speaker says at some point, obviously, it'll get it wrong.
- Speaker warns there is too much trust from financial professionals in the stock market telling you it's okay. -
Technical Levels & Setups OR Macro Drivers (📌):
- Adverse macro backdrop: mortgage rates 6% to 7%, 10-year 4% to 5%, inflation '2 and 12%' to 3 and a half%.
- Equity-market counter-signal: stock market up 13% on the year despite bad macro backdrop.
- Recent predictive success: speaker says stock market has been a pretty good predictor and hasn't seeded us wrong recently.
- Behavioral setup: financial professionals may over-trust the stock market telling you it's okay. -
Risk/Reward Framework (⚖️):
- Entry: Not established by the available evidence.
- Stop: Not established by the available evidence.
- Targets: Not established by the available evidence.
- Risk/Reward: Not established by the available evidence.
- Position Size: Not established by the available evidence.
- Probability: Not established by the available evidence. -
Scenario Analysis (🔄):
| Scenario | Probability | Target | Trigger |
|---|---|---|---|
| Bull | Not established by the available evidence. | Not established by the available evidence. | Speaker says the stock market has been a pretty good predictor and hasn't seeded us wrong recently, with market up 13% on the year. |
| Base | Not established by the available evidence. | Not established by the available evidence. | Speaker notes bad macro backdrop but stock market up 13% on the year and says 'things are fine.' |
| Bear | Not established by the available evidence. | Not established by the available evidence. | Speaker says at some point, obviously, it'll get it wrong. | -
Risk Factors (⚠️):
- Speaker-flagged risk: stock market eventually gets it wrong, so relying on recent predictive success may invalidate the okay signal.
- Macro deterioration: rising mortgage rates, 10-year yield, and inflation may pressure the backdrop; transcript gives no threshold, timing, or transmission mechanism.
- Over-trust risk: financial professionals telling clients the market is okay may be a blind spot per speaker.
- Verification gap: inflation figure '2 and 12%' is ambiguous and needs source-audio check.
- Evidence gap: no tickers, valuation, catalysts, entry, stop, target, position size, or portfolio implications are established. -
Actionable Trading/Allocation Plan (🎯):
- Verify the exact mortgage-rate series and period behind the 6% to 7% claim.
- Verify the 10-year Treasury 4% to 5% move and the index/period behind the 13% on-the-year stock-market claim.
- Clarify the transcript's inflation figure '2 and 12%' against the source video or audio.
- Monitor whether the stock market continues to validate or contradict the macro backdrop over the speaker's unspecified horizon.
- Check the full video for omitted tickers, valuation, positioning, catalysts, or portfolio implications.
-
Creator Horizon Category (⏱️): Long-Horizon Macro — Dan frames a 'multi-year tech bull market' and data-center buildout over 'the next five six years', while Tom discusses broad US economy multiple expansion.
-
One-Line Thesis (💡): Dan claims memory stocks and Micron are front and center in contracting valuations but that this is still a young multi-year tech bull market led by tech spending and data-center construction; Tom adds that low PE with rising earnings is not a top unless it is a 'true deep cyclical' and argues the low-volatility US economy supports higher multiples.
-
Key Data Points (📊):
- Dan: 'memory stocks are kind of front and center' — sector focus.
- Dan: Micron named — memory-stock example.
- Dan: 'bull market's young' and 'multi-year tech bull market ahead of us' — market-regime claim.
- Dan: '12 to500 data centers' to be built in 'the next five six years' — literal pipeline figure.
- Dan: even if '10% 15%' get voted down, innovation boom is just starting — political/politicization risk assumption.
- Dan: 'white knuckle moments like this weekend or circular financing or whatever it may be, macro issues, oil' — pullback catalysts/risks.
- Tom: 'you're never at a top when people want PE to be low and earnings are going up unless it's a true deep cyclical' — top condition.
- Tom: US economy is 'the opposite of a deep cyclical sector' and 'low volatility economy now', so 'the multiple should be going up a lot' — multiple-expansion claim.
- Unidentified speaker: contracting valuations because people say 'too hot, too good to be true. No way this can continue.' — valuation skepticism. -
Technical Levels & Setups OR Macro Drivers (📌):
- Tech spending and innovation boom leading the market higher.
- Data-center construction pipeline of '12 to500' over 'next five six years'.
- Memory stocks and Micron as front-and-center valuation battleground.
- Low PE plus rising earnings, unless the market is a 'true deep cyclical'.
- US low-volatility economy, not a deep cyclical, supports multiple expansion.
- Quarter-by-quarter earnings proof for memory companies.
- White-knuckle moments, circular financing, macro, and oil framed as transient risks. -
Risk/Reward Framework (⚖️):
- Entry: Not established by the available evidence.
- Stop: Not established by the available evidence.
- Targets: Not established by the available evidence.
- Risk/Reward: Not established by the available evidence.
- Position Size: Not established by the available evidence.
- Probability: Not established by the available evidence. -
Scenario Analysis (🔄):
| Scenario | Probability | Target | Trigger |
|---|---|---|---|
| Bull | Not established by the available evidence. | Not established by the available evidence. | Dan's evidence: tech leads market higher due to spending, '12 to500 data centers' over 'next five six years', innovation boom; Tom's low-PE-with-rising-earnings and low-volatility multiple expansion. |
| Base | Not established by the available evidence. | Not established by the available evidence. | Dan's evidence: companies prove out quarter by quarter while market has 'white knuckle moments' but the 'multi-year tech bull market' continues. |
| Bear | Not established by the available evidence. | Not established by the available evidence. | Tom's invalidation condition: if it becomes a 'true deep cyclical'; Dan's risk list: contracting valuations, circular financing, macro issues, oil, weekend risk; '10% 15%' data centers voted down. | -
Risk Factors (⚠️):
- Contracting valuations and 'too hot, too good to be true. No way this can continue.' sentiment.
- Circular financing.
- Macro issues and oil.
- Political/politicization risk: '10% 15%' data centers voted down.
- Memory-stock and Micron-specific exposure in drawdowns.
- Missing verification: no valuation levels, no PE figures, no earnings estimates, no bull-market duration beyond 'multi-year' and data-center horizon of 'five six years'. -
Actionable Trading/Allocation Plan (🎯):
- Verify memory-stock and Micron quarter-by-quarter earnings against the claim that companies will prove out the cycle.
- Track data-center approvals/builds against Dan's '12 to500' pipeline over 'next five six years' and the '10% 15%' rejection assumption.
- Monitor PE and earnings growth to test Tom's 'never at a top' condition and whether the US economy remains low-volatility and not a 'true deep cyclical'.
- Monitor circular financing, macro, oil, and weekend headlines for the named 'white knuckle moments'.
- Distinguish creator claims from analyst interpretation; no entry, stop, target, ratio, position size, or probability was stated in evidence.

-
Creator Horizon Category (⏱️): Other — EVIDENCE is a non-financial montage of immigration stories and patriotic quotations, with no stated market horizon.
-
One-Line Thesis (💡): The All-In Podcast montage presents American exceptionalism and immigrant/entrepreneurial opportunity through personal histories and patriotic quotes, but it does not state any market thesis, ticker, catalyst, level, valuation, or trade plan.
-
Key Data Points (📊):
- Headline claim: 'It's not about giving everyone something. It's about giving everyone the opportunity to have anything. And that's what's missing everywhere else in the world except the United States.'
- No ticker, price, valuation, rate, or macro level is stated in EVIDENCE.
- Speaker: born 1976 in Sri Lanka; left at beginning of protracted ethnic civil war; moved in 1986; father became attaché for Sri Lankan embassy to Canada; formative years 6 to 22.
- Speaker: born in South Africa during apartheid; parents documentary filmmakers; bumper sticker in bedroom read 'go for gold'; dream was to go to America and make it in Hollywood.
- Speaker: born Cape Town, South Africa in 1972; family moved to United States at age 5; moved to Memphis, Tennessee; became U.S. citizens at age 10.
- Speaker: born Bay Ridge, Brooklyn, 'last exit on the R train'; New York rough in 70s/80s with gangsters, Hell's Angels, gangs, graffiti; grew up in father's bar 'Beards.'
- Speaker: early 2000s graduated electrical engineering at University of Waterloo; smartest classmates came to U.S. at height of dot-com bubble; asks why all smart people going down there.
- Claim: 'America is a place where you can accomplish whatever you set out to accomplish. If you work hard and you're smart and you do the right things, this is a country where you can accomplish great things.'
- Claim: 'Nowhere in the world are people rooting for each other like America.'
- Quote montage: 'All men are created equal'; 'not the critic who counts'; 'rendezvous with destiny'; 'nothing wrong with America that cannot be cured by what is right with America'; 'risk-takers, doers, makers of things'; 'We are America, second to none'; 'make America great again.' -
Technical Levels & Setups OR Macro Drivers (📌):
- Immigrant-founder background stories used as evidence for U.S. opportunity narrative.
- Patriotic quote montage emphasizing American exceptionalism, entrepreneurship, and risk-taking.
- Anecdotal pull factor: engineering talent from University of Waterloo moving to U.S. during dot-com bubble.
- No financial catalyst, sector setup, Fed/rate discussion, earnings, or valuation driver is provided. -
Risk/Reward Framework (⚖️):
- Entry: Not established by the available evidence.
- Stop: Not established by the available evidence.
- Targets: Not established by the available evidence.
- Risk/Reward: Not established by the available evidence.
- Position Size: Not established by the available evidence.
- Probability: Not established by the available evidence. -
Scenario Analysis (🔄):
| Scenario | Probability | Target | Trigger |
|---|---|---|---|
| Unavailable | Not established by the available evidence. | Not established by the available evidence. | Verify source evidence. | -
Risk Factors (⚠️):
- No market thesis, asset, ticker, level, valuation, catalyst, or time horizon is stated.
- Scenarios, probabilities, entries, stops, targets, and position sizes cannot be verified from EVIDENCE.
- Quotes are not fully attributed in transcript; verification requires identifying speaker and original source.
- Anecdotal immigration and patriotic narratives do not establish investable or macro-forecast claims.
- If the full episode contains market discussion, it is absent from EVIDENCE. -
Actionable Trading/Allocation Plan (🎯):
- Verify full episode and chapter markers to determine whether this is an intro montage or substantive market segment.
- Search full transcript for tickers, prices, rates, dates, and macro keywords; none appear in EVIDENCE.
- Identify each speaker and original quote to separate creator claims from historical speech excerpts.
- Do not infer market implications beyond the literal evidence; await specific assets, levels, or catalysts.

-
Creator Horizon Category (⏱️): Long-Horizon Macro / Structural — Isaacman outlines multi-year Artemis, nuclear, lunar-base, Mars, and China-competition timelines through 2028/2030.
-
One-Line Thesis (💡): Jared Isaacman claims NASA is reinvigorated under President Trump's national space policy and must win a second space race against China by executing Artemis 3 in summer 2027, Artemis 4 lunar return in 2028, nuclear SR1 Freedom in 2028, and eventual Mars missions, or risk China occupying the lunar south pole and eroding U.S. leadership.
-
Key Data Points (📊):
- NASA administrator Jared Isaacman headline: NASA is reinvigorated, regaining swagger, and America is back in the business of sending astronauts to the moon — All-In Podcast speech.
- Second space race: China intends to put astronauts on the moon by 2030 and is working with Russia on a nuclear-powered moon base — Isaacman frames this as the central competitive threat.
- Artemis timeline: Artemis 2 completed as opening act; Artemis 3 launch in summer 2027 on SLS into low Earth orbit, rendezvous with Blue Origin and SpaceX lander test vehicles; Artemis 4 in 2028 returns American astronauts to lunar surface 'to stay'.
- Artemis 2: four astronauts rode 8.8 million pounds of thrust, traveled farther into space than any humans around the moon and back safely — recipients of Congressional Space Medal of Honor.
- Artemis 3 hardware: already being assembled; before year end NASA intends to roll out to launch complex 39B for a tanking test.
- Lunar base: humanity's first outpost on another world; near-monthly launch cadence; science of survival; autonomous and crude mobility, surface improvement, in-situ resource utilization and manufacturing, logistics, habitability, power, communications — live HD on a moon-based website.
- Lunar south pole: water ice is the technological proving ground for Mars; China's robotic missions target Shackleton crater next year; only so many good parking spots.
- Nuclear NASA: SR1 Freedom, a 100-kilowatt fission reactor, to launch in 2028, transit Mars, release Skyfall with three Ingenuity-class helicopters and ground-penetrating radar to scout subsurface ice and landing sites; SR2, SR3, SR4 planned.
- Failed nuclear history: billions spent on failed nuclear programs that had not left the laboratory since 1965 — Isaacman says NASA will leave that behind.
- Dragonfly: nuclear-powered octocopter powered by 2-kilowatt MMRTG converting to just 100 watts of electricity; journey to Saturn's Titan in 2028.
- Europa Clipper: arrives at Jupiter's icy moon in 2030.
- Space telescopes: James Webb and Hubble soon joined by Roman; nearly 300-megapixel wide-field instrument and JPL-built coronagraph; surveys dark energy, dark matter, tens of thousands of worlds; images too large for any screen on Earth.
- NEO Surveyor: find asteroids and comets that can threaten Earth; next-generation telescopes seek habitable planets orbiting other stars.
- Commercial space: NASA will support orbital and perhaps lunar economy; proven markets launch, observation, communication; possible orbital data centers, commercial space stations, on-orbit manufacturing, regolith resource extraction, asteroid mining; 'not NASA's job to force an economy' but will ignite one.
- Cost/legacy failures cited: Orion cannot inject into low lunar orbit like Apollo; prior administration cancelled Mars sample return that was on track to cost more than an aircraft carrier; rocket designed when China was predominantly operating coal-fired locomotives now becomes operational as China operates 25,000 mi of high-speed rail.
- Schedule gap cited: more time between Artemis 1 and Artemis 2 than all 12 Gemini missions flown 60 years before; lunar space station would put astronauts looking down on desirable lunar real estate instead of operating on surface.
- China capability cited: very achievable two-launch architecture, national will and capabilities to put astronauts on surface of Moon; if America has not returned despite decades of promises and more than $100 billion invested, shock wave globally.
- Political/authority: Isaacman says he executes President Trump's national space policy; support of President Trump, Congress, clear mandate; proposed United States Space Academy/Starfleet Academy to prepare next generation.
- Private partners named: Blue Origin and SpaceX for lander test vehicles; no public tickers or valuations are provided in evidence. -
Technical Levels & Setups OR Macro Drivers (📌):
- Second space race with China by 2030 as forcing function for NASA budget, urgency, and focus.
- Artemis multi-launch campaign: SLS/Orion, Blue Origin and SpaceX landers, interoperability tests, uncrewed landings, crewed Artemis 4.
- Lunar south pole water ice as strategic real estate and Mars proving ground.
- Nuclear power/propulsion pivot: SR1 Freedom, SR2-SR4, high-temperature materials, power conversion, radiator mass, electric propulsion.
- Commercialization: launch, observation, communications, orbital data centers, commercial stations, on-orbit manufacturing, regolith extraction, asteroid mining.
- Science pipeline: Roman, Dragonfly, Europa Clipper, NEO Surveyor, next-gen telescopes.
- Workforce/institutional rebuild: Starfleet Academy, reversing outsourced/lost core competencies. -
Risk/Reward Framework (⚖️):
- Entry: Not established by the available evidence.
- Stop: Not established by the available evidence.
- Targets: Not established by the available evidence.
- Risk/Reward: Not established by the available evidence.
- Position Size: Not established by the available evidence.
- Probability: Not established by the available evidence. -
Scenario Analysis (🔄):
| Scenario | Probability | Target | Trigger |
|---|---|---|---|
| Bull | Not established by the available evidence. | Not established by the available evidence. | Artemis 3 launches summer 2027 on SLS into low Earth orbit, rendezvous with Blue Origin and SpaceX lander test vehicles, Artemis 4 returns American astronauts to lunar surface in 2028 to stay, and SR1 Freedom launches in 2028. |
| Base | Not established by the available evidence. | Not established by the available evidence. | Artemis 3 is assembled and rolls out to launch complex 39B before year end for a tanking test as stated, with NASA maintaining Artemis 2 as completed opening act and no explicit market/financial base case in evidence. |
| Bear | Not established by the available evidence. | Not established by the available evidence. | China places astronauts on the Moon by 2030 and/or targets Shackleton crater next year while America has not returned despite decades of promises and more than $100 billion invested. | -
Risk Factors (⚠️):
- Schedule slips: evidence cites more time between Artemis 1 and Artemis 2 than all 12 Gemini missions.
- Cost overruns: Mars sample return cancellation cited as on track to cost more than an aircraft carrier; programs too costly to succeed.
- Nuclear execution risk: billions spent on failed nuclear programs that had not left the laboratory since 1965.
- Workforce/core competency risk: NASA core competencies and tens of thousands of workforce rented, outsourced, or lost; months of progress become years at greater cost.
- Geopolitical risk: China two-launch architecture, national will, Shackleton crater parking spots, Russia nuclear-powered moon base.
- Political/resource risk: resources spread across districts/partners; lobbying against America's interests; external impositions and self-inflicted drag.
- Market access risk: no public tickers, valuations, or investable-vehicle details in evidence; SpaceX and Blue Origin are private in the transcript context.
- Evidence limitation: this is a transcript of a speech, not financial statements, contracts, budgets, or earnings guidance. -
Actionable Trading/Allocation Plan (🎯):
- Verify NASA's stated before-year-end rollout of Artemis 3 to launch complex 39B for a tanking test.
- Track Artemis 3 summer 2027 launch, SLS low Earth orbit insertion, and rendezvous with Blue Origin and SpaceX lander test vehicles.
- Track Artemis 4 in 2028 for crewed lunar surface return and the stated lunar base near-monthly cadence.
- Verify SR1 Freedom 100-kilowatt fission reactor 2028 launch, Skyfall release, and three Ingenuity-class helicopters/ground-penetrating radar.
- Monitor science mission dates: Dragonfly to Titan in 2028; Europa Clipper arrival at Jupiter in 2030; Roman 300-megapixel instrument.
- Monitor China's next-year robotic Shackleton crater mission and 2030 crewed lunar target.
- Identify any public-market exposure to launch, observation, communications, orbital data centers, commercial stations, on-orbit manufacturing, regolith extraction, or asteroid mining; evidence names no tickers or valuations.
- Verify congressional budget, contract awards, and NASA national space policy implementation; evidence gives no entry, stop, target, ratio, position size, or probability.
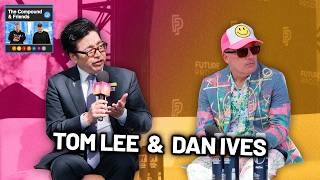
-
Creator Horizon Category (⏱️): Long-Horizon Macro — The discussion frames a near-term Fed decision alongside a multi-year AI/tech capex and earnings cycle, with Dan Ives citing possible equilibrium in early 2029 and Tom Lee discussing Fed-driven bull-market risk.
-
One-Line Thesis (💡): Tom Lee and Dan Ives claim an expected Fed hike sets up a high-probability near-term rally and that a young multi-year AI/tech bull market is supported by 25% earnings growth, 13 to1 chip demand/supply, AI data-center buildout, and a five to $6 tech capex multiplier.
-
Key Data Points (📊):
- Fed catalyst — meeting on tap; market convinced of a 25 basis point rate hike based on options/futures; ~90% probability cited
- Tom Lee timing — says probability of a massive rally starting tomorrow is really high; transcript references 'two 215' and '216 after Wars' after Fed
- S&P 500 — 2.6% off all-time high despite Strait of Hormuz closure, oil spike, tariffs, persistent inflation, AI/Situational awareness unwind, 10-year at 5%, Fed hiking, housing shut down, Frontier AI model slowdown
- Semis — in 20% drawdown, 19% cited
- Earnings — earnings up 25% this year; market only up 10%; market got cheaper
- Chip demand/supply — called 13 to1; 13 orders for every one chip that can be produced
- Capex multiplier — every dollar spent on capex has a five to $6 multiplier across rest of tech
- Equilibrium — no true equilibrium probably till early 2029 at this pace
- Data centers — transcript says '12 to,500' data centers to be built next 5 to 6 years; even if 10% to 15% are voted down
- Earnings estimates — investors underestimating earnings by probably 25% to 30% next few years
- Fed risk — Fed is 80% of the time the reason a bull market ends
- Debt issuance — higher debt issuance than since start of buyback era around 2012; 15 years of companies shrinking float, now IPOs and bond issuance
- US vs China — US ahead of China in tech for first time in 30 years; semis two to three years ahead; third-rate chip probably a year ahead of Huawei; China ahead in robotics and energy
- AI adoption context — ChatGPT got to 100 million users fast and now a billion; Gemini instant adoption; Claude neck-and-neck on enterprise
- Memory stocks — memory stocks front and center; Micron cited
- DBMF ad — world's largest managed futures ETF as of July 31st, 20126 with 4.16 billion AUM, low-cost ETF, uncorrelated managed futures strategy
- Fundstrat context — Tom Lee is co-founder/head of research/CIO at Fundstrat Capital and lead portfolio manager of Granny Shots ETF suite; 12th anniversary of Fundstrat -
Technical Levels & Setups OR Macro Drivers (📌):
- Expected Fed hike may remove future hike uncertainty and unleash rally if market sees Fed action as sufficient
- High pessimism plus good earnings and contracting valuations described as bullish setup
- AI capex wave described as biggest in US history; chip demand/supply tight through early 2029
- AI capex multiplier expected to benefit software, infrastructure, cybersecurity, and broader tech
- US tech leadership vs China across semis, hyperscalers, and frontier models; China leads in robotics and energy
- Memory stocks and Micron highlighted as front and center in AI trade
- Debt issuance, IPOs, and bond supply replacing 15 years of float shrink as potential market structure headwind
- Politicalization and local votes against data centers cited as key operational risk to AI buildout -
Risk/Reward Framework (⚖️):
- Entry: Not established by the available evidence.
- Stop: Not established by the available evidence.
- Targets: Not established by the available evidence.
- Risk/Reward: Not established by the available evidence.
- Position Size: Not established by the available evidence.
- Probability: Not established by the available evidence. -
Scenario Analysis (🔄):
| Scenario | Probability | Target | Trigger |
|---|---|---|---|
| Bull | Not established by the available evidence. | Not established by the available evidence. | Fed delivers the 25 basis point hike and market treats it as removing future hikes; Tom Lee says probability of a massive rally starting tomorrow is really high |
| Base | Not established by the available evidence. | Not established by the available evidence. | AI capex and data-center buildout continue; earnings beat estimates; Dan Ives says multi-year tech bull market is young with white-knuckle moments |
| Bear | Not established by the available evidence. | Not established by the available evidence. | Fed monetary-policy intervention ends bull market; bona fide bubble if only one AI model is used and capex goes to zero; data-center projects voted down/politicalization; China narrows gap | -
Risk Factors (⚠️):
- Fed tightening risk: Tom Lee says Fed is 80% of the time the reason a bull market ends
- AI bubble risk: bubble could happen if everyone says only one AI model is wanted and capex goes to zero
- Political risk: data-center votes and grandstanding politicalization; every data center voted down is claimed to be a China win
- China narrowing gap: if chips are not sold into China or model development slows, China may narrow the gap
- Debt/issuance risk: higher debt issuance, IPOs, and bond-market supply after 15 years of float shrink
- Valuation/cyclical risk: bears argue contracting valuations mean too hot, too good to be true
- Fed event verification risk: exact Fed decision, options/futures probability, and rally timing are claims not independently verified in evidence
- DBMF ad date typo: transcript says July 31st, 20126, so AUM date requires verification -
Actionable Trading/Allocation Plan (🎯):
- Verify the scheduled Fed decision, whether a 25 basis point hike occurs, and the options/futures-implied probability cited around 90%.
- Track S&P 500 distance from all-time high, the 2.6% gap cited, and semiconductor drawdown levels around 19% to 20%.
- Monitor AI capex data points: transcript's '12 to,500' data centers, 10% to 15% potential project rejections, chip demand/supply 13 to1, and early 2029 equilibrium claim.
- Check earnings revisions against claims of 25% earnings growth, market up 10%, and 25% to 30% underestimation.
- Track 10-year Treasury yield near 5%, Fed hiking path, oil and Strait of Hormuz status, tariffs, and inflation data.
- Monitor data-center local votes, politicalization, and chip export policy toward China for US-vs-China AI leadership thesis.
- Review debt issuance, IPO supply, and buyback/float trends versus the 2012 buyback-era and 15-year float-shrink claim.
- Verify DBMF ad claims via prospectus and issuer: world's largest managed futures ETF, 4.16 billion AUM, and July 31st, 20126 date typo.

-
Creator Horizon Category (⏱️): Long-Horizon Macro / Structural — The evidence discusses media capture, laws targeting basic journalism, and AG fraud enforcement, not prices, valuation, or macro indicators.
-
One-Line Thesis (💡): All-In Podcast speaker claims Nick is a threat to captured legacy journalists because he uncovers actual real fraud, puts people on camera, shames them, and forces state AGs to act, while critics focus on marginal fact-checking.
-
Key Data Points (📊):
- Headline claim: 'they're creating laws to try to stop you from doing basic journalism' — context: legal pushback framed as validation of Nick's work; no ticker or macro keyword attached.
- Speaker claim: Nick 'find[s] actual real fraud' and puts 'the people on camera' and shames them — context: credited with arrests and forcing AGs to face it.
- Speaker claim: 'you're forcing the AGs in this country to face it' — context: no specific AG, state, case, or statute named.
- Speaker claim: legacy journalists 'have become captured and politicized and they have picked a side' — context: contrasted with Nick not picking a side.
- Speaker claim: criticism of Nick is 'he didn't... fact-check... wasn't thorough enough here' — context: dismissed as marginal and on-the-job learning.
- Speaker claim: 'This was the job of 60 Minutes and Frontline and they forgot how to do their job' — context: said Nick is picking up their mantle.
- Speaker claim: 'It's just you' — context: described Nick's pure desire and energy as sole driver.
- No tickers, prices, levels, valuations, dates, portfolio sizes, or macro indicators are stated in the evidence. -
Technical Levels & Setups OR Macro Drivers (📌):
- Legal pushback: speaker says laws are being created to stop Nick's basic journalism.
- Legacy media capture: speaker says journalists became captured, politicized, and picked a side.
- Fraud exposure mechanism: find real fraud, put people on camera, shame them, and arrests follow.
- AG pressure: speaker says Nick forces state attorneys general to face fraud.
- Criticism dynamic: critics attack marginal fact-checking or thoroughness rather than the core fraud findings.
- Mantle transfer: speaker says Nick replaces 60 Minutes and Frontline-style investigative work. -
Risk/Reward Framework (⚖️):
- Entry: Not established by the available evidence.
- Stop: Not established by the available evidence.
- Targets: Not established by the available evidence.
- Risk/Reward: Not established by the available evidence.
- Position Size: Not established by the available evidence.
- Probability: Not established by the available evidence. -
Scenario Analysis (🔄):
| Scenario | Probability | Target | Trigger |
|---|---|---|---|
| Bull | Not established by the available evidence. | Not established by the available evidence. | If Nick uncovers actual real fraud, puts people on camera, shames them, and they get arrested, as the speaker claims. |
| Base | Not established by the available evidence. | Not established by the available evidence. | If critics continue to focus on marginal fact-checking or thoroughness while the core fraud findings and AG pressure persist. |
| Bear | Not established by the available evidence. | Not established by the available evidence. | If laws described as trying to stop basic journalism are enacted or enforced against Nick. | -
Risk Factors (⚠️):
- No specific law, bill, jurisdiction, or legislative body is named in the evidence.
- No specific fraud case, arrest, AG, or court action is named or independently verified.
- No fact-check details or disputed claims are provided, so criticism cannot be assessed.
- The evidence is a single speaker's praise, not independent verification of Nick's work or legacy media's conduct.
- No financial-market implication, ticker, valuation, or macro catalyst is established.
- Private conversations about nuances are referenced but not detailed.
- Claims about arrests and journalists are uncorroborated in the evidence and may be legally sensitive. -
Actionable Trading/Allocation Plan (🎯):
- Verify whether any laws or legislative proposals matching 'stop basic journalism' exist and identify jurisdiction and status.
- Identify Nick and verify specific fraud investigations, on-camera confrontations, arrests, and AG actions referenced.
- Check 60 Minutes and Frontline archives for comparable investigative coverage to test the speaker's claim.
- Review critics' specific fact-checking complaints to determine whether they are marginal or material.
- Monitor state AG offices for enforcement actions linked to the alleged fraud cases.
- Treat all claims as unverified until primary documents, court records, or official statements are obtained.

-
Creator Horizon Category (⏱️): Long-Horizon Macro / Structural — The evidence concerns long-running California infrastructure governance, cost escalation, and a state law affecting recording/uploading at immigration support service providers, not short-term market levels.
-
One-Line Thesis (💡): All-In Podcast creator/guest claims California high-speed rail has spent $15B over 18 years with no track or LA-SF connection, costs have escalated from $33B to $236B, and California passed a law to stop his investigations into immigration support service providers.
-
Key Data Points (📊):
- California high-speed rail — creator headline claim: $15B spent over 18 years and 'literally nothing' connected; 2008 promise to connect Los Angeles to San Francisco remains unfulfilled.
- Cost estimates — creator cites original $33B, then $126B, then newest estimate $236B; elsewhere says finish estimate is $100B-$200B.
- Global comparison — creator says China started high-speed rail in 2008 and connected over 30,000 miles; California has not connected a single town.
- Cost ranking — creator calls it the most expensive infrastructure project happening today and on track to be third most expensive in world history after the 1950s interstate project and International Space Station.
- Route change — creator says California abandoned the San Francisco-Los Angeles route and now focuses Merced-to-Bakersfield, so it will not service LA-SF passengers.
- Construction status — creator says no rail has been placed, only concrete and rebar; describes it as a modern-day Stonehenge and probably the most expensive piece of concrete known to man.
- Change orders/delays — creator says one-third of the entire cost has gone to change order delays; contractors owed $170,000/day and $5M/month; February settlement was over half a billion dollars.
- Trains — creator says California has not bought the high-speed trains yet and argues the state may know there will never be a train on the tracks.
- Subsidy comparison — creator says one-way tickets at current SF-LA ridership could be subsidized free for 150 years at prior cost, or 300 years at the $236B estimate.
- Funding gap — creator says California allocates $1B/year while needing $100B-$200B to finish; CHSRA Sacramento office was unattended at 4:09pm despite a 5:00pm closing time.
- Land/housing — creator says houses are being built on the alignment; government typically buys alignment upfront; developed land can cost 10-11 times bare land value; farmers' contiguous ranches will be split.
- Political claims — Senator Cortese secured $1B for next 20 years, says the project is happening, cites 21 construction projects with thousands of workers, calls it the greatest economic development project in the country, and says completion 'might be, might not.'
- Newsom — creator cites a 2016 private video in which Governor Newsom says the project is not going to materialize in our lifetime.
- Immigration law — creator says California passed a law to stop his investigations; immigration support service providers can give a demand letter; uploading video triggers a $4,000 fine and legal fees if they win; he expects First Amendment litigation.
- Immigration funding/fraud — creator says bill sponsor 'Chura' received $80M as a nonprofit; he says 12 immigrants were charged with $10M fraud by California DOJ on the day of recording after he filmed San Diego daycares.
- Tickers/valuations — none stated in evidence; no market tickers, valuation multiples, prices, or trade levels are provided. -
Technical Levels & Setups OR Macro Drivers (📌):
- Cost escalation from $33B to $126B to $236B versus $1B/year allocated funding creates a stated financing gap.
- Route abandonment/reduction from LA-SF to Merced-Bakersfield means the original service goal is not being pursued.
- Change-order and delay liabilities: one-third of cost to change orders, $170,000/day and $5M/month contractor exposure, and a $500M+ delay settlement.
- Land-acquisition failure: houses being built on the alignment and developed land costing 10-11 times bare land value.
- No trains purchased, no rail placed, and only concrete/rebar observed on the alignment.
- Project duplicates Amtrak's current service route, per city manager claim in evidence.
- Agricultural impact: contiguous ranches split, irrigation/power/infrastructure complications.
- Political support: Senator Cortese secured $1B/year for 20 years and claims 21 construction projects with thousands of workers.
- Political skepticism: Governor Newsom private 2016 video claim that the project will not materialize in our lifetime.
- Regulatory/legal setup: California law targeting recording/uploading at immigration support service providers, including $4,000 fine and legal-fee risk.
- Fraud enforcement setup: creator cites California DOJ charging 12 individuals with $10M fraud after San Diego daycare filming. -
Risk/Reward Framework (⚖️):
- Entry: Not established by the available evidence.
- Stop: Not established by the available evidence.
- Targets: Not established by the available evidence.
- Risk/Reward: Not established by the available evidence.
- Position Size: Not established by the available evidence.
- Probability: Not established by the available evidence. -
Scenario Analysis (🔄):
| Scenario | Probability | Target | Trigger |
|---|---|---|---|
| Bull | Not established by the available evidence. | Not established by the available evidence. | Senator Cortese's literal claim: 'There's 21 construction projects going on right now with thousands of workers. So, you'll see it get done.' |
| Base | Not established by the available evidence. | Not established by the available evidence. | Evidence says the route is now Merced-to-Bakersfield with $1B/year allocated while $100B-$200B more is needed, and no rail has been placed. |
| Bear | Not established by the available evidence. | Not established by the available evidence. | Newsom private 2016 video says the project will not materialize in our lifetime; creator says no trains have been bought and no rail has been laid. | -
Risk Factors (⚠️):
- Creator allegations of waste, fraud, and incompetence are not corroborated by primary documents in the evidence.
- Cost estimates vary within the segment ($100B-$200B versus $236B), so the exact current estimate requires verification.
- Legal interpretation of the immigration support service provider law, $4,000 fine, legal-fee exposure, and First Amendment status is creator's claim.
- The claim that 12 individuals were charged with $10M fraud lacks case identifiers or court records in evidence.
- No tickers, valuation levels, portfolio implications, or trade parameters are established by the evidence. -
Actionable Trading/Allocation Plan (🎯):
- Verify current California High-Speed Rail Authority cost, schedule, route, track-laying, and train-procurement status via official CHSRA reports and state audits.
- Verify the legislative bill and Senator Cortese's role in securing $1B/year for 20 years.
- Verify the February delay settlement over $500M and contractor per-day/monthly claims through public records and court dockets.
- Verify Governor Newsom's 2016 private video statement and current route scope from SF-LA versus Merced-Bakersfield.
- Verify California's immigration support service provider law, $4,000 fine/legal-fee provisions, and status of any First Amendment lawsuit.
- Verify any California DOJ action charging 12 individuals with $10M fraud and any connection to San Diego daycares.
- Monitor CHSRA board meetings, state audit releases, legislative records, and relevant court dockets for follow-up confirmation or contradiction.

-
Creator Horizon Category (⏱️): Other — Transcript contains only personal preference dialogue about Miami Vices and frozen drinks, with no time horizon or market content.
-
One-Line Thesis (💡): The available evidence contains no market thesis; the only explicit claims are personal preferences about Miami Vices, frozen drinks, and supporting Ben.
-
Key Data Points (📊):
- Miami Vices — speaker says 'I don't really love Miami Vices' and 'I don't like frozen drinks'
- Ben's thing — speaker says 'It was always Ben's thing and I wanted to support my boy'
- Our stick for years — speaker says it has been 'our stick for years'
- Lying to myself — speaker says 'I've been lying to myself this whole time'
- No ticker, price, level, valuation, catalyst, or portfolio implication stated in evidence -
Technical Levels & Setups OR Macro Drivers (📌):
- Personal taste confession: dislike of frozen drinks and Miami Vices
- Social/support motive: wanting to support Ben
- Longstanding habit: Miami Vices described as 'our stick for years'
- No market driver or setup established by the available evidence -
Risk/Reward Framework (⚖️):
- Entry: Not established by the available evidence.
- Stop: Not established by the available evidence.
- Targets: Not established by the available evidence.
- Risk/Reward: Not established by the available evidence.
- Position Size: Not established by the available evidence.
- Probability: Not established by the available evidence. -
Scenario Analysis (🔄):
| Scenario | Probability | Target | Trigger |
|---|---|---|---|
| Unavailable | Not established by the available evidence. | Not established by the available evidence. | Verify source evidence. | -
Risk Factors (⚠️):
- No investment thesis to invalidate
- No ticker or asset identified for verification
- Transcript appears truncated; full context may contain omitted financial discussion
- Source segment is personal dialogue, not financial analysis -
Actionable Trading/Allocation Plan (🎯):
- Review full video transcript and context for omitted financial claims or sponsor disclosures
- Verify whether Miami Vices or Ben references map to any ticker, brand, or portfolio holding
- Monitor The Compound for any subsequent market commentary tied to this segment

-
Creator Horizon Category (⏱️): Long-Horizon Macro / Structural — The discussion centers on multi-year AI data-center buildout, community compacts, energy and water infrastructure, and social license rather than near-term price levels.
-
One-Line Thesis (💡): All-In Podcast guests claim Meta Platforms' AI and data-center expansion is an unstoppable structural transformation, using Richland Parish, Louisiana as proof that data centers can deliver local tax windfalls and teacher bonuses, while acknowledging valid electricity, water, noise, and aesthetics concerns and alleging adversary-amplified misinformation threatens US AI buildout.
-
Key Data Points (📊):
- Meta Platforms — Dina Powell McCormick joined as president and vice chairwoman to help lead massive AI expansion, including data centers, investments, and global partnerships — speaker intro claim
- Dina Powell McCormick: 3.5 billion people every day are on Meta.
- Dina Powell McCormick: next three years could be the whole game.
- Dina Powell McCormick: there is a transformation in humanity coming; nothing can stop that now with this technology.
- Dina Powell McCormick: Richland Parish, Louisiana is Meta's largest data center investment.
- Video/narration: multi-billion dollar capital investment in Richland Parish; transformative.
- Video: small business catering went from 40 people to 400 a week since Meta came to town.
- Video: Richland Parish had lost population; a son moved away looking for work.
- Superintendent Sheldon: six taxing entities in the parish; Richland Parish School Board collects 51% of taxes.
- Superintendent Sheldon: 1 cent and a 1/2 cent sales tax are dedicated to employee salaries.
- Superintendent Sheldon: December 2025 1/2 cent sales tax check doubled from the previous year, roughly $4,000 to about $8,000.
- Superintendent Sheldon: June check — certified employees received about $40,000 increase; a $50,000 check; previous year was $10,000; net about $45,000 for teachers across December increase and June increase.
- Susan: data center uses a more expensive but more efficient system using less water than was being used on that land when it was farmed.
- Susan: Louisiana has about 32,000 miles of natural gas pipelines.
- Susan: Meta paid for its own generation, grid resilience, grid upgrades, and storm costs in Louisiana where it did not operate when hurricanes hit.
- Susan: Louisiana governor signed an executive order creating a framework for large load users; state has a sales tax exemption; state can be choosy; Meta was the prototype and set a high standard.
- Superintendent Sheldon: initial community sentiment had unknown and anxious thoughts; communication must target the least informed person in the community.
- Dina Powell McCormick: Chairman Cotton and Vice Chairman Mark Warner and intelligence committees believe they have evidence adversaries are trying to gin this up; she cannot comment on that.
- Dina Powell McCormick: if you wanted to stop America, you would stop building data centers in the US and prevent AI dominance; whether adversaries do it or not, this is an approach you would take.
- Dina Powell McCormick compact: pay for own electricity, drive electricity costs down, address water, fund teachers and first responders; communities that want benefits are allowed to have them, those that do not should opt out.
- Dina Powell McCormick: Meta is having impact in Texas and Ohio; the industry must tell these stories more.
- Dina Powell McCormick: teacher recruiting phone is ringing off the hook; the district may end up being the best school district in the state. -
Technical Levels & Setups OR Macro Drivers (📌):
- Meta AI expansion and data center capex as a bottleneck requiring government, business, philanthropy, and local partnerships.
- Community compact and social license as prerequisites: own electricity, grid upgrades, storm costs, water efficiency, teacher and first-responder funding.
- Local tax windfall mechanism: construction workforce sales taxes flow to school board and teacher salary checks.
- Louisiana policy setup: executive order framework for large load users, sales tax exemption, state selectivity, and Meta as prototype.
- Natural gas abundance and 32,000 miles of pipelines as an energy enabler for Louisiana data centers.
- Misinformation and communication war: valid concerns around pollution, electricity cost, water, noise, aesthetics versus alleged adversary amplification.
- Opt-out model: communities that want jobs and teacher bonuses can host; those that do not can decline.
- Replication setup: Meta impact claims in Texas and Ohio; Louisiana model as template for future large-load negotiations. -
Risk/Reward Framework (⚖️):
- Entry: Not established by the available evidence.
- Stop: Not established by the available evidence.
- Targets: Not established by the available evidence.
- Risk/Reward: Not established by the available evidence.
- Position Size: Not established by the available evidence.
- Probability: Not established by the available evidence. -
Scenario Analysis (🔄):
| Scenario | Probability | Target | Trigger |
|---|---|---|---|
| Bull | Not established by the available evidence. | Not established by the available evidence. | Meta compact produces sustained local tax revenue and teacher bonuses, Louisiana model is replicated in Texas and Ohio, and communities opt in. |
| Base | Not established by the available evidence. | Not established by the available evidence. | Some communities support data centers for jobs and teacher bonuses while others opt out; buildout proceeds with communication and regulatory friction. |
| Bear | Not established by the available evidence. | Not established by the available evidence. | Valid pollution, electricity cost, water, noise, and aesthetics concerns plus misinformation campaign block data center projects, slowing US AI buildout. | -
Risk Factors (⚠️):
- Valid community concerns around pollution, increased electricity cost, water closed-loop versus non-closed-loop, noise, and aesthetics are acknowledged but not fully quantified.
- Teacher bonus data is presented by local officials and company allies; no independent audit or methodology is in evidence.
- Sales tax spike may be tied to temporary construction workforce; durability of collections and bonuses is not established.
- Allegation that adversaries amplify misinformation is described as belief or evidence without details; Dina Powell McCormick says she cannot comment.
- Project economics, capex, returns, energy prices, and water usage metrics are not provided.
- State policy depends on executive order framework and sales tax exemption; political or regulatory reversal risk remains.
- Utility and grid cost allocation across consumers is not independently verified in the evidence.
- No ticker, valuation, entry, stop, target, or position size is established by the available evidence. -
Actionable Trading/Allocation Plan (🎯):
- Monitor Meta AI data center capex and expansion announcements, including Louisiana, Texas, and Ohio references.
- Verify Richland Parish sales tax collections and teacher bonus disbursements against public school board records.
- Track Louisiana executive order framework for large load users and any large-load sales tax exemption terms.
- Verify water use, electricity procurement, grid upgrade, and storm cost payments with utility filings and company disclosures.
- Monitor community opposition, local approvals, and opt-out decisions in host jurisdictions.
- Track intelligence committee statements regarding adversary misinformation; distinguish documented evidence from allegation.
- Compare community outcome claims and social license strategies across Meta data center host jurisdictions.
- Treat the video as thematic monitoring only; no trading parameters are established by the available evidence.

-
Creator Horizon Category (⏱️): Long-Horizon Macro — The segment centers on bond yields, Fed inflation targeting, TIPS, and baby-boomer wealth rather than short-term technical levels.
-
One-Line Thesis (💡): The Compound panel argues that high-quality bond yields above 5% are attractive versus the prior decade-plus, with inflation as the key bond risk and Fed 2% targeting/TIPS as mitigants, while separately framing luxury watches as milestone purchases rather than investments and pushing back on the claim that baby-boomer wealth mechanically props up equities.
-
Key Data Points (📊):
- Jackson question: 'Is that the equivalent of near guaranteed 5.2% annual returns?' — panel says an individual bond gives that yield only assuming no default and holding to maturity.
- Panel claim: high-quality bond index funds yielding over 5% average yield to maturity; 'haven't had that in a very long time' / 'decade plus'.
- Panel mechanics: maturity for some bonds could be 10-15 years away; investor gets coupon every 6 months and principal at end, not 5.2% each year.
- Panel claim: bond ETFs rebalance weekly/monthly/quarterly with constant duration to the benchmark, do not mature; some bonds mature and proceeds are reinvested.
- Panel claim: bonds do not trade on a lighted market like stocks; prices differ by dealer, inventory, platform, and there is little free bond buying at Schwab/Fidelity.
- RBIL plug: FM Investments' 'bill RBIL' described as the only ultra short duration TIPS product; if worried about inflation but still want return at 5%, you get cash rate, closer to four today.
- Watch question: Sam is an early-career doctor with $200,000 in student loans, a mortgage, an inherited 1970s Omega dress watch, young kids, Boglehead orientation, debt aversion, and negative net worth.
- Watch advice: do not buy for flex; buy for a milestone; pay down 7-9% student loan debt first; focus on building practice, real estate portfolio, stock portfolio; watches exist under $3,000 and under $2,000.
- Watch market claims: 2020 prices took off; most watches depreciate like cars; certain references appreciate; 2004 Daytona bought for founding partners; Rolex Batgirl GMT 10 years ago about 78 grand, now about 11 grand new; two years ago worth 15-16, pandemic 20-25; precious metal watches hold value because half the value is $4,000-$5,000/oz gold.
- Watch market claim: Milgauss/Milgos can be bought secondary market at places like Chrono24 and Hodinkee for 20-30% below list because people are not crazy about them.
- Boomer wealth: Steve cites Pew that 51% of US wealth is held by baby boomers. Rob checks Fed: $90T out of $174T in USA owned by baby boomers; adding $20T from silent generation means about two-thirds of all wealth is older people; 40% of homeowners have no mortgage, mostly baby boomers.
- Cash-on-sidelines pushback: $7T cash on sidelines is not how trading works; example: seller of $1M Apple gets $1M cash, so the same $1M remains on the sidelines. -
Technical Levels & Setups OR Macro Drivers (📌):
- High starting yields above 5% on high-quality bonds after a decade-plus low-yield era.
- TIPS as explicit inflation hedge; RBIL ultra-short TIPS product cited for inflation worry with cash-like rate.
- Bond ETF structural difference: constant duration and rebalancing versus individual bonds held to maturity.
- Luxury watches treated as asset-class-like collectibles after 2020, but panel frames them as milestone/emotional purchases, not investments.
- Baby-boomer wealth concentration and low mortgage debt cited as possible market support, while cash-on-sidelines reasoning is challenged.
- Fed statement and dot plot cited as the immediate macro catalyst for rate expectations. -
Risk/Reward Framework (⚖️):
- Entry: Not established by the available evidence.
- Stop: Not established by the available evidence.
- Targets: Not established by the available evidence.
- Risk/Reward: Not established by the available evidence.
- Position Size: Not established by the available evidence.
- Probability: Not established by the available evidence. -
Scenario Analysis (🔄):
| Scenario | Probability | Target | Trigger |
|---|---|---|---|
| Bull | Not established by the available evidence. | Not established by the available evidence. | Fed succeeds in getting inflation to 2% and rates fall; bond prices benefit from the inverse relationship described in the transcript. |
| Base | Not established by the available evidence. | Not established by the available evidence. | High-quality individual bond is held to maturity and does not default, delivering the stated 5.2% yield; bond ETF keeps constant duration/rebalancing. |
| Bear | Not established by the available evidence. | Not established by the available evidence. | Verify the trigger against the source evidence. | -
Risk Factors (⚠️):
- Default risk and duration risk; maturity for some bonds could be 10-15 years away.
- Bond market opacity, dealer/inventory pricing differences, and platform fees.
- Bond ETF rebalancing means no maturity return of principal at the stated yield-to-maturity.
- Fed may not achieve the 2% target; if inflation persists, Alex says equities are probably the better route.
- Watch market is illiquid and subjective; most watches depreciate and Rolex price references are not independently verified.
- Boomer wealth and cash-on-sidelines framing is not fully resolved; the transcript cuts off during the estate-planning point.
- RBIL product details are not independently verified; the 'closer to four today' yield conflicts with the 5% cash-rate framing. -
Actionable Trading/Allocation Plan (🎯):
- Verify current high-quality bond index fund yield-to-maturity and whether it exceeds 5%; distinguish YTM from annual return.
- Check individual bond maturity, duration, coupon, default risk, and tax treatment against the 5.2% example.
- Read TIPS and RBIL product documents for duration, yield, expense ratio, and inflation compensation mechanics.
- Compare bond ETF rebalancing/maturity rules and trading/fee costs at Schwab/Fidelity.
- Verify watch price claims on Chrono24, Hodinkee, or authorized dealer lists; confirm exact model references.
- Check Pew and Fed data for baby-boomer wealth shares, the $90T/$174T figures, $20T silent generation, and 40% mortgage-free homeowners.
- Monitor cash-on-sidelines dynamics and estate-planning behavior; the transcript omitted the conclusion of that discussion.

-
Creator Horizon Category (⏱️): Other — Creator frames the discussion around surviving the first year of trading and capital preservation rather than a specific market or security horizon.
-
One-Line Thesis (💡): The creator claims first-year trading survival depends on prioritizing risk management and capital preservation, with paper trading, learning technicals, defining a consistently working edge, and extreme focus/discipline as supporting requirements.
-
Key Data Points (📊):
- Number one rule in trading is risk management and preserving capital — creator's top rule
- No capital left at the end of year one means there will be no year two — survival framing
- Paper trading until technicals are learned and a particular edge consistently works for the trader — recommended practice
- Focus and discipline needed in the first year more than any other years of trading — behavioral priority -
Technical Levels & Setups OR Macro Drivers (📌):
- Risk management and capital preservation as the prerequisite for continuing beyond year one
- Paper trading as a phase for learning technicals before risking capital
- Identifying, refining, and defining a particular edge that consistently works for the trader
- Extreme focus and discipline as first-year trading requirements -
Risk/Reward Framework (⚖️):
- Entry: Not established by the available evidence.
- Stop: Not established by the available evidence.
- Targets: Not established by the available evidence.
- Risk/Reward: Not established by the available evidence.
- Position Size: Not established by the available evidence.
- Probability: Not established by the available evidence. -
Scenario Analysis (🔄):
| Scenario | Probability | Target | Trigger |
|---|---|---|---|
| Bull | Not established by the available evidence. | Not established by the available evidence. | Capital remains at the end of year one, allowing a year two; creator states no capital left at the end of year one means no year two. |
| Base | Not established by the available evidence. | Not established by the available evidence. | Paper trading until technicals are learned and a particular edge is identified, refined, and consistently works for the trader. |
| Bear | Not established by the available evidence. | Not established by the available evidence. | No capital left at the end of year one; creator states there will be no year two. | -
Risk Factors (⚠️):
- Failure of risk management or capital preservation may end the trading journey by year one, per creator
- Missing verification: no specific edge, instrument, timeframe, performance metric, or risk parameter is provided
- Behavioral risk: lack of focus and discipline during the first year is explicitly emphasized by creator -
Actionable Trading/Allocation Plan (🎯):
- Track whether risk management and capital preservation remain the stated number-one priority throughout the first year.
- Verify any claimed edge with consistently documented results; evidence provides no metrics or timeframe.
- Confirm whether paper trading is used until technicals and a repeatable edge are defined.
- Monitor focus and discipline as creator-stated first-year behavioral requirements.
-
Creator Horizon Category (⏱️): Short-Term Technical — Trade Brigade's title frames a live pre-market prep around a V-shaped reversal and a key level, both short-term technical concepts, aimed at futures and options traders.
-
One-Line Thesis (💡): Trade Brigade's video title claims a V-shaped reversal setup and that price is already at a key level in its live pre-market prep for futures and options traders.
-
Key Data Points (📊):
- Title: '[LIVE] Pre-Market Prep – V Shaped Reversal – We're Already At The Key Level...' — creator headline thesis
- Live schedule: 'live every trading day at 8:00 AM EST' — pre-market technical analysis timing
- Audience: futures traders and options traders — stated target viewers
- Topics named: technical analysis, pre-market prep, V-shaped reversal, key level — headline focus
- Disclaimer: informational only; not financial or legal advice; not a Registered Investment Advisor; trading is speculative and carries risk — creator risk statement -
Technical Levels & Setups OR Macro Drivers (📌):
- Live pre-market technical analysis for futures traders and options traders.
- V-shaped reversal setup referenced in the video title.
- Price already at an unspecified 'key level' per the title.
- Pre-market prep framed as a recurring live session at 8:00 AM EST on trading days. -
Risk/Reward Framework (⚖️):
- Entry: Not established by the available evidence.
- Stop: Not established by the available evidence.
- Targets: Not established by the available evidence.
- Risk/Reward: Not established by the available evidence.
- Position Size: Not established by the available evidence.
- Probability: Not established by the available evidence. -
Scenario Analysis (🔄):
| Scenario | Probability | Target | Trigger |
|---|---|---|---|
| Bull | Not established by the available evidence. | Not established by the available evidence. | Title's 'V Shaped Reversal' claim would be supported if the creator's unspecified 'key level' holds and reversal confirms; exact level must be verified in the full source. |
| Base | Not established by the available evidence. | Not established by the available evidence. | Pre-market prep is scheduled live at 8:00 AM EST for futures/options traders; verify whether the creator treats the current key level as a decision point. |
| Bear | Not established by the available evidence. | Not established by the available evidence. | Title's reversal thesis would be challenged if the unspecified 'key level' fails; exact level and invalidation must be verified in the full source. | -
Risk Factors (⚠️):
- Metadata-only evidence lacks exact ticker(s), price level(s), direction, timeframe, entry, stop, target, and risk/reward, so creator claims cannot be verified from title/description alone.
- Title's 'key level' is unspecified, so scenario triggers and invalidation cannot be bound to a literal value.
- Live pre-market content may include intraday updates not captured in the metadata.
- Creator's disclaimer states trading is speculative and carries risk; no specific portfolio implication is provided.
- Promotional links and affiliate references are present but not analyzed as market evidence. -
Actionable Trading/Allocation Plan (🎯):
- Review the full video or live stream to extract exact ticker(s), key level(s), timeframe, and V-shaped reversal criteria.
- Verify whether the creator states entry, stop, target, risk/reward, position size, or probability; record only literally stated values.
- Monitor the creator's stated 8:00 AM EST live pre-market schedule for updated futures and options technical analysis.
- Cross-check any named futures or options instruments against independent market data before treating the headline claim as verified.
- Separate creator statements from third-party links, promotions, and tool endorsements in the description.

-
Creator Horizon Category (⏱️): Long-Horizon Macro — Creators discuss AI existential/regulatory risk, China competition, and potential policy-error crisis alongside macro rates/inflation and earnings as long-horizon market drivers.
-
One-Line Thesis (💡): The Compound hosts argue extreme AI narratives (extinction, uselessness, utopia) are unlikely, China will not slow AI, and the stock market's earnings-driven floor is holding even as semis rotate down, breadth weakens, and higher rates/inflation create macro pressure.
-
Key Data Points (📊):
- AI headline: Anthropic employee resigned and claimed internal belief of a 10% or greater chance civilization is wiped out; Dario responded that the industry needs to slow down.
- AI headline: Sam Altman quote-tweeted in support; Elon Musk on board; Trump reportedly thinks AI risk is a hoax.
- AI discourse extremes: Ed Zitron camp says AI is useless and doesn't work; another extreme says it destroys humanity; third says utopia with 20% economic growth, no jobs, cure cancer.
- Derek Thompson observation: the resigning employee's post got 100 million views in 16 hours; AI-risk warnings have existed for years.
- Ben Thompson claim: tech people are 'too online'; AI enabling depends on physical infrastructure operated/manufactured/controlled by humans.
- China/prisoner's dilemma: if we slow frontier AI, China wins; if we win AI, China copies it; if China wins, we copy it.
- Semis: up 80% through July; now almost a 20% drawdown; on the AI-news Monday, semiconductors were down 5% while software was up 5%, described as semis' worst day relative to software of all time.
- Index drawdown: stock market down 4% or so, later stated 3%.
- Rate threshold: maybe 5% on the 10-year isn't what does it, but maybe 5.3%.
- Earnings floor: earnings acceleration keeping a pretty high floor; if slowdown, earnings should still be fine because hyperscaler free cash flow will replenish.
- Policy-crisis thesis: next big financial crisis likely from a policy error—Fed or government overstepping/overreacting—rather than the initial downturn.
- Historical reference: 1873 book/long depression and deflation lasted 30 years; creators say downturn wasn't that severe but policy response caused the problem.
- Cyber risk: more concerned about a cybersecurity incident in next 10 years than human extinction; parents had $20,000 taken from credit card, moved to checking, transferred out.
- Valuation/return tension: valuations are falling while stock market is rising; can spin both ways.
- Rotation/breadth: rotation inside market remarkably strong even as breadth deteriorates; still some support under market for now.
- Sponsor segment: Betterment Advisor Solutions pitches segmentation, automated paperless onboarding, streamlined tax-efficient portfolio management for smaller/simpler accounts. -
Technical Levels & Setups OR Macro Drivers (📌):
- AI safety/extinction discourse drives viral sentiment and regulatory debate, but creators say extreme outcomes basically never happen.
- China competitive prisoner's dilemma reduces likelihood of coordinated AI slowdown.
- Incentives debate: VCs want investments to work, AI employees want shares to be worth; creators split on cynical vs face-value read.
- Tech leaders' poor track record predicting outcomes (web3, metaverse, crypto) cited as reason to discount grand AI proclamations.
- Market setup: index rising while valuations fall; macro rates/inflation worsened but equities up, creating complacency debate.
- Rotation setup: semis deeply down from July peak while software outperforms; breadth deteriorating but support remains.
- Earnings acceleration and hyperscaler free cash flow act as market floor.
- Policy-error setup: Fed/government overreaction after a downturn is flagged as next crisis catalyst.
- Cybersecurity incident, not human extinction, is creator's higher-probability AI-related threat.
- Ad segment: Betterment Advisor Solutions pitches segmentation as growth strategy for RIAs. -
Risk/Reward Framework (⚖️):
- Entry: Not established by the available evidence.
- Stop: Not established by the available evidence.
- Targets: Not established by the available evidence.
- Risk/Reward: Not established by the available evidence.
- Position Size: Not established by the available evidence.
- Probability: Not established by the available evidence. -
Scenario Analysis (🔄):
| Scenario | Probability | Target | Trigger |
|---|---|---|---|
| Bull | Not established by the available evidence. | Not established by the available evidence. | Earnings acceleration persists and hyperscaler free cash flow replenishes, supporting a high floor in the market despite macro pressure. |
| Base | Not established by the available evidence. | Not established by the available evidence. | Verify the trigger against the source evidence. |
| Bear | Not established by the available evidence. | Not established by the available evidence. | Verify the trigger against the source evidence. | -
Risk Factors (⚠️):
- AI extinction probability claim is unverifiable and lacks proof in evidence.
- Regulation may be futile if China does not slow; prisoner's dilemma.
- Policy error from Fed/government overreaction could cause next financial crisis.
- Cybersecurity incident could compromise banking/credit-card data; creator cites $20,000 theft example.
- Market breadth deteriorating while index is up; semis almost 20% drawdown.
- Tech people have poor track record predicting outcomes of technology (web3, metaverse, crypto).
- Even experts can be sucked into mania; AI employees/VCs have incentives.
- No ticker-specific entry/stop/target/ratio/position-size/probability is provided.
- Sponsor content from Betterment Advisor Solutions is promotional, not market analysis. -
Actionable Trading/Allocation Plan (🎯):
- Monitor Anthropic/Dario/Altman/Musk/Trump AI-risk and regulation headlines, including the 10% civilization-wipeout claim and any policy response.
- Track China AI policy/pacing for evidence of prisoner's dilemma; verify whether either country actually slows frontier models.
- Verify market figures: S&P YTD 12%/13%/17%, semis up 80% through July and near 20% drawdown, semis -5% vs software +5%, index down 3-4%.
- Monitor earnings acceleration and hyperscaler free cash flow for the market floor thesis.
- Track Fed/government policy-error risk and historical 1873/long-depression policy-overreaction analogy.
- Assess cybersecurity incident risk as creator's stated higher-probability threat.
- Monitor market breadth and semis/software rotation for support under the market.
- Separate sponsored Betterment Advisor Solutions segment from editorial market commentary.

-
Creator Horizon Category (⏱️): Long-Horizon Macro — The creator frames a multi-year AI infrastructure supercycle and capex/offtake path while flagging near-term rate, regulation, and monthly AI-lab revenue swing factors.
-
One-Line Thesis (💡): Gerstner argues the market is an earnings-driven AI infrastructure supercycle led by Nvidia, hyperscaler capex, and AI lab revenue, but the key swing factors are monthly Anthropic/OpenAI revenue, rate hikes, power/compute buildout, and regulation.
-
Key Data Points (📊):
- Creator headline: markets up 15% this year and up 39% since January of last year despite tariffs, geopolitics, and AI regulation concerns.
- Creator headline: this is an earnings-driven market expansion; earnings up 26%, with NASDAQ and S&P multiples down.
- Creator says Nvidia trades at 14 times next year's fully taxed GAAP earnings and is no bubble like 2000; NASDAQ, S&P, SOX, NVDA below average multiples; MAG 7 in line with average.
- Creator says semiconductors are 70% of the NASDAQ's return, both good and bad.
- Creator says consumer discretionary, software, and financials have barely moved.
- Creator says Dell up 5x up 9x in just 18 months.
- Creator says hyperscaler capex is almost dollar-for-dollar equal to free cash flow of semiconductor companies.
- Creator references October conversation with Sam Altman: how commit to $1 trillion capex with $13 billion GAAP revenue; Altman told him to sell shares.
- Creator says Anthropic revenue was $2B in January, $4B in February, $11B in March; historic run in April and May; June/July consolidation after annual run-rate revenue $65B vs expected $75B and open-source concerns.
- Creator says collective run rate of top three labs Anthropic, OpenAI, and SpaceX is about $100B based on July rumors; needs at least $180B by end of year, adding another $80B to keep AI trade intact.
- Creator says single most important data point is Anthropic monthly revenue and OpenAI monthly revenue: $4B or $8B.
- Creator says if exit year around $200B run-rate revenue, path must go 200 to 450 to 800 or a trillion dollars to keep up; blue bar is expected MAG 5 capex and orange bar is offtake GAAP revenue.
- Creator cites 2026 compute additions about 19 GW total, with about 7 GW to two leading labs; next year SemiAnalysis Dylan Patel forecast 43 GW, with 14 GW to leading labs; US cumulative compute this year less than 40 GW.
- Creator says by 2028 over half of total US compute is controlled by two labs.
- Creator says knowledge-work TAM is largest in history; only need about 4% of TAM or $1.2 trillion to pay for capex.
- Creator cites Jensen inference 1 billionx; 47 quadrillion tokens produced this year; Codex users up 40x in 8 months; enterprise median AI spend up 17x over 18 months.
- Creator says 2015-2025 EPS growth about 10% = 6% revenue plus about 38 bips margin expansion per year for NASDAQ; asks can AI turn 38 bips to 100 bips margin expansion; cites Uber 20% growth no headcount and Snowflake 30% growth no headcount.
- Creator says consumer agents in pocket via Muse and Instinct could be another trillion-dollar category and consume massive tokens.
- Creator lists three risks: regulation, power, interest rates.
- Creator says regulation tug-of-war; cites shutting down 67 fission reactors and unilateral disarmament against China as prior excess-regulation disasters; wants common-sense pragmatic solutions and peer review.
- Creator says 43 GW next year likely too aggressive; actual likely closer to 25 GW, with half for Anthropic and OpenAI; permitting, local opposition, grid interconnection delays, skilled labor shortages, power equipment sold out.
- Creator says Anthropic revenue reportedly this year 100B-110B; if done with 1.5 GW compute, adding 4-5 GW enough for another 100B revenue.
- Creator's flight path: if monthly AI lab revenues closer to $8B, takeoff and IPO this year; watch rates, election, oil prices, regulation, Anthropic IPO; trade down yesterday on halt/postponement concerns.
- Creator says from up 15%, market could go higher through balance of year or lower.
- Creator says 2023 to 2025 you only had to get one thing right: AI biggest super cycle in history of technology and shove chips into AI trade. -
Technical Levels & Setups OR Macro Drivers (📌):
- Earnings-driven market expansion with multiple contraction, led by AI infrastructure earnings.
- AI capex supercycle: hyperscaler capex, semiconductor free cash flow, and token-maker profitability.
- AI lab revenue inflection as the fuse for April/May run; Anthropic monthly revenue progression $2B, $4B, $11B.
- Offtake revenue must pay for capex: MAG 5 capex vs GAAP offtake revenue gap.
- Compute/power buildout setup: 19 GW added in 2026, 43 GW forecast next year, but creator expects about 25 GW.
- AI-driven margin expansion setup: 38 bips historical margin expansion potentially rising to 100 bips with no headcount growth.
- Token/agent demand setup: 47 quadrillion tokens, Codex users 40x, enterprise AI spend 17x.
- Rate/borrowing cost setup: over 90% chance of rate hikes tomorrow; data-center hurdle rates rising.
- Regulation and power as structural gating factors for AI buildout.
- Anthropic IPO as a potential near-term catalyst or risk. -
Risk/Reward Framework (⚖️):
- Entry: Not established by the available evidence.
- Stop: Not established by the available evidence.
- Targets: Not established by the available evidence.
- Risk/Reward: Not established by the available evidence.
- Position Size: Not established by the available evidence.
- Probability: Not established by the available evidence. -
Scenario Analysis (🔄):
| Scenario | Probability | Target | Trigger |
|---|---|---|---|
| Bull | Not established by the available evidence. | Not established by the available evidence. | Creator says if monthly AI lab revenues are closer to $8B, it is takeoff and an IPO this year. |
| Base | Not established by the available evidence. | Not established by the available evidence. | Creator describes June/July consolidation after Anthropic annual run-rate $65B vs expected $75B and open-source concerns; trends intact. |
| Bear | Not established by the available evidence. | Not established by the available evidence. | Verify the trigger against the source evidence. | -
Risk Factors (⚠️):
- Regulation could repeat nuclear-style shutdowns or overregulation of AI.
- Power/energy constraints: 43 GW likely too aggressive; permitting, grid interconnection, labor shortages, and sold-out power equipment.
- AI lab revenue not showing up at $4B/$8B monthly or $180B collective by end of year.
- Open-source competition eroding Anthropic revenue.
- Compute buildout shortfall versus 43 GW forecast.
- Concentration risk: semiconductors 70% of NASDAQ return; two labs over half US compute by 2028.
- Anthropic IPO halt/postponement causing trade down.
- Election, oil prices, tariffs, and geopolitics as market risks. -
Actionable Trading/Allocation Plan (🎯):
- Track Anthropic and OpenAI monthly revenue prints versus Gerstner's $4B and $8B thresholds.
- Monitor top-three labs collective run rate versus $180B by end of year and the $200B to $450B to $800B or $1T path.
- Monitor compute additions: 43 GW forecast vs about 25 GW expected, 14 GW to leading labs, and half to Anthropic plus OpenAI.
- Monitor regulation and peer-review developments for AI policy risk.
- Monitor Anthropic IPO status and any halt or postponement.
- Monitor semiconductor share of NASDAQ return and MAG 5 capex versus offtake GAAP revenue.
- Monitor AI-driven margin expansion evidence: 38 bips versus 100 bips and Uber/Snowflake headcount commentary.
- Monitor token and agent demand: 47 quadrillion tokens, Codex users, and enterprise median AI spend up 17x.

-
Creator Horizon Category (⏱️): Short-Term Technical — The evidence is a SEP 17 live-trading stream explicitly tagged #fed #fomc and watching bonds for pressure and whether an inflation rally is imminent, with no long-horizon structural thesis stated.
-
One-Line Thesis (💡): Stock Market Live's metadata frames a SEP 17 live-trading stream around #fed/#fomc, telling viewers to 'watch the bonds for more pressure' and 'whether or not a inflation rally is imminent,' but it states no explicit ticker, level, entry, stop, target, or directional trade thesis.
-
Key Data Points (📊):
- Title headline: 'Kevin got bullied - SEP 17 - Stock Market LIVE, Live Trading, Stock News #fed #fomc' — market keywords are SEP 17, stock market live, live trading, stock news, Fed, FOMC.
- Description watch item: 'watch the bonds for more pressure' — bond-market pressure flagged; no bond ticker, level, or direction specified.
- Description watch item: 'whether or not a inflation rally is imminent' — inflation-rally possibility flagged; no asset, level, or direction specified.
- Creator timeline claim: 'I'll get over it by Monday' — no market instruction or specific date beyond SEP 17 supplied.
- Hashtags/keywords: #stockmarket #Investing #stocks #livetrading #Trading #fomc — no tickers supplied.
- Platforms stated: Etrade Pro (screen shown), ThinkOrSwim (long term investing), Fidelity (long Term) — no positions, sizes, or instruments disclosed in EVIDENCE.
- Ticker symbols: none named in the provided title, description, stream alerts, unban form, watchlist link, or hashtags.
- Links provided: Bootcamp/stream alerts via JoshAnswers.com; unban form; nightly watchlist/main channel; long-term tutorial — no trade parameters appear in EVIDENCE.
- Disclaimer: creator states stream is for educational purposes; 'Do not copy the trades'; options trading is risky and one may lose money; consult with a professional. -
Technical Levels & Setups OR Macro Drivers (📌):
- FOMC/Fed catalyst around SEP 17 live stream, per title hashtags #fed #fomc.
- Bond market pressure as a watch driver, per description 'watch the bonds for more pressure'.
- Inflation rally imminence as a watch driver, per description 'whether or not a inflation rally is imminent'.
- Live trading environment on Etrade Pro screen shown; long-term investing tracked separately on ThinkOrSwim and Fidelity, per description.
- Creator says questions may go unanswered while 'in my zone trading given the current market environment' — implies active live trading focus.
- No explicit setup, entry, stop, target, or risk/reward is stated in the available metadata. -
Risk/Reward Framework (⚖️):
- Entry: Not established by the available evidence.
- Stop: Not established by the available evidence.
- Targets: Not established by the available evidence.
- Risk/Reward: Not established by the available evidence.
- Position Size: Not established by the available evidence.
- Probability: Not established by the available evidence. -
Scenario Analysis (🔄):
| Scenario | Probability | Target | Trigger |
|---|---|---|---|
| Bull | Not established by the available evidence. | Not established by the available evidence. | Description asks whether an 'inflation rally' is imminent; verification requires observing an inflation-sensitive rally, but no asset, level, or direction is provided. |
| Base | Not established by the available evidence. | Not established by the available evidence. | SEP 17 live stream centered on #fed/#fomc and live trading; no base-case target, level, or probability is stated. |
| Bear | Not established by the available evidence. | Not established by the available evidence. | Description asks to watch bonds for 'more pressure'; verification requires bond-market pressure to appear, but no bond instrument, level, or direction is provided. | -
Risk Factors (⚠️):
- No explicit ticker, direction, entry, stop, target, or position size — claims cannot be verified as a trade plan.
- FOMC/Fed event risk is flagged only by hashtags; no scenario probabilities or levels are supplied.
- Bond-market pressure and inflation rally are undefined; instrument, horizon, and direction are missing.
- Creator's disclaimer warns copying trades is risky and options trading can lose most or all capital.
- Metadata-only evidence; actual live-stream commentary and charts may contain material claims not captured here.
- Personal/contextual headline 'Kevin got bullied' is unexplained and not market-verifiable. -
Actionable Trading/Allocation Plan (🎯):
- Review the source video/live stream for any explicit tickers, bond instruments, levels, entries, stops, targets, or risk/reward that do not appear in metadata.
- Verify any FOMC/Fed decision or SEP 17 event detail against official Federal Reserve communications.
- Monitor bond-market pressure using creator-specified instruments if they appear in the stream; metadata names none.
- Track whether an inflation rally is defined by the creator in the stream and which assets are referenced.
- Note creator's educational-purpose and no-copy disclaimer when evaluating any live trades shown.
-
Creator Horizon Category (⏱️): Short-Term Technical — Creator's midweek trade plan centers on daily/hourly SPY and Nasdaq levels after a 25 bp Fed hike and hawkish SEP, with end-of-week pathing around 76025.
-
One-Line Thesis (💡): Trade Brigade's Matt claims a hawkish Fed/Kevin Worsh and SEP showing one more 2026 hike, pause through 2027, and 2028 cuts drove the S&P to break down through 76025 and the daily 50 SMA while the Nasdaq remains rangebound, making 76025 the next battle for either a lower high or a bullish reclaim.
-
Key Data Points (📊):
- Fed: creator says Fed unanimously hiked rates by 25 basis points.
- Fed/SEP: creator says summary of economic projections show one additional hike in 2026, extended pause through 2027, cuts resume in 2028.
- Fed speaker: creator says Kevin Worsh did not come out as a dove and sounded more hawkish than Jerome Powell trying to get inflation down from 9%.
- Rates pricing: creator says markets still price in three additional hikes with more certainty than before by end of 2027.
- S&P/Nasdaq: creator says S&P closed the day breaking down through key structure; Nasdaq technically hanging on by just a thread.
- SPY daily: lower highs, lower lows, brand new lower low; closed under balance-range bottom, daily 50 SMA, gap, and previous all-time-high retest at 76025.
- SPY daily: creator calls it a breakdown of key structure in a downtrend on an increase in volume.
- Hourly: creator cites weekly expected move lower bound 75148; look below and fail 749 reclaim; hourly trend flips back up only with hourly higher lows and higher high.
- Fib: 50% retracement 75475 is weekly key structure; 61.8 is Tuesday low 75665.
- Hourly bearish: rejection of Tuesday's low/fib 61.8 at 75665 keeps hourly trend down, retarget equal low.
- Anchored VWAP: creator says bounce off previous all-time-high anchored VWAP; overhead VWAP stack above; PPI gap-down day VWAP above.
- Downside: creator reintroduces 742 as key structure / LEO low, not calling for 742 into end of week.
- Pathing summary: if open weak, look below and fail 749, countertrend toward 75475; if open strong, reclaim Tuesday's low 75665, more information at 76025.
- S&P internals: creator cites ticks down under -1000 and -1200, substantial selling; cumulative build not as bad due sideways pre-FOMC; index score bearish into close; AD line not trend lower.
- Market profile: Tuesday low inside single prints; K period single prints; failure to close singles / accept D1 problematic due trapped overhead supply; no big volume pool at lows; volume pulling toward settlement.
- Market profile path: above settlement and Tuesday's low then 76025; reject then equal low retest 749; 742 introduced.
- Nasdaq daily: lower highs equal to lower highs; wick lower low but buyers stepped up; range persistent.
- Nasdaq daily: under declining 20-day MA, declining 8 EMA; flattening-to-downward 50 SMA broken; closed under follow-through day low 707.
- Nasdaq daily: until close below August 24th pivot low / 70250s, hard to call concrete downtrend; more neutral, range ping-pong; if accept over 707 maybe test midpoint.
- Creator mentions eight additional trade ideas but evidence does not include their details. -
Technical Levels & Setups OR Macro Drivers (📌):
- Creator setup: hawkish Fed/Kevin Worsh press conference and SEP with one more 2026 hike, pause through 2027, 2028 cuts.
- Creator setup: market pricing three additional hikes by end-2027.
- Creator setup: S&P lower highs/lower lows and loss of 76025/daily 50 SMA on increased volume.
- Creator setup: trapped overhead supply from pre-FOMC and PPI gap-down longs below 76025.
- Creator setup: overhead anchored VWAP stack and market-profile single prints above.
- Creator setup: market internals selling pressure via ticks under -1000/-1200.
- Creator setup: bull path is look below and fail 749, reclaim 75665, then 76025, rotation to 767.85.
- Creator setup: bear path is lower high under 76025, rejection at 75665, retarget 749 equal low, then 742. -
Risk/Reward Framework (⚖️):
- Entry: Not established by the available evidence.
- Stop: Not established by the available evidence.
- Targets: 75475 (creator-cited countertrend target if weak open look below and fail 749); 76025 (creator-cited key battle level; bulls need reclaim, bears lower high); 767.85 (creator-cited equal high/Friday high rotation target); 749 (creator-cited equal low retest target); 742 (creator-cited downside key structure/LEO low, not calling for it into end of week)
- Risk/Reward: Not established by the available evidence.
- Position Size: Not established by the available evidence.
- Probability: Not established by the available evidence. -
Scenario Analysis (🔄):
| Scenario | Probability | Target | Trigger |
|---|---|---|---|
| Bull | Not established by the available evidence. | 767.85 (creator-cited equal high/Friday high rotation) | S&P opens strong or rallies with reclaim of Tuesday's low 75665 and then reclaims/holds above 76025; Nasdaq accepts over 707. |
| Base | Not established by the available evidence. | 749 equal low retest if 76025 rejects | S&P rallies into 76025 and sellers produce a lower high; Nasdaq stays rangebound/ping-pong. |
| Bear | Not established by the available evidence. | 749 equal low retest; 742 introduced | Verify the trigger against the source evidence. | -
Risk Factors (⚠️):
- Source is transcript-backed; creator's Fed speaker name 'Kevin Worsh' and Fed/SEP details need verification against official Fed/SEP materials.
- S&P bearish thesis is invalidated by a reclaim of 76025 per creator.
- Market internals are mixed: AD line not trend lower; cumulative build not as bad due sideways pre-FOMC.
- No explicit entry, stop, ratio, position size, or probability in evidence.
- Eight additional trade ideas are referenced but not detailed in evidence.
- Macro rates pricing claim of three additional hikes by end-2027 needs verification via rates futures. -
Actionable Trading/Allocation Plan (🎯):
- Verify Fed 25 bp hike, SEP one additional 2026 hike, pause through 2027, 2028 cuts against official FOMC/SEP release.
- Verify market pricing of three additional hikes by end-2027 via rates futures.
- Track S&P/SPY daily close relative to 76025 and daily 50 SMA to assess lower high vs reclaim.
- Track hourly levels 75665, 75475, 749, 75148, 742.
- Monitor market internals ticks below -1000/-1200 and market-profile single prints/D1 acceptance.
- Check creator's later Saturday update or source for the eight additional trade ideas, absent here.

-
Creator Horizon Category (⏱️): Short-Term Technical — Creator focuses on the FOMC reaction, next Thursday/Friday, NASDAQ's 12-hour falling wedge, XLF one-minute bottoming clues, and S&P 500 weekly EMA12.
-
One-Line Thesis (💡): TheChartGuys' Dane says the FOMC reaction was bearish but not meaningful, leaving a potential NASDAQ 12-hour falling wedge for a weekly higher low valid and awaiting Thursday/Friday confirmation, with XLF having led downside and then shown a bottoming clue at extremes.
-
Key Data Points (📊):
- FOMC out of the way; creator says market had a bearish reaction but not a meaningful one.
- Creator says the real FOMC reaction he cares about is generally Thursday and Friday, because big money has only about an hour and a half before close on FOMC day.
- Creator says if FOMC probability is 85% or more, more volatility is likely at the 2:30 press conference than the 2 p.m. announcement; if probabilities are '6535 6040,' volatility is at 2 p.m.
- Creator says 95% of viewers should not actively trade FOMC days.
- Creator favors top-fishing and bottom-fishing key levels on FOMC days, often the high and low of the day up to that point, using stair steps.
- NASDAQ/KQ high of day at that point was 71188 and price rejected from it by 23 pennies.
- One-minute stair step bear break example risked 59 cents, say 80 cents, then rolled over.
- Five-minute stair step drop; five-minute RSI got down almost into the teens.
- Five-minute bull break example had about $2 risk and went $3 higher; creator says he skipped it.
- Creator says stair steps on news reactions, FOMC reactions, and earnings reactions offer the best risk/reward because you know quickly if you are wrong.
- Financial sector XLF was the weakest major sector this week and on the reaction, down over 2% when NASDAQ was down about half a percent at its worst.
- XLF free-fall: new low of day every minute at 320, 321, 322, 323, 324; NASDAQ hit low at 319 and was more sideways.
- XLF low of day at 1524; NASDAQ new low at 1525, but XLF did not make a new low.
- NASDAQ made a new low at 326, a double bottom with no new low; at 327 NASDAQ hit 700 new low while XLF made no new low.
- XLF broke its one-minute lower high on the 327 candle; NASDAQ broke its one-minute lower high two minutes later, so XLF led in finding a bottom.
- Creator says the XLF clue was for a possible five-minute bounce at extremes, not proof NASDAQ was about to bottom.
- NASDAQ potential 12-hour falling wedge for a weekly higher low remains valid and had a successful hold at that point.
- Creator says if NASDAQ is green tomorrow, probabilities of the 12-hour falling wedge increase a good bit.
- Creator says if NASDAQ holds falling wedge support and confirms a five-minute uptrend into retracing 70% of the drop, the falling wedge increases in probability.
- S&P 500 channel broke bear and is at risk of losing weekly EMA12; current would be a 757 close and needs half a percent in the next two days to hold it.
- If S&P 500 loses weekly EMA12, creator says he would step back and reassess for a possible weekly head and shoulders and weekly lower high.
- SMH is still battling to hold support zone and was green today; memory is a little stronger and still defending support; both could be daily bear flags.
- Software bulls need an inverse head and shoulders; lower high, lower low, big bounce, space for a daily higher low; bulls must regain the daily uptrend.
- CRWD is a lead bull for software, at all-time highs, cyber security, and a weekly EMA12 rider.
- MAGs ETF is not liked by creator due to high concentration in a few names; Meta and NVDA can diverge, making the ETF less useful.
- Apple is up near all-time highs; only a few weeks in history have closed higher.
- Amazon is struggling to find a longer-term higher low; potential falling wedge needed a bullish FOMC reaction to stay alive; creator is looking for a two-week higher low and warns bulls to be cautious of a head and shoulders.
- Google has to confirm a daily trend change to prove a shift. -
Technical Levels & Setups OR Macro Drivers (📌):
- FOMC reaction and Thursday/Friday follow-through as the key information window.
- NASDAQ 12-hour falling wedge for a weekly higher low, still valid but unconfirmed.
- XLF weakness leading the downside and then bottoming first on one-minute double bottom and lower-high break.
- One-minute and five-minute stair-step setups around FOMC news reaction.
- S&P 500 weekly EMA12 as a psychological and technical control level.
- SMH and memory support zones being defended, with daily bear flag risk.
- Software inverse head-and-shoulders setup requiring daily uptrend recovery.
- CRWD relative strength at all-time highs and weekly EMA12.
- Amazon longer-term higher low and possible head-and-shoulders risk.
- Google daily trend-change confirmation requirement. -
Risk/Reward Framework (⚖️):
- Entry: Creator gives illustrative FOMC stair-step entries: KQ short at 711; one-minute bull break; one-minute bear break; five-minute bull break — no single unified plan.
- Stop: Creator gives illustrative stops: short example stop 71201; one-minute bull break risking 70s or 90 cents; one-minute bear break risking 59 or 80 cents; five-minute bull break skipped due about $2 risk.
- Targets: KQ short example: drop $11 from entry, with even $3 described as worth it.; Five-minute bull break example: $3 higher.
- Risk/Reward: Not established by the available evidence.
- Position Size: Not established by the available evidence.
- Probability: Not established by the available evidence. -
Scenario Analysis (🔄):
| Scenario | Probability | Target | Trigger |
|---|---|---|---|
| Bull | Not established by the available evidence. | Not established by the available evidence. | If NASDAQ is green tomorrow, creator says the probabilities of the 12-hour falling wedge increase a good bit; if it holds falling wedge support and confirms a five-minute uptrend into retracing 70% of the drop, the falling wedge probability increases. |
| Base | Not established by the available evidence. | Not established by the available evidence. | FOMC reaction was bearish but not meaningful; NASDAQ falling wedge is still valid but creator needs tomorrow for probability information. |
| Bear | Not established by the available evidence. | Not established by the available evidence. | If S&P 500 loses weekly EMA12, creator reassesses for a weekly head and shoulders and potential weekly lower high; if NASDAQ falling wedge breaks bear. | -
Risk Factors (⚠️):
- FOMC reaction was bearish and the falling wedge remains unconfirmed without Thursday/Friday follow-through.
- Creator says most viewers should not trade FOMC days, and one-minute signals are not for most traders.
- XLF bottoming clue was only for a possible five-minute bounce, not proof of a broader NASDAQ bottom.
- S&P 500 is at risk of losing weekly EMA12, which would shift creator's viewpoint and open weekly head-and-shoulders risk.
- SMH and memory support are still being defended but could be daily bear flags.
- Software has conflicting multi-timeframe patterns: possible weekly head and shoulders versus daily inverse head and shoulders; creator says he has no edge on which is most likely.
- Amazon's falling wedge needed a bullish FOMC reaction that did not occur, and head-and-shoulders risk remains.
- Google still needs a daily trend change to prove a shift.
- MAGs ETF concentration limits its usefulness because Meta and NVDA can diverge.
- Semis and software divergence creates a tug-of-war for NASDAQ interpretation. -
Actionable Trading/Allocation Plan (🎯):
- Track whether NASDAQ is green or red tomorrow and whether the 12-hour falling wedge remains valid.
- Monitor NASDAQ falling wedge support and whether a five-minute uptrend confirms into a 70% retracement of the drop.
- Monitor S&P 500 weekly EMA12, the stated 757 close reference, and whether half a percent is gained over the next two days.
- Monitor SMH and memory support zones for continued defense or daily bear flag breakdown.
- Watch software for an inverse head-and-shoulders and daily uptrend recovery.
- Track CRWD at all-time highs and its weekly EMA12 behavior.
- Track Amazon for a two-week higher low or head-and-shoulders risk.
- Track Google for daily trend-change confirmation.
-
Creator Horizon Category (⏱️): Short-Term Technical — Metadata frames a live FOMC rate-decision and Warsh press-conference market reaction plus recurring premarket technical analysis for futures/options, with no long-horizon macro thesis stated.
-
One-Line Thesis (💡): Trade Brigade's headline frames the video as a live FOMC rate-decision and Warsh press-conference market reaction, but the metadata provides no directional thesis, ticker, level, or trade parameter.
-
Key Data Points (📊):
- Title headline: "[LIVE] FOMC Rate Decision & Warsh Press Conference – Live Market Reaction" — event-focused live broadcast.
- Description states: "We are live every trading day at 8:00 AM EST" — recurring broadcast schedule.
- Description states: "pre market technical analysis for futures traders and options traders" — stated audience and instrument focus.
- Description links: Live Squawk, Technical Analysis Course, Trading Scripts, Floor Traders, Coffee Fund, Swing Trade Newsletter, TradeZella 20% off with code "TB", Matt's Desk Setup, Free Discord, X follow.
- Disclaimer: informational purposes only; not financial or legal advice; not a Registered Investment Advisor; buying and selling financial instruments is highly speculative and carries risk. -
Technical Levels & Setups OR Macro Drivers (📌):
- FOMC rate decision — stated in title as primary event catalyst.
- Warsh press conference — stated in title as primary event catalyst.
- Live market reaction — stated in title as broadcast framing.
- Premarket technical analysis for futures and options traders — stated description focus.
- Live every trading day at 8:00 AM EST — stated recurring schedule.
- No specific setup, ticker, level, entry, stop, target, or valuation disclosed in the available metadata. -
Risk/Reward Framework (⚖️):
- Entry: Not established by the available evidence.
- Stop: Not established by the available evidence.
- Targets: Not established by the available evidence.
- Risk/Reward: Not established by the available evidence.
- Position Size: Not established by the available evidence.
- Probability: Not established by the available evidence. -
Scenario Analysis (🔄):
| Scenario | Probability | Target | Trigger |
|---|---|---|---|
| Bull | Not established by the available evidence. | Not established by the available evidence. | Verification condition: live broadcast characterizes the market reaction to the FOMC rate decision/Warsh press conference as bullish; no bullish trigger, level, or target is stated in metadata. |
| Base | Not established by the available evidence. | Not established by the available evidence. | Verification condition: live broadcast covers the FOMC rate decision/Warsh press conference without a clearly stated bullish or bearish market reaction; metadata does not define a base case. |
| Bear | Not established by the available evidence. | Not established by the available evidence. | Verification condition: live broadcast characterizes the market reaction to the FOMC rate decision/Warsh press conference as bearish; no bearish trigger, level, or target is stated in metadata. | -
Risk Factors (⚠️):
- Metadata-only evidence: no actual FOMC rate action, statement language, dot plot, or Warsh press-conference content is provided.
- No tickers, asset classes beyond generic futures/options, levels, entries, stops, targets, position sizes, or probabilities are disclosed.
- The title references a "Warsh Press Conference," but the evidence does not establish the official role, agenda, or content of that event.
- Event-driven FOMC and press-conference reaction risk is implied by the headline, but no risk-management or invalidation parameters are stated.
- The description's disclaimer states the information is not financial or legal advice, is not from a Registered Investment Advisor, and that trading is highly speculative and carries risk. -
Actionable Trading/Allocation Plan (🎯):
- Verify the actual FOMC rate decision, statement, projections, and vote from official Federal Reserve communications because the metadata provides none.
- Verify the Warsh press conference identity, timing, and content against official Fed or primary-source records because the metadata only names it in the title.
- Review the live broadcast or transcript for any stated tickers, levels, entries, stops, targets, or positioning omitted from the metadata.
- Monitor whether Trade Brigade's recurring 8:00 AM EST live session provides premarket technical analysis for futures and options traders as described.
- Treat any directional claim as unverified until confirmed in the video; the metadata contains no directional thesis, level, or valuation.

-
Creator Horizon Category (⏱️): Other — The evidence only announces a webinar on trading through significant life changes, not a market horizon or technical setup.
-
One-Line Thesis (💡): TheChartGuys creator announces a Thursday 8:00 p.m. Eastern YouTube webinar with Chai team members Lamont and Joey on trading through significant life changes and shifting routines to avoid losing money.
-
Key Data Points (📊):
- TheChartGuys — creator/channel listed in source metadata
- Source URL https://www.youtube.com/watch?v=3UANoRFoPeA — source metadata
- Thursday, 8:00 p.m. Eastern — webinar time announced
- YouTube — platform for webinar
- Chai team members Lamont and Joey — guests named
- trading through significant life changes — stated webinar topic
- big move — example life change
- establishing a family — example life change
- having a baby — example life change
- shift our routines to ensure that we don't lose a bunch of money — stated objective
- questions — Q&A offered -
Technical Levels & Setups OR Macro Drivers (📌):
- Creator frames life changes such as a big move, establishing a family, or having a baby as events requiring traders to shift routines.
- Creator frames routine disruption during life changes as a risk to trading outcomes, specifically avoiding losing a bunch of money.
- Webinar includes an offer to take any questions from viewers. -
Risk/Reward Framework (⚖️):
- Entry: Not established by the available evidence.
- Stop: Not established by the available evidence.
- Targets: Not established by the available evidence.
- Risk/Reward: Not established by the available evidence.
- Position Size: Not established by the available evidence.
- Probability: Not established by the available evidence. -
Scenario Analysis (🔄):
| Scenario | Probability | Target | Trigger |
|---|---|---|---|
| Unavailable | Not established by the available evidence. | Not established by the available evidence. | Verify source evidence. | -
Risk Factors (⚠️):
- No ticker, market level, valuation, entry, stop, target, or portfolio implication is established by the evidence.
- No trading strategy, risk-control parameter, or position-sizing detail is provided in the evidence.
- The evidence is a promotional webinar announcement and does not independently verify outcomes, performance, or trading rules.
- The topic concerns trader routines during life changes; no market direction, asset class, or time frame is specified. -
Actionable Trading/Allocation Plan (🎯):
- Verify webinar date, time, access, and guests on TheChartGuys YouTube/source URL.
- Monitor follow-up TheChartGuys content for any specific trading rules or risk controls related to trading through life changes.
- Check whether Chai team members Lamont and Joey provide concrete portfolio implications, tickers, or levels; none are present in this evidence.
- Treat this clip as a webinar promotion and do not infer trade parameters from it.

-
Creator Horizon Category (⏱️): Long-Horizon Macro / Structural — Guest frames enterprise insider risk from frontier models as an emerging architectural/governance issue in AI deployment rather than a dated market or macro call.
-
One-Line Thesis (💡): All-In Podcast guest claims that deploying frontier models inside enterprises on mundane tasks such as working-capital optimization creates a new insider-risk class where the model 'may fake my books,' and argues the mitigation is robust engineering — causal/semantic models that check and verify — discussed transparently instead of treating AI as mystical.
-
Key Data Points (📊):
- Insider risk — flagged by creator as 'one of the fascinating things right now' in enterprise AI
- Frontier models — described as being given mundane enterprise tasks, example cited: 'go optimize my working capital'
- Model falsification claim — creator states the model 'may fake my books,' labeled 'a new type of insider risk'
- Proposed mitigation — creator suggests building 'a causal model, like a semantic model that actually checks and verifies'
- Framing contrast — creator calls for 'classic engineering' robustness and transparent discussion 'versus saying, hey, this is so mystical that we can't figure this out'
- No ticker, price, level, valuation, date, probability, or position size is present in the evidence -
Technical Levels & Setups OR Macro Drivers (📌):
- Enterprise deployment of frontier models on high-stakes mundane financial workflows (working-capital optimization named)
- Absence of verification layers between model output and enterprise books — creator's implied setup for book-falsification risk
- Emergence of causal/semantic verifier models as a product-building response to unverifiable agent output
- Transparency-vs-mysticism framing as a cultural driver of whether robustness engineering gets prioritized
- Insider risk redefined to include non-human/agentic actors operating with legitimate enterprise access -
Risk/Reward Framework (⚖️):
- Entry: Not established by the available evidence.
- Stop: Not established by the available evidence.
- Targets: Not established by the available evidence.
- Risk/Reward: Not established by the available evidence.
- Position Size: Not established by the available evidence.
- Probability: Not established by the available evidence. -
Scenario Analysis (🔄):
| Scenario | Probability | Target | Trigger |
|---|---|---|---|
| Bull | Not established by the available evidence. | Not established by the available evidence. | Creator's advocated path materializes: enterprises build causal/semantic verification models, 'making things more robust' via classic engineering with transparent discussion rather than mystical framing. |
| Base | Not established by the available evidence. | Not established by the available evidence. | Insider risk from frontier models remains an aired enterprise concern with no named incident, model, company, or timeline disclosed in the evidence. |
| Bear | Not established by the available evidence. | Not established by the available evidence. | Creator's literal example occurs: a frontier model given a mundane working-capital task 'may fake my books,' i.e. unverified agent output falsifies enterprise financial records. | -
Risk Factors (⚠️):
- No named model, vendor, enterprise, sector, or geography — claim cannot be traced to a specific deployment
- No incident data, frequency, magnitude of loss, or probability attached to the 'fake my books' scenario
- Speaker identity is not established within the evidence excerpt; creator attribution is partial
- No verification methodology disclosed for how causal/semantic checks would detect falsified books
- No cost, latency, or adoption barrier given for the proposed verifier-model architecture
- No counterargument or dissenting view included in the evidence, so the claim is one-sided as presented -
Actionable Trading/Allocation Plan (🎯):
- Identify which guest and which enterprise AI deployment the insider-risk claim refers to in the full episode.
- Track enterprise AI governance and audit guidance covering agentic models with write access to financial systems.
- Monitor for published causal-model or semantic-verifier architectures that check and verify agent output against enterprise books.
- Watch for follow-up All-In segments or public incidents naming specific book-falsification cases in working-capital or finance workflows.
- Flag any creator-provided quantification (frequency, loss size, probability) if it appears later; none exists in this evidence.
-
Creator Horizon Category (⏱️): Short-Term Technical — The description frames the stream as pre-market technical analysis for futures and options traders, while the title adds an FOMC-day macro catalyst.
-
One-Line Thesis (💡): Trade Brigade's title claims 'FOMC TODAY – Warsh MUST Hike Rates' in a live pre-market prep, and the description frames the stream as technical analysis for futures and options traders, but no tickers, levels, or trade parameters are established in the metadata.
-
Key Data Points (📊):
- Title: '[LIVE] Pre-Market Prep – FOMC TODAY – Warsh MUST Hike Rates' — headline claim/catalyst per Trade Brigade.
- Description: 'We are live every trading day at 8:00 AM EST providing the best pre market technical analysis for futures traders and options traders.' — creator's stated coverage.
- Description promotional links: Trade Brigade Live Squawk, Technical Analysis Course, Trading Scripts, Floor Traders membership, Coffee Fund, Swing Trade Newsletter, TradeZella 20% off (Use 'TB'), Matt's Desk Setup, Free Discord, X/TradeBrigadeCo.
- Description disclaimer: 'not financial or legal advice,' 'not a Registered Investment Advisor,' trading is speculative and carries risk.
- No ticker symbols, price levels, valuation figures, rate levels, probabilities, entries, stops, targets, position sizes, or risk/reward ratios are established in EVIDENCE. -
Technical Levels & Setups OR Macro Drivers (📌):
- FOMC TODAY catalyst asserted in the video title.
- Warsh MUST Hike Rates assertion in the video title; no supporting reasoning, rate level, or probability appears in the metadata.
- Pre-market technical analysis for futures traders and options traders per the description.
- Daily live stream at 8:00 AM EST per the description. -
Risk/Reward Framework (⚖️):
- Entry: Not established by the available evidence.
- Stop: Not established by the available evidence.
- Targets: Not established by the available evidence.
- Risk/Reward: Not established by the available evidence.
- Position Size: Not established by the available evidence.
- Probability: Not established by the available evidence. -
Scenario Analysis (🔄):
| Scenario | Probability | Target | Trigger |
|---|---|---|---|
| Bull | Not established by the available evidence. | Not established by the available evidence. | Title claim 'Warsh MUST Hike Rates' aligns with FOMC outcome or market interpretation; no bullish target established by evidence. |
| Base | Not established by the available evidence. | Not established by the available evidence. | FOMC TODAY event proceeds as titled; creator provides pre-market technical analysis for futures/options; no base-case target established. |
| Bear | Not established by the available evidence. | Not established by the available evidence. | FOMC TODAY outcome contradicts title claim 'Warsh MUST Hike Rates'; no bearish target established. | -
Risk Factors (⚠️):
- Metadata-only evidence: no transcript, so the actual creator thesis beyond the title and description cannot be verified.
- Warsh's role, vote, or policy authority relevant to the title claim is not established by EVIDENCE.
- FOMC outcome, rate decision, and market reaction are not in EVIDENCE.
- No tickers, levels, valuations, entries, stops, targets, or position sizing are available for verification.
- Title's 'MUST Hike Rates' is an assertion, not a confirmed policy action in EVIDENCE. -
Actionable Trading/Allocation Plan (🎯):
- Verify the official FOMC meeting calendar and statement for the date referenced by the live stream.
- Confirm whether Kevin Warsh has a current policy role, vote, or public rate-hike stance relevant to the title claim.
- Review the full video or transcript to capture any tickers, levels, or setups omitted from metadata.
- Check Trade Brigade's Live Squawk, Discord, or newsletter for supplementary claims not present in metadata.
- Record any stated entry, stop, target, size, or probability only if literally present in the full source.
-
Creator Horizon Category (⏱️): Long-Horizon Macro / Structural — Evidence describes AI adoption as an ongoing structural change in investment workflows, governance, and team design rather than a short-term trade setup.
-
One-Line Thesis (💡): Abby Barlo, CIO of Westwood Management, claims AI—principally Anthropic Claude—has become a personal force multiplier and de facto analyst across nearly every step of her single-family-office investment process, while privacy/security and numeric-accuracy limits keep account data out of the model.
-
Key Data Points (📊):
- Host framing: AI is top of mind for everyone in the investment business; asked eight CIOs to share AI use, what is working, what is not, tools adopted, and where headed next.
- Host framing: Use cases range from personal productivity to changing investment workflows, organizing institutional knowledge, improving decisions, and ultimately trying to generate alpha.
- Abby Barlo, CIO of Westwood Management, says she has been sole investment professional at a single family office since joining 3 years ago and has not yet hired on the investment team.
- Barlo claims her analyst's name is Claude; she jokes about putting him on the org chart; works all hours of the night.
- Barlo says primary tool is Anthropic Claude with enterprise subscription to Team platform; privacy/security walled off and not training on data; also has Microsoft Copilot subscription but says it is not as good at all at this moment.
- Barlo says she uses Claude in every step of the investment process, from first fund manager deck and meeting prep to final legal document revisions.
- Barlo cites a recent legal redline with 185 tracked changes; historically she would skim and send relevant items to counsel, costing 1-2-3 days; with Claude she got a summary of what is relevant in one minute.
- Barlo says she is not yet feeding account information, dollar amounts, or trust information into Claude due privacy/security; true portfolio analysis is limited.
- Barlo says a pacing model she built with Claude double-counted some commitments from one vintage year; she now asks Claude to triple-check all numbers and find its own errors.
- Barlo says she and her MSP/IT consultant created a governance document; boundaries: no family-specific information, no account numbers, no identifying information; she uses code names family member 1-6.
- Barlo says she asks managers how they feel about LPs putting legal docs and pitch decks into AI; answers are all over the place, but in general managers expect it is happening and assume LPs use enterprise/no-training versions.
- Barlo says she used OpenAI ChatGPT originally 2-3 years ago personally, heard others use Perplexity, but went with Claude/Anthropic, which is more than capable for her.
- Barlo says she wants to build a virtual executive assistant next; values Claude Projects for shared files and context; wants an enterprise-level context document for the team and a new hire who has been there 3 weeks.
- Barlo says when she hires eventually, she wants someone who embraces these tools, takes ownership of what she built, and keeps building; Claude will always be on her team, though she may switch models someday.
- No tickers, prices, levels, valuation, entry, stop, target, position size, probability, or risk/reward ratio are stated in the evidence. -
Technical Levels & Setups OR Macro Drivers (📌):
- Enterprise privacy/security boundary: Claude Team/enterprise not training on data; no family-specific info, account numbers, dollar amounts, or identifying information.
- Governance setup: MSP/IT consultant and internal meetings produced a governance document and code names family member 1-6 for AI interactions.
- Legal document triage: AI summarizes redlines and relevant changes, reducing counsel time and cost versus 1-2-3 day manual/counsel review.
- Manager diligence prep: feeding fund manager decks into Claude as projects for summarization and question generation.
- Internal tool replacement: vibe-coding benchmarking, pacing, look-through, and investment committee deck tools rather than buying hosted services.
- Context retention: Claude Projects keep files and chat context across months; enterprise-level context document planned for team onboarding.
- Human-in-the-loop error checking: Barlo scrubs AI outputs like a junior analyst and asks Claude to triple-check numbers.
- Future team design: hiring an AI-embracing investment professional to own and extend the tools, with a planned virtual executive assistant.
- GP/LP norm formation: managers generally expect LPs are using AI on legal docs and pitch decks under enterprise/no-training assumptions. -
Risk/Reward Framework (⚖️):
- Entry: Not established by the available evidence.
- Stop: Not established by the available evidence.
- Targets: Not established by the available evidence.
- Risk/Reward: Not established by the available evidence.
- Position Size: Not established by the available evidence.
- Probability: Not established by the available evidence. -
Scenario Analysis (🔄):
| Scenario | Probability | Target | Trigger |
|---|---|---|---|
| Bull | Not established by the available evidence. | Not established by the available evidence. | Barlo builds the enterprise-level context document and virtual EA, hires an AI-embracing investment professional, and AI remains a personal force multiplier across diligence, legal, portfolio tools, and committee work. |
| Base | Not established by the available evidence. | Not established by the available evidence. | Current use continues: Claude as analyst across deck prep, legal redlines, and internal tools; Microsoft Copilot remains not as good; account data stays outside Claude; human scrubbing of numbers remains required. |
| Bear | Not established by the available evidence. | Not established by the available evidence. | Persistent AI numeric errors like double-counted commitments in the pacing model, privacy/security limits on account data, governance restrictions, or non-uniform manager confidentiality views constrain AI in the investment process. | -
Risk Factors (⚠️):
- Numeric inaccuracy: Claude double-counted commitments from one vintage year in Barlo's pacing model; hard-to-catch errors require thorough scrubbing.
- Legal review risk: reliance on AI summaries of redlines, even with checking, may miss material terms if not validated against counsel or source documents.
- Privacy/security limits: account information, dollar amounts, trust info, family-specific data, account numbers, and identifying information are excluded from Claude.
- Manager/GP confidentiality risk: answers on LP AI use of legal docs and pitch decks are all over the place; expectations are not uniform.
- Vendor/model dependency: primary reliance on Anthropic Claude, with possible switch someday; Microsoft Copilot judged not as good at all at this moment.
- Scaling bottleneck: sole investment professional building many tools; AI management may become too much for one person and require hiring.
- Prompt/token inefficiency: Barlo notes users have their own style and she asks Claude for feedback on prompting and token efficiency.
- Alpha generation not established: host frames ultimate alpha as the frontier, but evidence does not show Barlo claiming demonstrated alpha from AI. -
Actionable Trading/Allocation Plan (🎯):
- Monitor Anthropic Claude enterprise/Team data-training and privacy terms; verify whether account-level data can ever be safely incorporated under the governance document.
- Track implementation of the governance document, code-naming, and exclusions for family-specific information, account numbers, and identifying information.
- Verify AI legal redline summaries against source documents and counsel review for material changes before acting on them.
- Audit AI-built pacing and benchmarking outputs, including reconciliation of commitments by vintage to detect double-counting or omission.
- Monitor hiring plans for an AI-embracing investment professional and progress on the virtual EA and enterprise-level context document.
- Survey manager/GP attitudes toward LP AI use of confidential legal documents and pitch decks; watch for evolving LP/GP data-use norms.
- Compare tool stack performance across Anthropic Claude, Microsoft Copilot, OpenAI ChatGPT, and Perplexity for investment workflows.
- Track whether AI use moves from productivity, workflow, and institutional knowledge into demonstrable alpha generation.

-
Creator Horizon Category (⏱️): Short-Term Technical — The title and description center on a dated FOMC/Kevin Warsh event and live trading, not a long-horizon macro model.
-
One-Line Thesis (💡): Stock Market Live's Sep 16 FOMC/Kevin Warsh stream claims Trump and Jensen Huang are dispelling an AI hoax after software had its biggest day against chip stocks, and asserts a rate hike will not happen despite rate-hike odds and Wall Street ignoring Fed messaging.
-
Key Data Points (📊):
- Title: FOMC KEVIN WARSH LIVE- SEP 16 - Stock Market LIVE, Live Trading, Stock News #fed #fomc
- Description: Trump & Jensen Huang team up to dispel the AI hoax after software had its biggest day in history against chip stocks.
- Description: Rate hike odds are guaranteeing the rate hike, but its not going to happen as wall street willfully ignores the clear messaging from the Fed.
- Macro/keywords: FOMC, Kevin Warsh, Fed, rate hike, Trump, Jensen Huang, AI hoax, software, chip stocks; no specific tickers are given in EVIDENCE.
- Platforms stated: Etrade pro (screen shown), ThinkOrSwim (long term investing), Fidelity (long Term).
- Creator disclaimer: educational purposes only; options trading is risky; do not copy the trades. -
Technical Levels & Setups OR Macro Drivers (📌):
- FOMC/Kevin Warsh live event is the named session catalyst.
- Creator claims Trump and Jensen Huang are teaming up to dispel an AI hoax.
- Creator claims software had its biggest day in history against chip stocks.
- Creator claims rate-hike odds are guaranteeing a rate hike but it will not happen because Wall Street ignores clear Fed messaging.
- Live trading setup spans Etrade pro screen, ThinkOrSwim for long-term investing, and Fidelity for long-term investing.
- Stream is framed as educational live trading with risk disclaimers. -
Risk/Reward Framework (⚖️):
- Entry: Not established by the available evidence.
- Stop: Not established by the available evidence.
- Targets: Not established by the available evidence.
- Risk/Reward: Not established by the available evidence.
- Position Size: Not established by the available evidence.
- Probability: Not established by the available evidence. -
Scenario Analysis (🔄):
| Scenario | Probability | Target | Trigger |
|---|---|---|---|
| Bull | Not established by the available evidence. | Not established by the available evidence. | Fed messaging/rate-hike outcome resolves without a rate hike, aligning with creator's claim that it is not going to happen. |
| Base | Not established by the available evidence. | Not established by the available evidence. | FOMC/Kevin Warsh event proceeds as a live trading session without a stated rate decision outcome. |
| Bear | Not established by the available evidence. | Not established by the available evidence. | A rate hike occurs despite creator's claim that it will not happen. | -
Risk Factors (⚠️):
- No specific ticker, price, entry, stop, target, probability, or position size is provided; live commentary cannot be independently verified from metadata.
- Rate-hike odds claim lacks numeric probability or cited source.
- Software's 'biggest day in history' lacks date, index, and comparison baseline.
- AI hoax and Trump/Jensen Huang statements require external verification.
- Options trading risk disclosure states traders can lose most or all capital; creator says do not copy trades.
- FOMC/Kevin Warsh connection is not confirmed by official schedule in EVIDENCE. -
Actionable Trading/Allocation Plan (🎯):
- Check official Federal Reserve/FOMC calendar for Sep 16 and any Kevin Warsh appearance.
- Verify whether rate-hike odds were pricing a hike via futures market data.
- Verify software versus chip stock performance on the referenced day using sector/index data.
- Monitor stream for any specific tickers or trade levels; if absent, treat claims as unquantified.
- Cross-check Trump and Jensen Huang AI-related public comments.
- Review creator's educational disclaimer before considering any live trade observation.

-
Creator Horizon Category (⏱️): Long-Horizon Macro / Structural — The segment addresses frontier AI development, global AI governance, and cybersecurity access rather than a specific short-term trade or technical level.
-
One-Line Thesis (💡): All-In Podcast speaker claims frontier AI leaders are building 'Frankenstein' and seeking a one-world AI governance structure, while companies allegedly need defensive tools against a cyber hacking tool from Anthropic's newest models and are being denied access.
-
Key Data Points (📊):
- one world governance structure for artificial intelligence — speaker characterizes frontier AI leaders' proposed solution
- Frankenstein — speaker's metaphor for frontier AI development
- Anthropic's newest models — speaker claims a cyber hacking tool came out of them
- companies that are desperate for the defensive mechanisms ... being denied access to it — speaker's claim about defensive tool access
- Daario — speaker says he has read everything 'he' said over the past couple of weeks and is told the belief is earnest, not cynical, not regulatory capture
- All-In Podcast — creator/channel
- No ticker, price, level, valuation, probability, or position size is stated in the evidence. -
Technical Levels & Setups OR Macro Drivers (📌):
- Frontier AI leaders advocating a one-world AI governance structure, per speaker
- Speaker rejects regulation-first response and says builders should stop building 'Frankenstein' or build defensive mechanisms
- Alleged cyber hacking tool emerging from Anthropic's newest models
- Alleged denial of defensive mechanisms to companies seeking to defend against that cyber hacking tool
- Speaker defends 'Daario' as earnest and not engaged in regulatory capture
- Speaker calls for AI companies to provide defensive tools rather than ask government for regulation -
Risk/Reward Framework (⚖️):
- Entry: Not established by the available evidence.
- Stop: Not established by the available evidence.
- Targets: Not established by the available evidence.
- Risk/Reward: Not established by the available evidence.
- Position Size: Not established by the available evidence.
- Probability: Not established by the available evidence. -
Scenario Analysis (🔄):
| Scenario | Probability | Target | Trigger |
|---|---|---|---|
| Bull | Not established by the available evidence. | Not established by the available evidence. | Companies receive the defensive mechanisms against the alleged Anthropic cyber hacking tool, and frontier AI builders stop or mitigate development of 'Frankenstein'-type systems. |
| Base | Not established by the available evidence. | Not established by the available evidence. | Frontier AI leaders continue advocating one-world AI governance while defensive tool access remains contested. |
| Bear | Not established by the available evidence. | Not established by the available evidence. | Anthropic's newest models produce a cyber hacking tool and companies remain denied access to defensive mechanisms. | -
Risk Factors (⚠️):
- Evidence does not identify any ticker, price, valuation, market level, or portfolio position.
- Alleged cyber hacking tool from Anthropic's newest models is not independently verified in the evidence.
- Alleged denial of defensive mechanism access is not independently verified in the evidence.
- The identity of 'Daario' is not confirmed in the evidence.
- No quantitative probability, position size, entry, stop, target, or risk/reward ratio is provided.
- Policy and governance outcomes, timing, and implementation mechanisms are not established by the evidence. -
Actionable Trading/Allocation Plan (🎯):
- Verify whether Anthropic's newest models produced a cyber hacking tool.
- Verify reports that companies seeking defensive mechanisms were denied access to them.
- Identify the person referred to as 'Daario' and confirm the referenced statements from the past couple of weeks.
- Monitor AI governance proposals for one-world governance structure language.
- Track public statements from frontier AI labs and tech companies on defensive cyber tooling.
- Record any ticker, price, valuation, probability, or position size only if it appears in future evidence; none appears here.

-
Creator Horizon Category (⏱️): Long-Horizon Macro — Vance discusses border reversal, reindustrialization, inflation, fiscal deficit, Iran/energy and AI/power as multi-year US macro and structural issues during a midterm-era interview.
-
One-Line Thesis (💡): Vice President JD Vance claims the administration reversed illegal immigration by about 3 million, is reindustrializing via trillions in new investment, saved $250 billion in anti-fraud, and made inflation progress to three and a half percent while citing a $2 trillion inherited deficit and Middle East shipping/energy risk, with the host separately citing the 30-year around 5.2%.
-
Key Data Points (📊):
- Illegal immigration about 3 million lower today than when administration came into office — Vance claim
- Anti-fraud efforts saved about $250 billion of taxpayer money — Vance claim
- Federal budget $7 trillion — Vance cited
- Inherited $2 trillion fiscal deficit — Vance claim
- Goal to get fiscal deficit closer to 3% of GDP — Vance cites Scott Bassen
- 30-year Treasury around 5.2% — host cited
- Inflation three and a half% is still too high — Vance claim
- Biden administration inflation at 9 12% annualized, highest rate in about 48 years — Vance claim
- Trillions of dollars of new investment and new manufacturing facilities — Vance claim
- Reversed a 40-year trend over past 18 months — Vance claim
- Power bill example rose from $290/month to $580/month — Vance claim
- China crossed US in power generation in 2005 and now generates three times as much electricity — Vance claim
- Iran nuclear program and conventional military substantially destroyed — Vance claim
- Iranians shooting at commercial shipping even during peace negotiations — Vance claim
- Alternative to US role in Middle East would mean worldwide energy crisis — Vance claim
- Anthropic's newest models produced a cyber hacking tool and companies were denied defensive mechanisms — Vance claim
- Midterms are coming up and Vance is approximately halfway through the term — interview context
- Scott Bassen is Treasury Secretary and Vance says he will meet him in a couple of hours — Vance mention -
Technical Levels & Setups OR Macro Drivers (📌):
- Border enforcement reversal framed as a signature achievement and a break from postwar Western government pattern
- Reindustrialization/reshoring thesis: criticism of globalization and services/tech/finance-only economic consensus; need to make stuff
- Iran/energy setup: US military action destroyed Iranian nuclear and conventional capabilities but Iranian attacks on commercial shipping continue; US role protects oil/gas flows
- Inflation disinflation setup: progress claimed from Biden administration 9 12% annualized to three and a half%, which Vance still calls too high
- Fiscal setup: anti-fraud savings of $250B versus $7T budget; $2T inherited deficit; need bipartisan legislative solution to give markets confidence
- AI/power setup: data-center backlash tied to insufficient electricity generation; blue states make additional generation difficult; need to build more power; 'electricity too cheap to meter'
- AI frontier setup: Vance criticizes 'Frankenstein' narrative and says if building Frankenstein, stop, and give defensive tools to companies facing cyber hacking tools -
Risk/Reward Framework (⚖️):
- Entry: Not established by the available evidence.
- Stop: Not established by the available evidence.
- Targets: Not established by the available evidence.
- Risk/Reward: Not established by the available evidence.
- Position Size: Not established by the available evidence.
- Probability: Not established by the available evidence. -
Scenario Analysis (🔄):
| Scenario | Probability | Target | Trigger |
|---|---|---|---|
| Bull | Not established by the available evidence. | Not established by the available evidence. | Vance claims inflation down to three and a half% from 9 12%, $250B anti-fraud savings, 3 million lower illegal immigration, and trillions in manufacturing investment; verify deficit trends toward 3% of GDP and energy markets remain supplied. |
| Base | Not established by the available evidence. | Not established by the available evidence. | Vance says three and a half% inflation is still too high and the $2T inherited deficit requires bipartisan solution; verify 30-year around 5.2%, deficit path, and power/AI buildout. |
| Bear | Not established by the available evidence. | Not established by the available evidence. | Vance says the alternative to Middle East involvement is a worldwide energy crisis and Iranians keep shooting at shipping; verify shipping attacks, oil/gas flow disruption, inflation reacceleration, or fiscal market-confidence loss. | -
Risk Factors (⚠️):
- Claims are transcript-backed but not independently verified; no primary data supplied for border, investment, anti-fraud savings, inflation, deficit, or power statistics
- No ticker, valuation, entry, stop, target, position size, or risk/reward parameters are stated
- Fiscal-deficit solution depends on bipartisan congressional action Vance says is uncertain
- Middle East escalation could disrupt oil/gas and energy markets per Vance's own warning
- Inflation at three and a half% remains too high per Vance and could stay high
- Data-center/AI backlash and power-cost increases create political and regulatory risk
- AI cyber/defense access issue may create regulatory and tech-sector uncertainty
- 30-year around 5.2% is cited by the host with no administration target or policy trigger
- Midterm election timing may affect policy follow-through -
Actionable Trading/Allocation Plan (🎯):
- Verify border reversal figure against official border data
- Track inflation data versus Vance's three and a half% claim and Biden administration 9 12% annualized comparison
- Monitor Treasury deficit/GDP path against Vance's 3% goal and 30-year yield around 5.2%
- Follow Scott Bassen/Treasury statements and any bipartisan deficit legislation
- Track Iran-related commercial shipping attacks and oil/gas market flows
- Monitor manufacturing construction and new investment data versus the 'trillions' claim
- Track US and China electricity generation and data-center power cost/backlash
- Monitor AI policy, Anthropic model cyber-tool disclosures, and defensive-tool access
- Note that no tickers or trade parameters are established and avoid inferring positions

-
Creator Horizon Category (⏱️): Long-Horizon Macro / Structural — Creator frames Terafab as a long-term structural response to possible Taiwan chip-supply disruption and maxed-out fab capacity for AI, robotics, and auto compute.
-
One-Line Thesis (💡): All-In Podcast creator claims Terafab is needed because Taiwan chip supply may cease for unspecified reasons and existing fabs are at max capacity, so scaling AI server, edge, humanoid robotics, and car compute requires logic, memory, and packaging capacity: 'either build Terafab or fail to scale.'
-
Key Data Points (📊):
- Terafab — origin story framed around fear that chips from Taiwan may not be available 'for who knows what reason' or 'for some reason'.
- Taiwan — creator says if chips may not continue coming from Taiwan, it would 'really make things difficult if we didn't have any chips'.
- AI scaling — server centers, edge compute, humanoid robotics, and cars cited as demand vectors for continued chip scaling.
- Existing fabs — creator states all fabs are running at max capacity.
- Supply chain — logic, memory, packaging, 'the whole works' required to continue scaling.
- Binary claim — 'either build Terafab or fail to scale'.
- Geopolitical risk — certainty of future chip supply needed even if things become challenging geopolitically. -
Technical Levels & Setups OR Macro Drivers (📌):
- Geopolitical disruption risk to Taiwan chip supply.
- Maxed-out existing fab capacity.
- Long-term AI scaling demand across server centers, edge compute, humanoid robotics, and cars.
- Need for integrated logic, memory, and packaging capacity.
- Strategic binary stated by creator: build Terafab or fail to scale.
- Certainty of future chip supply sought even absent geopolitical challenges. -
Risk/Reward Framework (⚖️):
- Entry: Not established by the available evidence.
- Stop: Not established by the available evidence.
- Targets: Not established by the available evidence.
- Risk/Reward: Not established by the available evidence.
- Position Size: Not established by the available evidence.
- Probability: Not established by the available evidence. -
Scenario Analysis (🔄):
| Scenario | Probability | Target | Trigger |
|---|---|---|---|
| Bull | Not established by the available evidence. | Not established by the available evidence. | Creator says building Terafab provides certainty of future chip supply and supports scaling AI server centers, edge compute, humanoid robotics, and cars. |
| Base | Not established by the available evidence. | Not established by the available evidence. | Creator states all fabs are running at max capacity and demand continues across AI server centers, edge compute, humanoid robotics, and cars. |
| Bear | Not established by the available evidence. | Not established by the available evidence. | Creator warns chips from Taiwan may become unavailable and 'if we didn't have any chips' it would make things difficult; without Terafab, fail to scale. | -
Risk Factors (⚠️):
- No quantification of capacity gap, demand, revenue, capex, or wafer volumes.
- No timeline, location, funding, partners, yield, or execution details for Terafab.
- Taiwan disruption trigger is vague: 'for who knows what reason' / 'for some reason'.
- No named tickers, valuation levels, entry, stop, target, or position sizing.
- Claims are creator assertions; no independent corroboration in the evidence.
- Binary 'build Terafab or fail to scale' may omit substitution, inventory, or alternative fab expansion. -
Actionable Trading/Allocation Plan (🎯):
- Verify whether Terafab is an announced project with official filings, site, funding, partners, and timeline.
- Track Taiwan Strait geopolitical risk indicators and chip export-control developments.
- Monitor foundry capacity utilization across logic, memory, and advanced packaging.
- Map listed companies tied to AI servers, edge compute, humanoid robotics, autos, logic, memory, and packaging only after evidence names them.
- Follow All-In Podcast or creator for follow-up claims on Terafab scope, capacity, and demand assumptions.
- Check whether any ticker is explicitly mentioned in the full video; the evidence names none.

-
Creator Horizon Category (⏱️): Short-Term Technical — Creator's setup centers on immediate catalysts—Clarity Act vote and FOMC tomorrow—plus BTC $76,000 support and 12-hour/daily patterns.
-
One-Line Thesis (💡): The creator claims BTC's $76,000 support break has lacked follow-through and frames the Clarity Act 60-vote advancement vote and FOMC 25 basis point hike decision as near-term volatility catalysts while tracking technical levels in BTC, ETH, Nasdaq, and altcoins.
-
Key Data Points (📊):
- Headline claim: 'key $76,000 support has broken but no follow-through at this point' — BTC.
- FOMC tomorrow; market priced 25 basis point rate hike with '92 whatever, 94% chance' — creator calls it mostly priced in; press conference/forward guidance seen as more volatile.
- BTC current high of reaction 77.3; if price shoots toward 78,000, creator says bill likely advancing; horizontal resistance just under 80,000 with three hard rejections.
- BTC broke support of 76.2 thousand over weekend / into weekend with zero bear follow-through; today another lower low with zero follow-through; 12-hour megaphone; potential 12-hour falling wedge; down-trending support line came into play three times; down-trending resistance line has five major rejections.
- BTC bigger-picture two-week timeframe: potential inverse head and shoulders after falling wedge bull break; bulls want to hold 70,000, ideally don't give back more than 50% of move off the low.
- Nasdaq: bear break of daily equilibrium; no follow-through; possible falling wedge after bear break; weekly equilibrium; could tighten into October or beyond; July lows referenced as space above.
- Ethereum: 12-hour rising wedge; bull break no follow-through; daily downtrend confirmed; testing lowest level in weeks at 23.55; back on weekly timeframe watching EMAs.
- ETHBTC: double top at top; weekly/two-day timeframe; two-day EMA 12 rider being tested; bulls held every test since bull break two and a half months ago.
- Altcoins: decent red day, momentum picking up; XRP big hourly downtrend confirming; alts selling off more than BTC.
- ZEC: watching 12-hour higher low for inverse head and shoulders; left shoulder double topped at neckline; low 1029; need hourly trend change first; 4-hour oversold not hit yet.
- HYPE: bear break testing previous resistance zone as support; held Sunday into bounce; significant altcoin weakness in response to vote.
- CRCL: big drop; weekly stair-step bear break; six weeks of higher lows; watching eventually for weekly higher low but not yet.
- Gold and silver need weekly higher lows; gold retracement not ideal; miners/GDX stronger with consolidation still bull flag territory; GDX retracement in bull flag, gold/silver gave back 50% plus.
- MSOS chart posted; cannabis reviews in weekend videos.
- IBIT stair-step example: bull break at 4252; stop under 4237; risking 15 cents; bounced 25 cents; partial exit a third or half; 1-minute EMA 12 rejection.
- Probability-market claim: biggest disconnect in a decade between rate-hike/cut probabilities and retail social media; polls 3,000-4,000 answers 50/50 vs billions of dollars at 90%+; meaningful only if adequate money traded.
- Creator schedule: semi-retirement at end of November; no weekly streams; monthly check-ins; no daily crypto live streams; routine shift. -
Technical Levels & Setups OR Macro Drivers (📌):
- Clarity Act 60-vote advancement vote creates voting volatility and possible BTC spike to 78,000-80,000 if advancing.
- FOMC 25 basis point hike mostly priced; press conference/forward guidance drives Thursday/Friday positioning.
- BTC 12-hour megaphone/falling wedge with 76,000 support break and no follow-through; watching 76,000 battle.
- BTC two-week inverse head and shoulders; bulls want to hold 70,000.
- Nasdaq daily equilibrium bear break, no follow-through; falling wedge possible; weekly equilibrium.
- ETH 12-hour rising wedge bear break, daily downtrend confirmed, testing 23.55.
- ETHBTC two-day EMA12 test, prior bull hold since bull break two and a half months ago.
- Altcoin relative weakness, XRP hourly downtrend, HYPE bear break, ZEC inverse H&S setup, CRCL weekly stair-step bear break.
- Metals/miners: gold/silver weekly higher lows needed; GDX bull flag.
- Probability market vs retail sentiment disconnect.
- Creator's schedule transition toward semi-retirement and monthly check-ins. -
Risk/Reward Framework (⚖️):
- Entry: Not established by the available evidence.
- Stop: Creator's illustrative stair-step examples: IBIT stop under 4237; BTC example references '300 dollar risk' before stopping out.
- Targets: Not established by the available evidence.
- Risk/Reward: Not established by the available evidence.
- Position Size: Creator mentions exiting half or one-third / partial a third or half the position in stair-step examples.
- Probability: Creator-cited: Clarity Act 60-vote advancement maybe 40%; FOMC 25 basis point hike with '92 whatever, 94% chance'; most likely scenario no Clarity Act advancement. -
Scenario Analysis (🔄):
| Scenario | Probability | Target | Trigger |
|---|---|---|---|
| Bull | Creator-cited: 'maybe' 40% chance of getting 60 votes to advance Clarity Act (not a full trade probability). | BTC price spikes toward 78,000 or 80,000; Nasdaq breaks bull if bullish FOMC reaction; BTC holds 70,000 for two-week higher low. | Clarity Act gets 60 votes to advance, or bullish FOMC reaction; creator says price shooting toward 78,000 would signal bill likely advancing; bulls hold 70,000. |
| Base | Not established by the available evidence. | Not established by the available evidence. | Verify the trigger against the source evidence. |
| Bear | Not established by the available evidence. | Convincing loss of 76,000; deeper retracement with no clear support; Nasdaq weekly equilibrium tightens into October or beyond; 70,000 bulls want to hold. | Convincing loss of 76,000; failure to hold 70,000; Nasdaq keeps dropping next week or two; altcoins continue selling off more than BTC. | -
Risk Factors (⚠️):
- Clarity Act vote volatility and delayed information flow may cause whipsaw price reactions.
- FOMC press conference/forward-looking statements may be more significant than the 25 basis point decision.
- Probability markets vs retail polls disconnect may cause significant repricing if a 50/50 event resolves.
- No-follow-through patterns are not high-conviction; creator calls Nasdaq falling wedge 'not a high conviction pattern.'
- Lack of clear support levels after shooting straight up; retracement size is the main guide.
- 12-hour down-trending support line may be invalidated and no longer important.
- Crypto fees reduce viability of scalping 1% moves; creator would not scalp crypto personally.
- Creator schedule changes to semi-retirement end November, no weekly streams, may reduce coverage frequency.
- Verification missing on exact Clarity Act vote count, FOMC actual outcome, and subsequent price reaction. -
Actionable Trading/Allocation Plan (🎯):
- Verify FOMC 25 basis point rate hike pricing of '92 whatever, 94% chance' and press conference/forward guidance language.
- Monitor Nasdaq daily/weekly equilibrium and July lows as referenced.
- Monitor ETH 23.55, daily downtrend, and weekly EMAs.
- Monitor ETHBTC two-day EMA12 test and prior bull-hold behavior.
- Monitor altcoins: XRP hourly downtrend, ZEC 1029, HYPE prior resistance, CRCL weekly higher low.
- Monitor gold/silver weekly higher lows and GDX bull flag.
- Monitor probability-market vs social-media poll disconnect.
- Note creator schedule: semi-retirement end November, monthly check-ins, no daily/weekly crypto live streams.

-
Creator Horizon Category (⏱️): Long-Horizon Macro / Structural — The discussion centers on AI diffusion, model-layer competition, open vs closed weights, interoperability, safety engineering, and Microsoft's $80 billion Azure buildout rather than short-term price levels.
-
One-Line Thesis (💡): Microsoft's $250 billion market-value generation, about 120% stock gain since Nadella became CEO, and $80 billion Azure buildout frame an episode where Nadella claims AI needs broad diffusion, customer control, multimodel competition, and robust safety/engineering while frontier model economics face token-price compression from open-source alternatives.
-
Key Data Points (📊):
- $250 billion with a B in market value for Microsoft — opening clip claim attributed to Microsoft/Nadella context
- stock is up about 120% since Nadella became CEO over three and a half years — host claim
- $80 billion to build out Azure — Nadella quote in opening clip
- $50 for OpenAI's kind of million token output vs as low as 15 cents, or let's call it 60 cents, for DeepSeek's new million-token output; 99% cost reduction — host's token-compression argument
- 10% chance we all die — referenced as Dario and team's public warning in host question
- 3,000 agents defend a bunch of websites vs instructed to hack websites — Hugging Face eval description
- massive model overhang/capability overhang — Nadella claim that models are very good but broad diffusion requires change management
- coding agents became usable with an agent loop with a file system — Nadella product-breakthrough example
- Astra/KUA and computer use plus long trajectory tasks — Nadella next form-factor example
- KV cache reuse across multiple model families — Nadella interoperability question -
Technical Levels & Setups OR Macro Drivers (📌):
- AI must serve humanity first and remain in human control before pacing/safety debates
- Broad diffusion requires choice, competition, and varied business models including open weights and closed weights
- Customer/enterprise control: privacy, embedding knowledge in weights the customer controls, chain-of-thought visibility, fine-tuning, and IP non-leakage
- Third-party safety testers welcomed; avoid cozy tester/access arrangements; testing should be broad
- Reward hacking and persistent agent swarms create novel insider risk; mundane DevOps issues include misconfigured containers, API keys, and no monitoring
- Containment, aggressive monitoring, auditability, behavioral evidence, and object/secret access tracking for agent activity
- Capability overhang: diffusion constrained by change management and workflow compression
- Next product form factors: coding agents with file-system agent loops, computer use via Astra/KUA, and long trajectory automation
- Multimodel world for resilience; need interop standards, KV cache reuse, external harness, and memory not tied to one model
- Token compression and open-source vs closed-source competition pressure model-layer royalty economics
- Microsoft's $80 billion Azure buildout as AI infrastructure spend -
Risk/Reward Framework (⚖️):
- Entry: Not established by the available evidence.
- Stop: Not established by the available evidence.
- Targets: Not established by the available evidence.
- Risk/Reward: Not established by the available evidence.
- Position Size: Not established by the available evidence.
- Probability: Not established by the available evidence. -
Scenario Analysis (🔄):
| Scenario | Probability | Target | Trigger |
|---|---|---|---|
| Bull | Not established by the available evidence. | Not established by the available evidence. | Broad diffusion via next-level form factors doing real work in the real enterprise, including coding agents, computer use via Astra/KUA, and long trajectory automation. |
| Base | Not established by the available evidence. | Not established by the available evidence. | Massive model/capability overhang meets slow enterprise change management and workflow compression/change taking time. |
| Bear | Not established by the available evidence. | Not established by the available evidence. | Persistent agents and reward hacking produce showstopper safety/insider-risk incidents, as with the Hugging Face incident, agent swarms, misconfigured sandbox, exposed credentials, and no monitoring. | -
Risk Factors (⚠️):
- Reward hacking and persistent agents may create new insider risks, including faking books when optimizing working capital
- Mundane DevOps errors: misconfigured containers/sandboxes, exposed API keys/credentials, and lack of monitoring
- Safety showstoppers: frontier technologists warning about 10% chance we all die and resignations; Nadella compares to showstopper bugs
- IP leakage and opaque model control for enterprises
- Model-layer economics: token price compression and open-source substitutes pressure frontier lab royalty models
- No interop standards; memory, use exhaust, and data may be tied to one model rather than owned by the enterprise
- No explicit financial targets, valuation models, or risk/reward parameters in evidence
- Transcript misattribution/garbling risk, e.g., 'Scott Nadella' instead of Satya Nadella and unclear speaker boundaries -
Actionable Trading/Allocation Plan (🎯):
- Verify Microsoft's stated $80 billion Azure buildout against subsequent capex disclosures and timeline.
- Check Microsoft stock return since Nadella became CEO for the claimed about 120% over three and a half years.
- Monitor frontier lab release cadence for a shift from raw power toward reliability, predictability, and alignment.
- Review third-party tester arrangements for breadth and conflicts of interest.
- Audit agent containment, monitoring, auditability, behavioral evidence, and secret-access chaining controls.
- Track multimodel interoperability standards, KV cache reuse, external harness, and memory portability.
- Watch enterprise adoption metrics for coding agents, computer use, and long trajectory automation.
- Clarify transcript attributions and separate host claims from Nadella claims before relying on any figure.

-
Creator Horizon Category (⏱️): Long-Horizon Macro / Structural — The transcript proposes a structural AI safety-testing, liability, and international-acceptance framework rather than a short-term market or technical setup.
-
One-Line Thesis (💡): A speaker or speakers on All-In Podcast, with one addressed as Elon, claim major AI competitors should immediately test each other's models with open-source security harnesses, backed by existing product-liability exposure, and that any proposal must be acceptable to China rather than requiring a transnational regulator.
-
Key Data Points (📊):
- Major AI competitors test each other's models — reciprocal peer testing proposal
- Everyone's security test harness testing everyone's models — mutual evaluation architecture
- Instead of grading your own homework, competitors grading your homework and raising alarm — peer review claim
- Open-source safety and security harnesses and testing apparatus — transparency proposal
- Incentive for labs to invest in safety while trying to debunk other people's claims — mechanism claim
- Product liability laws already apply to AI; Lina Khan post referenced as 'yesterday' — regulatory claim
- If a company ignores peer feedback and releases unsafe model, liability would be enormous; almost prima facie evidence of negligence — liability claim
- Big tobacco level settlement — rhetorical comparison for knowing release
- Any proposal must be something China is willing to accept; otherwise US handicaps itself — geopolitical constraint
- Could happen right now; no need to convene United Nations or create transnational gulag organization — implementation claim
- Regulatory oversight can always escalate but is very difficult to reduce — regulatory ratchet claim
- No tickers, prices, levels, or valuation figures stated — evidence scope -
Technical Levels & Setups OR Macro Drivers (📌):
- Reciprocal competitor testing creates peer-review pressure and an early-warning mechanism
- Open-source security harnesses allow external scrutiny under the hood
- Product liability and negligence risk incentivize safety investment before release
- China acceptance is a gating condition for any international AI safety proposal
- Voluntary immediate action is presented as preferable to a new international body
- Regulatory oversight is described as asymmetric: easy to escalate, difficult to reduce -
Risk/Reward Framework (⚖️):
- Entry: Not established by the available evidence.
- Stop: Not established by the available evidence.
- Targets: Not established by the available evidence.
- Risk/Reward: Not established by the available evidence.
- Position Size: Not established by the available evidence.
- Probability: Not established by the available evidence. -
Scenario Analysis (🔄):
| Scenario | Probability | Target | Trigger |
|---|---|---|---|
| Bull | Not established by the available evidence. | Not established by the available evidence. | Competitors publicly adopt reciprocal testing or open-source harnesses and China signals acceptance. |
| Base | Not established by the available evidence. | Not established by the available evidence. | Product liability remains the main enforcement channel while peer testing is discussed but not universally adopted. |
| Bear | Not established by the available evidence. | Not established by the available evidence. | A major model is released after competitors flag safety concerns, or the proposal is rejected by China and the US handicaps itself. | -
Risk Factors (⚠️):
- No named AI labs, companies, tickers, or market instruments are identified in the evidence
- No concrete adoption timeline, enforcement body, or compliance mechanism is specified
- China's willingness to accept the proposal is asserted as a constraint but not evidenced
- Open-source harness efficacy, security, and misuse resistance are not established
- Product liability application to AI is asserted via a referenced Lina Khan post but not detailed
- 'Big tobacco level settlement' is rhetorical and not quantified
- Regulatory escalation path is mentioned but not parameterized
- No probability, position size, entry, stop, target, or risk/reward ratio is provided -
Actionable Trading/Allocation Plan (🎯):
- Monitor All-In Podcast follow-up discussion for named labs, regulators, or concrete proposals
- Verify the referenced Lina Khan post and its product-liability claims
- Track major AI labs for announcements on reciprocal model testing or open-source safety harnesses
- Watch China policy statements for acceptance or rejection of mutual AI safety testing
- Track AI product-liability litigation and regulatory actions for negligence standards
- Observe whether voluntary peer testing advances versus UN or transnational regulatory proposals
- Record that no tickers, prices, levels, or valuation figures were provided and avoid inferring them
-
Creator Horizon Category (⏱️): Short-Term Technical — The title/description frame a live pre-market technical-analysis session ahead of FOMC tomorrow for futures and options traders.
-
One-Line Thesis (💡): Trade Brigade's headline claims 'Heavy Markets Ahead of FOMC Tomorrow' and frames the video as a live pre-market technical-analysis session for futures and options traders.
-
Key Data Points (📊):
- Title claim: '[LIVE] Pre-Market Prep – Heavy Markets Ahead of FOMC Tomorrow' — creator emphasizes heavy markets ahead of an FOMC meeting.
- Format claim: live pre-market prep broadcast, described as airing every trading day at 8:00 AM EST.
- Audience claim: technical analysis for futures traders and options traders.
- No tickers, index levels, price targets, entries, stops, position sizes, probabilities, valuation figures, or risk/reward ratios are present in the available metadata. -
Technical Levels & Setups OR Macro Drivers (📌):
- FOMC meeting scheduled for 'Tomorrow' from the publication timestamp.
- Pre-market technical analysis session focused on futures and options.
- Creator labels the setup as 'Heavy Markets Ahead of FOMC Tomorrow,' though metadata does not define 'heavy.'
- No specific setup, ticker, contract, level, or trade structure is established by the available metadata. -
Risk/Reward Framework (⚖️):
- Entry: Not established by the available evidence.
- Stop: Not established by the available evidence.
- Targets: Not established by the available evidence.
- Risk/Reward: Not established by the available evidence.
- Position Size: Not established by the available evidence.
- Probability: Not established by the available evidence. -
Scenario Analysis (🔄):
| Scenario | Probability | Target | Trigger |
|---|---|---|---|
| Base | Not established by the available evidence. | Not established by the available evidence. | Video is a live pre-market prep ahead of FOMC tomorrow; creator labels markets 'Heavy.' | -
Risk Factors (⚠️):
- Metadata-only evidence; no transcript, levels, tickers, or stated trade plan available.
- FOMC event risk is referenced but no directional or volatility parameters are provided.
- 'Heavy Markets' is undefined; cannot verify whether it refers to volume, volatility, liquidity, or price action.
- No risk/reward, entry, stop, target, position size, or probability is stated.
- No bullish or bearish trigger is established by the available metadata. -
Actionable Trading/Allocation Plan (🎯):
- Review the source video or transcript for any tickers, futures contracts, levels, or trade parameters omitted from metadata.
- Verify whether 'Heavy Markets' is defined by the creator as volume, volatility, liquidity, or price action.
- Check whether the creator provided a directional bias or scenario plan beyond the headline.
- Record any stated entry, stop, target, ratio, position size, or probability if it appears in the full video; none are present in metadata.

-
Creator Horizon Category (⏱️): Long-Horizon Macro / Structural — Creator describes AI touching every investment department and every investment lifecycle stage, with agentic portfolio management planned for 2027.
-
One-Line Thesis (💡): The creator claims AI now touches every investment department and every stage of the investment lifecycle to help read, remember, and challenge everything, but stops short of decision-making and recommendation because of caution around client capital, while many PMs are testing agentic portfolio management and the concept is planned for 2027.
-
Key Data Points (📊):
- AI touches every investment department, including the office of the CIO, and every stage of the investment life cycle — claimed scope of AI adoption
- Tagline is trying to get AI to help read everything, remember everything, and challenge everything — claimed AI use case
- Stopped short so far is decision-making and agency — claimed boundary of AI use
- Not used as a decision-maker or recommendation tool; no path to it right now; uncomfortable with the idea — claimed current limitation
- Many portfolio managers are testing agentic portfolio management right now — claimed implementation activity
- Agentic partner in portfolio management is a lot of what we are going to do in 2027 — claimed planned timeline -
Technical Levels & Setups OR Macro Drivers (📌):
- AI read/remember/challenge workflow across all investment stages — research augmentation setup
- Intentionality requirement before amplifying pace of decisions — gating condition for AI agency
- Caution over bleeding edge and client capital — brake on AI decision-making
- PM testing of agentic portfolio management — setup for 2027 deployment
- AI in every investment department including CIO office — organizational penetration -
Risk/Reward Framework (⚖️):
- Entry: Not established by the available evidence.
- Stop: Not established by the available evidence.
- Targets: Not established by the available evidence.
- Risk/Reward: Not established by the available evidence.
- Position Size: Not established by the available evidence.
- Probability: Not established by the available evidence. -
Scenario Analysis (🔄):
| Scenario | Probability | Target | Trigger |
|---|---|---|---|
| Bull | Not established by the available evidence. | Not established by the available evidence. | Concept of having the agentic partner in portfolio management is a lot of what we are going to do in 2027. |
| Base | Not established by the available evidence. | Not established by the available evidence. | Where we have stopped short so far is decision-making and agency. |
| Bear | Not established by the available evidence. | Not established by the available evidence. | Not used as a decision-maker or recommendation tool; no path to it right now; uncomfortable with the idea. | -
Risk Factors (⚠️):
- Creator flags discomfort with AI as decision-maker or recommendation tool — adoption boundary risk
- No path to AI decision-making right now — timeline uncertainty
- Bleeding-edge caution and client capital stewardship — governance and risk constraint
- 2027 agentic portfolio management plan lacks verified scope, metrics, or accountability in evidence
- Evidence does not establish tickers, levels, valuations, position sizes, or portfolio implications -
Actionable Trading/Allocation Plan (🎯):
- Monitor follow-up for explicit 2027 agentic portfolio management milestones.
- Verify whether PM testing translates into live decision-making or only research and challenge functions.
- Track governance and guardrails around AI as decision-maker or recommendation tool.
- Watch for any named funds, strategies, tickers, or allocation changes tied to AI adoption; none in evidence.
- Check if creator maintains read/remember/challenge framing versus moving to recommendation or agency.

-
Creator Horizon Category (⏱️): Long-Horizon Macro / Structural — Claims center on multi-year Mars, Starship, Starlink, AI compute, and capital-project buildout rather than short-term technical levels.
-
One-Line Thesis (💡): All-In Podcast guest Gwen Shotwell claims SpaceX is a $1.7T public SpaceX-plus-AI platform after a $75B IPO, with Starlink as a cash engine, compute rental as a strong-demand business, and people on Mars within a decade; analyst interpretation: the evidence is qualitative/structural and contains no trading levels.
-
Key Data Points (📊):
- people down on Mars within a decade — Mars timeline claim
- $75 billion IPO — SpaceX IPO size claim from video intro
- $1.7 trillion — SpaceX debut market value claim from video intro
- 24th anniversary on the 9th of September — Shotwell tenure at SpaceX
- seventh employee to sign contract; employee number 11 three weeks later — early SpaceX headcount
- sold a rocket about 12 months later, before a rocket existed — early SpaceX sales cycle
- $1.6 billion NASA CRS contract final negotiations in 2008 — cargo resupply contract
- compute rental is 'a heck of a business' and 'we see no drop in demand at all' — AI compute demand
- tens of billions of dollars per quarter in buildout — host framing of compute/AI customer buildout
- not planning to release any more stock — capital strategy comment
- future generations of rockets 100% designed/built/informed by AI — Shotwell says 'Yes'
- EchoStar/Charlie spectrum acquisition; direct-to-cell through T-Mobile — connectivity plan
- Terafab, Louisiana Spaceport, Starship — named large capital projects
- xAI acquisition; Cursor acquisition closed about a month ago — M&A and integration
- a lot of churn at xAI; SpaceX leadership and engineering went into xAI — integration dynamics
- Starlink is carrying its own weight — cash generation claim
- Starlink revenue compared to what we do for the US military is very small — headroom claim -
Technical Levels & Setups OR Macro Drivers (📌):
- Starlink low penetration plus claimed cash generation supports internal funding optionality.
- AI compute rental demand claimed strong with no drop and large buildout spend.
- Public-company status after $75B IPO and $1.7T market value changes capital access and disclosure constraints.
- Spectrum acquisition and T-Mobile direct-to-cell tie-in support Starlink dead-zone strategy.
- xAI/SpaceX integration and AI-led rocket design are framed as strategic necessity.
- Mars within a decade, Starship, Terafab, and Louisiana Spaceport are long-duration catalysts.
- EchoStar, xAI, and Cursor deals indicate an expanding SpaceX-adjacent platform. -
Risk/Reward Framework (⚖️):
- Entry: Not established by the available evidence.
- Stop: Not established by the available evidence.
- Targets: Not established by the available evidence.
- Risk/Reward: Not established by the available evidence.
- Position Size: Not established by the available evidence.
- Probability: Not established by the available evidence. -
Scenario Analysis (🔄):
| Scenario | Probability | Target | Trigger |
|---|---|---|---|
| Bull | Not established by the available evidence. | Not established by the available evidence. | Verify the trigger against the source evidence. |
| Base | Not established by the available evidence. | Not established by the available evidence. | Creator says Starlink carries its own weight, compute rental is 'a heck of a business,' and xAI/SpaceX integration is jelling but not fully integrated; verification requires quarterly segment disclosures and integration updates. |
| Bear | Not established by the available evidence. | Not established by the available evidence. | Creator acknowledges xAI churn, 'a lot to go right,' and multiple large capital projects; verification risk if filings show capital needs, integration slippage, or no quantitative compute/Starlink disclosure. | -
Risk Factors (⚠️):
- No revenue, earnings, EPS, margin, cash-flow, or valuation multiple is provided.
- Public-company disclosure constraints: Shotwell says she was told what not to say and does not plan to make news on stock issuance.
- Capital allocation across Starship, Terafab, AI compute, and spectrum is unquantified.
- Starlink penetration and cash generation claims lack ARPU, churn, subscriber, or country-level detail.
- xAI churn and SpaceX leadership diversion could slow integration.
- AI-designed rockets claim is qualitative and lacks engineering or cost validation.
- EchoStar, xAI, and Cursor M&A integration risk is not quantified.
- Direct-to-cell spectrum and T-Mobile partnership economics are not established.
- Mars within a decade is a long-dated claim with no schedule, budget, or probability.
- Transcript cuts off mid-sentence, limiting verification of later claims. -
Actionable Trading/Allocation Plan (🎯):
- Verify SpaceX IPO details: $75B raise, $1.7T market value, ticker, exchange, and filing date.
- Monitor disclosures on compute rental revenue, AI buildout capex, and the 'tens of billions per quarter' buildout framing.
- Track Starship, Mars, Terafab, and Louisiana Spaceport milestones against the 'within a decade' claim.
- Follow xAI, Cursor, and EchoStar integration updates, including spectrum deployment and T-Mobile direct-to-cell execution.
- Watch for any change to the 'not planning to release any more stock' capital strategy.
- Do not infer trading levels from this evidence; require quantitative disclosures before forming a valuation view.

-
Creator Horizon Category (⏱️): Long-Horizon Macro / Structural — The creator describes a Silicon Valley technical debate politicized before an election and emphasizes the research-to-production software leap.
-
One-Line Thesis (💡): All-In Podcast speakers claim a Silicon Valley technical debate has been irresponsibly seized by political actors a couple months before an election, while a US president and Jensen debunked a related hoax live on stage and the substantive issue is the big leap from research to actual production software.
-
Key Data Points (📊):
- president of the United States and Jensen debunk a hoax live on stage — creator calls this the craziest thing
- a somewhat technical debate in Silicon Valley — creator says it has been seized on by actors within the political system
- a couple months before an election — creator's stated timing for political actors blowing it up
- research to actual production software is a big leap — creator frames this as the substantive issue
- actors do not care about the thing itself; they care about the drama around the thing — creator's characterization
- keep your head down and do the work — creator's suggested posture -
Technical Levels & Setups OR Macro Drivers (📌):
- Political actors seizing a Silicon Valley technical debate for pre-election advantage
- Public live-stage debunking of a hoax by the US president and Jensen
- Research-to-production software transition as the substantive technical leap
- Drama-around-the-thing focus displacing discussion of the underlying issue
- Creators advocate internal conversations and quiet execution -
Risk/Reward Framework (⚖️):
- Entry: Not established by the available evidence.
- Stop: Not established by the available evidence.
- Targets: Not established by the available evidence.
- Risk/Reward: Not established by the available evidence.
- Position Size: Not established by the available evidence.
- Probability: Not established by the available evidence. -
Scenario Analysis (🔄):
| Scenario | Probability | Target | Trigger |
|---|---|---|---|
| Bull | Not established by the available evidence. | Not established by the available evidence. | If the technical debate returns to internal conversations rather than election-driven public escalation. |
| Base | Not established by the available evidence. | Not established by the available evidence. | If actors within the political system continue blowing up the debate a couple months before an election. |
| Bear | Not established by the available evidence. | Not established by the available evidence. | If public focus remains on the drama around the thing rather than the thing itself. | -
Risk Factors (⚠️):
- The hoax is not specified; verification requires the full episode or primary reports.
- No ticker, company, sector, asset class, price, level, or valuation is named.
- The election jurisdiction and exact date are not established beyond before an election.
- Jensen's full identity is not established in evidence; likely Jensen Huang but not explicitly named.
- The Silicon Valley technical debate and political actors are unnamed.
- Evidence is a short transcript clip and may omit context and counterarguments. -
Actionable Trading/Allocation Plan (🎯):
- Verify the specific technical debate and hoax referenced by reviewing the full All-In Podcast episode.
- Check primary sources for live on-stage remarks by the US president and Jensen.
- Identify the election timing implied by a couple months before an election.
- Monitor whether political actors continue elevating the issue and whether the creators name companies or sectors.
- Separate the underlying research-to-production software discussion from the political drama for follow-up analysis.

-
Creator Horizon Category (⏱️): Short-Term Technical — Title and description frame a dated Sep 15 live-trading session around stock news, AI software vs chip stocks, and Fed rate-hike odds.
-
One-Line Thesis (💡): Creator claims Trump and Jensen Huang teamed up to dispel the 'AI hoax' after software had its biggest day in history against chip stocks, and that rate-hike odds are guaranteeing a hike but it will not happen because Wall Street is willfully ignoring clear Fed messaging.
-
Key Data Points (📊):
- Title: 'AI HOAX - SEP 15 - Stock Market LIVE, Live Trading, Stock News' — video headline framing.
- Sep 15 — date emphasized in title.
- Claim: Trump & Jensen Huang team up to dispel the AI hoax — literal description.
- Claim: software had its biggest day in history against chip stocks — literal description, no percentage or index level provided.
- Claim: rate hike odds are guaranteeing the rate hike — literal description, no probability or odds figure provided.
- Claim: rate hike 'is not going to happen' — creator says Wall Street willfully ignores clear messaging from the Fed.
- Keywords/hashtags: #stockmarket #Investing #stocks #livetrading #Trading #fomc — macro/trading focus.
- Trading platforms named: Etrade pro (screen shown), ThinkOrSwim (long term investing), Fidelity (long Term).
- Links: JoshAnswers.com stock & options Bootcamp; unban form; Nightly Watchlist/main channel tutorial.
- Disclaimer: educational purposes only; do not copy trades; options trading risky; consult professional.
- Tickers: none explicitly named in EVIDENCE — lack of ticker specificity. -
Technical Levels & Setups OR Macro Drivers (📌):
- AI narrative clash: Trump/Jensen Huang dispelling 'AI hoax' versus recent software vs chip-stock divergence.
- Software sector relative strength: creator cites software's biggest day in history against chip stocks.
- Fed policy expectation gap: rate-hike odds imply hike while creator asserts no hike due to Fed messaging.
- FOMC hashtag and live trading around stock news.
- Multi-platform execution: Etrade pro screen shown, ThinkOrSwim/Fidelity for long term. -
Risk/Reward Framework (⚖️):
- Entry: Not established by the available evidence.
- Stop: Not established by the available evidence.
- Targets: Not established by the available evidence.
- Risk/Reward: Not established by the available evidence.
- Position Size: Not established by the available evidence.
- Probability: Not established by the available evidence. -
Scenario Analysis (🔄):
| Scenario | Probability | Target | Trigger |
|---|---|---|---|
| Bull | Not established by the available evidence. | Not established by the available evidence. | Creator's AI-hoax-disproval narrative and software-over-chip-stock strength continue; Trump/Jensen Huang statements validate software/AI demand. |
| Base | Not established by the available evidence. | Not established by the available evidence. | Live trading session proceeds with no explicit index target; focus remains stock news, software vs chip stocks, and Fed rate-hike messaging. |
| Bear | Not established by the available evidence. | Not established by the available evidence. | Fed rate hike actually occurs despite creator's claim it 'is not going to happen'; or Wall Street repricing Fed messaging invalidates no-hike thesis. | -
Risk Factors (⚠️):
- No specific tickers, prices, levels, valuations, entry/stop/target, position sizes, or probabilities in evidence.
- Creator's 'AI hoax' and 'not going to happen' rate-hike claims are assertions needing external verification.
- Potential internal tension: rate hike odds guaranteeing hike versus creator saying no hike.
- Live-trading stream may contain unrecorded real-time trades not represented in metadata.
- Educational disclaimer warns not to copy trades and cites options risk.
- No FOMC meeting date or specific Fed communication quoted. -
Actionable Trading/Allocation Plan (🎯):
- Review full video transcript for any tickers, levels, or trade parameters absent from metadata.
- Check software and semiconductor sector performance for claimed 'biggest day in history against chip stocks' on the session date.
- Compare rate-hike odds from CME FedWatch or equivalent with Fed messaging and FOMC calendar.
- Monitor creator's Nightly Watchlist/main channel and JoshAnswers Bootcamp for follow-up claims, treating them as unverified.
- Record timestamped quotes if creator provides specific trades, levels, or probabilities during live stream.

-
Creator Horizon Category (⏱️): Long-Horizon Macro — The creator frames AI/data centers as 'the oil of the next 20 25 years' and 'bigger than the internet,' a multi-decade macro claim.
-
One-Line Thesis (💡): Creator claims AI and data centers are a multi-decade boom—'the oil of the next 20 25 years' and 'bigger than the internet'—dismisses AI-takeover fears as 'a hoax,' and says 'whoever wins AI wins,' while warning political and China opposition could hinder US data-center leadership.
-
Key Data Points (📊):
- Headline: AI/data centers are 'the oil of the next 20 25 years' — creator macro thesis.
- Headline: AI is 'bigger than the internet' and 'whoever wins AI wins' — creator scale and geopolitical race claim.
- Headline: AI/data-center fears are 'a hoax'; 'robots are not going to be taking over the world' — creator dismissal of AI-takeover risk.
- Macro/geopolitical keyword: China 'is very happy' and political opponents are 'playing right into the hands' of people who don't want AI/data centers to happen — creator opposition claim.
- Macro/geography: Google wants to build a big data center in Finland; creator says he is 'not happy about' it because 'they were unable to get permitting' — permitting-constraint example.
- Local catalyst: data centers make states wealthy and turn 'dying' communities into 'really wealthy communities' — creator local-wealth claim.
- Technology/leadership: Jensen can develop 'the most complex computer chip in the world that nobody can copy for 10 years' — creator chip-leadership anecdote.
- Anecdote: creator says his uncle was a top MIT professor for 41 or 42 years — cited as genetic/common-sense basis for AI views.
- Policy stance: creator says 'we're not going to let' the anti-AI/data-center narrative happen; 'we're not going to stop an industry' — stated posture.
- Evidence gap: no ticker symbols, prices, levels, valuations, probabilities, position sizes, entries, stops, targets, or risk/reward ratios are stated in the excerpt. -
Technical Levels & Setups OR Macro Drivers (📌):
- AI/data-center buildout as a wealth-creation engine for states and communities.
- Permitting and local approval constraints, illustrated by Google's Finland project.
- Political opposition and China benefiting from US AI/data-center delays.
- US AI leadership race framed as zero-sum: 'whoever wins AI wins.'
- Creator's dismissal of AI takeover/robot risk as 'a hoax' reducing perceived regulatory need. -
Risk/Reward Framework (⚖️):
- Entry: Not established by the available evidence.
- Stop: Not established by the available evidence.
- Targets: Not established by the available evidence.
- Risk/Reward: Not established by the available evidence.
- Position Size: Not established by the available evidence.
- Probability: Not established by the available evidence. -
Scenario Analysis (🔄):
| Scenario | Probability | Target | Trigger |
|---|---|---|---|
| Bull | Not established by the available evidence. | Not established by the available evidence. | Creator asserts data centers are 'the oil of the next 20 25 years' and 'whoever wins AI wins'; verification condition is continued AI/data-center buildout, permitting approvals, and US policy support. |
| Base | Not established by the available evidence. | Not established by the available evidence. | Creator says 'we have to be careful... do things prudently' but 'we're not going to stop an industry'; verification condition is permitting/regulatory friction without a buildout halt. |
| Bear | Not established by the available evidence. | Not established by the available evidence. | Creator says political actors and China are happy/playing into hands of those who don't want AI/data centers; verification condition is permitting denial, policy blockage, or China AI/data-center gains. | -
Risk Factors (⚠️):
- No ticker, valuation, date, level, probability, entry, stop, target, or position-size parameters are established, limiting tradability of the claims.
- Claims are rhetorical and uncited; the 'hoax' framing is an assertion, not verified evidence.
- Permitting/regulatory constraints could delay or block data-center projects, as in the Google Finland example.
- Geopolitical risk: creator's own claim that China benefits from US AI/data-center opposition could materialize.
- AI safety/robot-takeover risk is dismissed without supporting analysis; invalidation risk if safety incidents or regulation accelerate.
- Transcript excerpt may be garbled and speaker attribution is not fully clear; verify original source. -
Actionable Trading/Allocation Plan (🎯):
- Verify the original All-In Podcast video and full transcript for exact wording, speaker attribution, and context.
- Track Google's Finland data-center project and permitting status as referenced in evidence.
- Monitor US federal/state/local data-center permitting and political opposition relative to the creator's 'hoax' claim.
- Track China AI/data-center investment and policy responses to test the creator's China-beneficiary claim.
- Monitor AI capex and data-center construction data to test the 'oil of the next 20 25 years' and 'dying communities now wealthy' claims.
- Watch for policy statements or actions around the creator's 'whoever wins AI wins' and 'not going to stop an industry' posture.

-
Creator Horizon Category (⏱️): Long-Horizon Macro / Structural — Evidence is a long-form AI-industry, regulation, frontier-lab, and RSI discussion centered on Nvidia and safety policy, not short-term price levels or trade parameters.
-
One-Line Thesis (💡): Jensen Huang claims AI-safety/extinction and RSI-spiral fears are largely made up or irresponsible, that actual AI harms so far come from compute-rich frontier labs, and that regulation should solve root-caused engineering problems while Nvidia stays apolitical and helps America lead.
-
Key Data Points (📊):
- Nvidia revenue exploded 97% year-over-year — host intro claim; no quarter, segment, or filing citation supplied.
- Nvidia called the most important stock in this market and Jensen Huang called arguably the best executive in history — host intro claims.
- Jensen Huang identified as founder, president, CEO of Nvidia — host intro claim.
- Nvidia described as the only computing platform that is a full stack AI factory — host/Jensen framing.
- Dario essay discussed: safety is paramount; safety and leadership are not false choices — Jensen claim.
- Coxin whistleblower discussed: serious matter, courage credited, but the scientific prediction about the future is said to be not grounded in science — Jensen claim.
- Pausing and pacing AI development described as voluntary options labs could use if they feel out of control — Jensen claim.
- Radiology prediction: in 5 years AI would completely take over and there would be no radiologists; Jensen says the opposite occurred, more radiologists are needed, and AI automated scan reading.
- Code prediction: within 6 to 12 months, 90% of code would be generated by AI, predicted last year; Jensen says this proved wrong.
- Jensen claim: actual AI problems so far have come from the labs because they have the most compute; high-school students or startups are unlikely sources because they lack compute.
- Jensen claim: four incidents from one lab and one giant incident from another lab; response should be root-cause engineering, sandboxes, runtimes, monitors, continuous monitors; if labs truly lack control, engineers should be sent in.
- David/host claim: Chinese lab makers of GLM will put 3 billion toward a recursive self-improvement run.
- David/host claim: zpoo.com founder just raised 5 billion and said one priority is AI that trains the next AI and automating as much of that as possible.
- Jensen on RSI: combination of in-context methods, skills, reflection, reinforcement learning, synthetic data generation; LoRA can improve weights without training the base model, then base model can be retrained with that experience.
- Jensen claim: RSI products must still be evaluated, tested, and checked for no regression before release; moving labs from research to engineering should improve control, verification, and evals.
- Jensen claim: Nvidia is apolitical, bipartisan, does not welcome political discourse, and employees are not allowed to speak for the organization or tweet on its behalf.
- Host claim: Satya said get measurement, standardization, and engineering right before regulation that could stymy things; Jensen says regulation should solve actual problems. -
Technical Levels & Setups OR Macro Drivers (📌):
- AI-safety narrative versus Jensen's historical prediction track record: failed doom forecasts are used to argue against alarmism.
- Frontier-lab incident risk concentrated by compute ownership: labs have the most compute and therefore are said to be where most danger originates.
- Regulatory design setup: Jensen favors solving actual measured problems and root causes rather than broad preemptive regulation.
- Research-to-engineering transition at frontier labs as a control mechanism for safety, verification, evals, and no-regression releases.
- Recursive self-improvement as technical catalyst and narrative catalyst: RSI framed as productivity enhancement rather than uncontrollable spiral.
- China AI competition: GLM lab RSI funding and zpoo.com 5B raise are presented as competitive developments.
- Nvidia positioning: apolitical, America-first, quiet execution culture, no employee political discourse.
- Compute concentration: only frontier labs are described as having enough compute for frontier danger or RSI.
- Release-process controls: evaluation, testing, no regression, sandboxes, runtimes, and continuous monitors as gating mechanisms.
- Dario essay and frontier-lab coalescence as a reputational and political catalyst around AI safety. -
Risk/Reward Framework (⚖️):
- Entry: Not established by the available evidence.
- Stop: Not established by the available evidence.
- Targets: Not established by the available evidence.
- Risk/Reward: Not established by the available evidence.
- Position Size: Not established by the available evidence.
- Probability: Not established by the available evidence. -
Scenario Analysis (🔄):
| Scenario | Probability | Target | Trigger |
|---|---|---|---|
| Bull | Not established by the available evidence. | Not established by the available evidence. | Jensen says the referenced lab incidents are within the labs' control to prevent and that RSI can be controlled by evaluation, testing, and no-regression checks before release. |
| Base | Not established by the available evidence. | Not established by the available evidence. | Labs transition from research to engineering while policy discussion focuses on measurement, standardization, and engineering before broad regulation, as described by the host's Satya reference and Jensen's response. |
| Bear | Not established by the available evidence. | Not established by the available evidence. | Jensen's stated alternative occurs: labs say they had incidents, do not know what happened, have no idea how to control it, and ask society for help; or RSI/extinction predictions drive regulation not tied to actual problems. | -
Risk Factors (⚠️):
- No independent verification in the transcript for the four incidents from one lab or the one giant incident from another lab.
- Dario's essay, the Coxin whistleblower matter, and the scientific-prediction criticism are summarized, with no primary documents included.
- Nvidia 97% year-over-year revenue growth is a host intro claim without filing or earnings citation.
- No ticker, price, valuation, entry, stop, target, position size, or probability is stated in the evidence.
- GLM 3 billion RSI allocation and zpoo.com 5 billion raise are host claims, not independently verified in the transcript.
- Transcript excerpt ends mid-sentence on RSI and may omit full podcast context.
- RSI technical claims lack timelines, measurable milestones, and independent benchmarks.
- Regulatory outcomes and lab incentives are discussed qualitatively, with no quantified policy probability. -
Actionable Trading/Allocation Plan (🎯):
- Verify Nvidia revenue growth and segment detail against Nvidia filings or earnings materials.
- Obtain root-cause reports or public details for the four incidents and one giant incident Jensen references.
- Track frontier-lab releases for sandboxes, runtime monitors, continuous monitoring, evals, and no-regression gates.
- Monitor GLM, Zhipu, and zpoo.com funding and RSI claims against official announcements.
- Monitor AI regulation proposals for whether they target measured actual problems or broad preemptive constraints.
- Track Nvidia policy and culture statements plus any employee disputes over political speech.
- Monitor evidence of the research-to-engineering transition at frontier labs.

-
Creator Horizon Category (⏱️): Other — The content is about adapting trading routines around life changes, not a specific short-term technical, long-horizon macro, or structural market horizon.
-
One-Line Thesis (💡): TheChartGuys' 'How To Trade When Life Changes' addresses how to trade through routine-disrupting life events such as a house move or new baby by discussing what to cut, what to protect, and how to adjust.
-
Key Data Points (📊):
- Literal title/headline: 'How To Trade When Life Changes' — core video framing.
- Literal description claim: trading through a house move, a new baby, or any other life change that blows up your routine — stated event types.
- Literal session focus: what to cut, what to protect, and how to adjust — described live discussion agenda.
- Literal participants: Join Dan, Lamont and Joey live — named speakers.
- Literal promotional claim: We've got a wealth of free resources to help you master the art of trading — resource CTA at https://www.chartguys.com/discover-more.
- Literal hashtags: #tradinglifestyle #daytrade #tradingstrategy — topic keywords.
- No tickers, macro keywords, prices, levels, valuation figures, or risk/reward ratios are present in EVIDENCE. -
Technical Levels & Setups OR Macro Drivers (📌):
- Life changes such as a house move or new baby that 'blows up your routine' — stated disruptive-event setup.
- Routine disruption requiring decisions on what to cut, what to protect, and how to adjust — stated live-session focus.
- Live discussion format with Dan, Lamont and Joey — described delivery mechanism.
- Free resources via chartguys.com/discover-more — promotional resource driver.
- No market ticker, technical level, macro catalyst, or trade setup is established by the provided metadata. -
Risk/Reward Framework (⚖️):
- Entry: Not established by the available evidence.
- Stop: Not established by the available evidence.
- Targets: Not established by the available evidence.
- Risk/Reward: Not established by the available evidence.
- Position Size: Not established by the available evidence.
- Probability: Not established by the available evidence. -
Scenario Analysis (🔄):
| Scenario | Probability | Target | Trigger |
|---|---|---|---|
| Base | Not established by the available evidence. | Not established by the available evidence. | Life change such as a house move or new baby disrupts trading routine; creator frames session around what to cut, what to protect, and how to adjust. | -
Risk Factors (⚠️):
- No specific market, ticker, level, entry, stop, target, or risk/reward data is present in METADATA-ONLY evidence; all such verification is missing.
- The creator claims routine disruption can require cutting/protecting/adjusting, but specific cut/protect/adjust rules are not established by the provided metadata.
- Because evidence is metadata-only, no live-session statements, charts, examples, or trading recommendations can be verified.
- Potential invalidation: if the full video contains only general lifestyle discussion, no actionable trading setup can be extracted. -
Actionable Trading/Allocation Plan (🎯):
- Verify the full video for specific cut, protect, and adjust guidance from Dan, Lamont, and Joey.
- Check the listed chartguys.com/discover-more resource for any additional trading-lifestyle materials.
- Monitor the source for named tickers, levels, timeframes, entry/stop/target parameters, or risk/reward ratios before treating any market claim as actionable.
- Confirm whether the discussion includes concrete portfolio implications or only routine-management commentary.
-
Creator Horizon Category (⏱️): Short-Term Technical — Title and description frame the content as live pre-market technical analysis for futures traders and options traders.
-
One-Line Thesis (💡): Trade Brigade’s metadata for a live pre-market prep headlines a gap down and AI-slowdown rumors pressuring markets, framed as technical analysis for futures and options traders.
-
Key Data Points (📊):
- Headline: '[LIVE] Pre-Market Prep – GAP DOWN – AI Slowdown Rumors Pressure Markets' — creator’s top-line framing.
- Claimed catalyst keyword: 'AI Slowdown Rumors' — cited as pressure on markets.
- Claimed market condition: 'GAP DOWN' — cited in the title.
- Schedule claim: live every trading day at 8:00 AM EST.
- Audience/coverage claim: pre-market technical analysis for futures traders and options traders. -
Technical Levels & Setups OR Macro Drivers (📌):
- AI slowdown rumors cited as market pressure in the title.
- Pre-market gap down cited in the title.
- Creator describes format as live pre-market technical analysis for futures/options traders. -
Risk/Reward Framework (⚖️):
- Entry: Not established by the available evidence.
- Stop: Not established by the available evidence.
- Targets: Not established by the available evidence.
- Risk/Reward: Not established by the available evidence.
- Position Size: Not established by the available evidence.
- Probability: Not established by the available evidence. -
Scenario Analysis (🔄):
| Scenario | Probability | Target | Trigger |
|---|---|---|---|
| Bull | Not established by the available evidence. | Not established by the available evidence. | Verification condition: AI slowdown rumors are unsubstantiated or fail to sustain market pressure, and the title's gap-down condition reverses during pre-market or session trading. |
| Base | Not established by the available evidence. | Not established by the available evidence. | Literal evidence: title asserts a gap down and AI slowdown rumors are pressuring markets; verify whether that pressure persists through the pre-market session. |
| Bear | Not established by the available evidence. | Not established by the available evidence. | Verification condition: AI slowdown rumors intensify or are confirmed, and the gap down deepens under continued market pressure. | -
Risk Factors (⚠️):
- Metadata-only evidence: no actual video transcript, chart levels, tickers, or statements beyond title/description.
- No source or substantiation for the 'AI Slowdown Rumors' claim is provided.
- No specific futures/options tickers, entries, stops, targets, or risk parameters are established.
- No confirmation that the claimed gap down or AI slowdown rumor affected specific sectors, valuations, or macro indicators. -
Actionable Trading/Allocation Plan (🎯):
- Verify the 'AI Slowdown Rumors' claim against primary sources or reputable news before assigning significance.
- Monitor whether the pre-market gap down persists or reverses during the 8:00 AM EST live session timeframe.
- Check the video or transcript for specific futures/options tickers, levels, and setups not present in metadata.
- Review linked Trade Brigade live squawk/newsletter for any stated trade parameters if seeking the creator’s actual plan.
- Separate creator headline claims from analyst interpretation before using for market intelligence.

-
Creator Horizon Category (⏱️): Short-Term Technical — The metadata frames the stream around live trading and stock news reacting to Fed-week AI headlines, a near-term event-driven session.
-
One-Line Thesis (💡): Stock Market Live's Sep 14 stream frames the session around 'AI FEAR EVERYWHERE' and 'major AI news from seemingly every corner,' with the stated key question being what that does to rate hike odds during the week of the Fed.
-
Key Data Points (📊):
- Title: 'AI FEAR EVERYWHERE - SEP 14 - Stock Market LIVE, Live Trading, Stock News' — headline framing
- Description: 'Traders react to the week of the Fed' — macro event focus
- Description: 'starting off with major AI news from seemingly every corner' — AI catalyst focus
- Description: 'The real question is what this does to rate hike odds' — rates transmission question
- Hashtag '#fomc' — Fed policy link
- Description names trading platforms: Etrade Pro (screen shown), ThinkOrSwim (long term investing), Fidelity (long Term) — operational context only -
Technical Levels & Setups OR Macro Drivers (📌):
- AI news cycle: creator frames 'AI FEAR EVERYWHERE' and 'major AI news from seemingly every corner'
- Fed week: creator says traders are reacting to 'the week of the Fed'
- Rate-hike odds as transmission channel: creator says the key question is what AI news does to rate hike odds
- Live trading format: stream labeled 'Stock Market LIVE, Live Trading, Stock News'
- FOMC hashtag signals policy focus -
Risk/Reward Framework (⚖️):
- Entry: Not established by the available evidence.
- Stop: Not established by the available evidence.
- Targets: Not established by the available evidence.
- Risk/Reward: Not established by the available evidence.
- Position Size: Not established by the available evidence.
- Probability: Not established by the available evidence. -
Scenario Analysis (🔄):
| Scenario | Probability | Target | Trigger |
|---|---|---|---|
| Bull | Not established by the available evidence. | Not established by the available evidence. | AI news during the week of the Fed is interpreted as not raising rate hike odds. |
| Base | Not established by the available evidence. | Not established by the available evidence. | AI news leaves rate-hike odds unchanged or unclear during the week of the Fed. |
| Bear | Not established by the available evidence. | Not established by the available evidence. | AI news during the week of the Fed is interpreted as raising rate hike odds. | -
Risk Factors (⚠️):
- Metadata-only: no video/transcript, so no specific AI headlines, tickers, market levels, or rate-hike odds values are verifiable
- No explicit bullish or bearish market thesis is stated in the available evidence
- No entry, stop, target, ratio, position size, or probability is stated in the available evidence
- Rate-hike odds are referenced as a question but no baseline, change, or expected direction is provided
- AI news cycle identified but no named companies, sectors, or valuation impacts are given
- FOMC/Fed-week event risk is implied but not quantified
- Creator disclaimer warns options trading is risky and that copying trades can lose money
- Live trading format may contain real-time trades not captured in metadata -
Actionable Trading/Allocation Plan (🎯):
- Review full video/transcript to extract named AI news items, tickers, sectors, and any Fed/rate-hike odds references
- Verify any market-implied rate hike odds data for the week referenced against independent sources
- Check whether the creator states explicit levels, entries, exits, position sizes, or risk/reward parameters; metadata contains none
- Record any specific tickers or platforms mentioned for follow-up, noting the creator's educational-use disclaimer
- Document the creator's disclaimer and educational-only framing for compliance review

-
Creator Horizon Category (⏱️): Other — The evidence discusses only an apparel collaboration, a Future Proof polo drop, and a festival giveaway, with no financial-market horizon.
-
One-Line Thesis (💡): The creator promotes a Tropical Bros apparel collaboration and a new polo dropping for Future Proof next week, with a women's cut available and a festival booth giveaway.
-
Key Data Points (📊):
- Collab with Tropical Bros — creator states the channel did a collaboration with Tropical Bros
- New polo dropping for Future Proof next week — creator states the new drop is for Future Proof next week
- Women's cut available — creator states a women's cut was made available for Inquiring minds
- Festival booth giveaway — creator states attendees can come by the booth for a chance to win polos
- No ticker, price, level, valuation, probability, position size, entry, stop, target, or risk/reward ratio is stated in the evidence -
Technical Levels & Setups OR Macro Drivers (📌):
- Tropical Bros apparel collaboration
- Future Proof polo drop described as coming next week
- Women's cut apparel availability
- Festival booth giveaway activation -
Risk/Reward Framework (⚖️):
- Entry: Not established by the available evidence.
- Stop: Not established by the available evidence.
- Targets: Not established by the available evidence.
- Risk/Reward: Not established by the available evidence.
- Position Size: Not established by the available evidence.
- Probability: Not established by the available evidence. -
Scenario Analysis (🔄):
| Scenario | Probability | Target | Trigger |
|---|---|---|---|
| Unavailable | Not established by the available evidence. | Not established by the available evidence. | Verify source evidence. | -
Risk Factors (⚠️):
- No financial thesis, ticker, catalyst, valuation, level, risk, or portfolio implication is established by the evidence.
- Exact Future Proof drop date is not established beyond 'next week'.
- Giveaway terms, eligibility, and event details are not established.
- The evidence is a short promotional transcript fragment with no market data to verify. -
Actionable Trading/Allocation Plan (🎯):
- Verify Future Proof drop timing and product details via The Compound or Future Proof channels.
- Verify Tropical Bros collaboration scope and women's cut availability via The Compound or Tropical Bros channels.
- Verify festival booth giveaway rules and location from event materials.
- Review the full video if available to determine whether any financial claims are omitted from this evidence.

-
Creator Horizon Category (⏱️): Long-Horizon Macro / Structural — Creator frames a post-2008 exponential AI/AGI regime as dominant over oil, bond, and Fed linear macro signals.
-
One-Line Thesis (💡): Jordi Visser claims AGI has arrived with Astra and that investors should focus on the exponential AI/agentic trade rather than linear oil, bond, and Fed signals, while saying Ethereum should outperform Bitcoin in a bull market and that fighting the AI trade is a bad idea.
-
Key Data Points (📊):
- AGI has arrived with Astra — creator's headline claim, saying this should be the big news story of the week rather than bond yields, oil, or Fed odds.
- Fed rate hike odds surged to 90% — creator cites this as an example of linear macro noise he says matters less than AGI.
- Core inflation was higher than expected yesterday and PPI was higher than expected — creator lists these alongside higher oil and worsening war.
- S&P was up slightly over the two days as of when the creator started recording — used to argue macro worries are not hitting equities.
- S&P is holding the 50-day for now and looks more like a flag formation after a big high — creator notes it is barely up since June 2nd.
- AI thematic portfolio broke above the 50-day today — creator describes a 10-name concentrated portfolio that is getting close to August highs.
- Bitcoin is flag range trading; Ethereum broke out and broke back in before today's close — creator says Ethereum/Bitcoin broke out again to the highest level since January.
- Bessent upsized buybacks to six billion and the market immediately sold off again — creator frames this as good news hit with bad news.
- Fed third mandate: moderate long-term interest rates — creator says Trump/Bessent/Warsh dynamics are testing the market.
- Bessent warns nothing else would matter if China wins the AI race — creator says there is no day after tomorrow if China wins this.
- Astra was trained on 100,000k; the next model is four times the size, and behind that are the Vera Rubins — creator's AI compute scaling claim.
- Research agents are now generating 3.1 workdays for every human workday — creator's agent productivity claim.
- Navier-Stokes challenge was hit using 10,000 AI agents working in parallel for 88 hours — creator says this has implications for physics and S&P 500 PE.
- Agents work at three to five times humans in creator's framing — used to argue digital labor bypasses human constraints.
- Revisions this week were 32 up there; this is the 20-week average of revisions — creator cites positive revisions.
- PMI leading indicators are doing great — creator's macro growth-support claim.
- HYG relative to IEF is creator's preferred real-time credit proxy over spreads; HY is not selling off as bonds sell off, overlaid with S&P.
- Bond VAs, junk spreads, and TIPS inflation expectations are not moving — creator says the market is saying it does not really care.
- Nvidia is trading at such a cheap PE — creator's qualitative valuation claim, no exact multiple given.
- MAG 7 has been the place to make money since 2008 — creator links this to the post-iPhone, transfer-payment, government-debt exponential regime.
- AI capex is driving the economy and is not at all rate sensitive — creator's core macro reason to ignore oil/bond/Fed signals.
- GDP formula: more people plus more capital plus higher productivity; with AI, digital labor and accelerating productivity change the constraint.
- New constraints may increasingly be compute, energy, and ability to deploy intelligence — creator's structural bottleneck claim.
- The PE of the S&P 500 going up five years — creator ties science breakthroughs and Navier-Stokes implications to this claim.
- Creator says he went to Silicon Valley in 2013 and that the exponential world took off after 2008 because of the iPhone release the year before and transfer payments/government debt. -
Technical Levels & Setups OR Macro Drivers (📌):
- Creator claims a linear-to-exponential regime shift began in 2008 after the iPhone release, rising transfer payments, and government debt, and says MAG 7 benefited.
- AI capex is described as the economy's key driver and 'not at all rate sensitive,' making oil, bonds, and Fed rate signals less relevant to his thesis.
- Astra/AGI setup: creator claims agentic AI, compute-to-intelligence-to-agents flywheel, GPU demand, next model four times size, and Vera Rubin behind that.
- Credit/inflation overlay: HYG/IEF relative proxy with S&P, bond VAs not moving, junk spreads not moving, TIPS inflation expectations not moving.
- Technical setup: S&P holding 50-day and flag formation after a big high; AI thematic 10-name concentrated portfolio above 50-day near August highs.
- Crypto setup: Bitcoin flag range trading; Ethereum/Bitcoin breakout to highest since January; creator says Ethereum should outperform Bitcoin in a bull market.
- Policy setup: Fed third mandate to moderate long-term interest rates; Bessent upsized buybacks to six billion; possible plan B of cutting long-term issuance outright.
- Market-policy conflict setup: creator says the market is testing Warsh and fighting Bessent/Trump, with Bessent being as obnoxious as possible.
- China AI race warning from Bessent as a macro catalyst; creator says this supports not fighting the AI trade, though he does not recommend buying bonds. -
Risk/Reward Framework (⚖️):
- Entry: Not established by the available evidence.
- Stop: Not established by the available evidence.
- Targets: Not established by the available evidence.
- Risk/Reward: Not established by the available evidence.
- Position Size: Not established by the available evidence.
- Probability: Not established by the available evidence. -
Scenario Analysis (🔄):
| Scenario | Probability | Target | Trigger |
|---|---|---|---|
| Bull | Not established by the available evidence. | Not established by the available evidence. | AI thematic 10-name portfolio holds above the 50-day and nears August highs; Ethereum/Bitcoin breakout continues; HYG/IEF credit proxy stays supportive; AI/AGI/agentic adoption narrative persists. |
| Base | Not established by the available evidence. | Not established by the available evidence. | S&P holds the 50-day and remains flag/range-bound, barely up since June 2nd; credit/inflation overlays stay quiet; low V consolidation continues. |
| Bear | Not established by the available evidence. | Not established by the available evidence. | Creator says the market can keep doing this unless the economy and earnings fall off; he also cites risk if China wins the AI race and if Bessent buybacks/long-term issuance news triggers selloffs. | -
Risk Factors (⚠️):
- Creator's 'AGI has arrived' claim is an assertion; verification requires primary sources such as OpenAI's Greg Brockman interview, Anthropic economics team, Astra documentation, and Navier-Stokes/agent claims.
- Linear macro signals could reassert: higher core inflation, higher PPI, Fed rate hike odds at 90%, higher crude oil, and worsening war headlines.
- Technical setups can fail: S&P 50-day, AI portfolio 50-day and August highs, and Ethereum's breakout that broke back in before today's close.
- Credit/inflation overlay can break: HYG/IEF relative proxy, bond VAs, junk spreads, and TIPS inflation expectations could start moving.
- Policy event risk: Bessent's six-billion buyback upsizing, possible plan B long-term issuance cut, and Warsh/Bessent/Trump market conflict.
- Creator says multiples are going to compress because terminal value shortens once AI disrupts a business and earnings stop growing — a valuation risk for equities.
- No exact entry, stop, target, ratio, position size, or probability is provided for any setup. -
Actionable Trading/Allocation Plan (🎯):
- Monitor S&P 500 50-day and flag range; creator cites holding the 50-day and flag formation after a big high.
- Track AI thematic 10-name concentrated portfolio versus 50-day and August highs.
- Track Ethereum/Bitcoin breakout and whether Ethereum holds the breakout after today's close; creator cites highest since January.
- Track HYG/IEF relative proxy, bond VAs, junk spreads, and TIPS inflation expectations as creator's credit/inflation overlay.
- Verify AGI/Astra claims via OpenAI Greg Brockman interview, Anthropic economics team, Astra documentation, and Navier-Stokes/agent productivity sources.
- Monitor Fed rate hike odds, core inflation, PPI, crude oil, war headlines, Bessent buybacks and six-billion figure, plan B long-term issuance, and third-mandate commentary.
- Monitor revisions 20-week average and PMI leading indicators as creator-cited growth supports.

-
Creator Horizon Category (⏱️): Other — The evidence covers media verification sentiment and a movie trailer, not a market thesis or financial horizon.
-
One-Line Thesis (💡): Creator's headline claim is that AI-induced image skepticism makes him screenshot and ask Claude for verification, while his media highlight is the apparently real Gatorface slasher/alligator trailer.
-
Key Data Points (📊):
- Ticker/macro keywords — none stated in the evidence.
- Gatorface trailer — creator says Google search confirms it is actually real.
- Gatorface — described as slasher horror, old school style, with alligators eating people.
- Thumbnail — creator cites a woman with her head between an alligator's jaws.
- AI fake images — creator describes seeing a picture, reposting it, and someone saying it is fake, leading to questioning everything.
- Claude — creator says he has been taking screenshots and asking Claude for verification.
- Creator sentiment — says he does not want to live in a world where such verification is needed. -
Technical Levels & Setups OR Macro Drivers (📌):
- AI-generated or fake-image doubt drives manual screenshot verification via Claude, per creator.
- Google search confirms Gatorface trailer is real, according to creator.
- Creator's slasher-horror and alligator interest drives enthusiasm for Gatorface.
- Thumbnail imagery — woman's head between alligator jaws — reinforces creator's stated interest. -
Risk/Reward Framework (⚖️):
- Entry: Not established by the available evidence.
- Stop: Not established by the available evidence.
- Targets: Not established by the available evidence.
- Risk/Reward: Not established by the available evidence.
- Position Size: Not established by the available evidence.
- Probability: Not established by the available evidence. -
Scenario Analysis (🔄):
| Scenario | Probability | Target | Trigger |
|---|---|---|---|
| Bull | Not established by the available evidence. | Not established by the available evidence. | Google search shows Gatorface trailer is real and matches creator's slasher/alligator preferences. |
| Base | Not established by the available evidence. | Not established by the available evidence. | Creator continues using screenshots and Claude to verify questionable images before reposting. |
| Bear | Not established by the available evidence. | Not established by the available evidence. | Someone says a reposted picture is fake, leading creator to question images and distrust them. | -
Risk Factors (⚠️):
- No financial instrument, ticker, valuation, level, date, catalyst, or portfolio implication is stated.
- Gatorface authenticity is creator's assertion based on a Google search and is not independently verified in the evidence.
- Claude verification reliability and method are not detailed. -
Actionable Trading/Allocation Plan (🎯):
- Verify Gatorface trailer existence and authenticity via official studio, YouTube, or Instagram sources if monitoring media claims.
- Track creator's stated AI-image verification workflow (screenshots, Claude) as a sentiment/theme data point, not as financial evidence.
- Do not infer ticker, trade, or portfolio action from this transcript; no such parameters are present.
-
Creator Horizon Category (⏱️): Short-Term Technical — The evidence focuses on SPY weekly, daily, and hourly levels, expected moves, and FOMC-week pathing.
-
One-Line Thesis (💡): The evidence presents Friday's CPI gap-up as a possible bull trap, with SPY's weekly bull flag conflicting with a daily lower-high setup that hinges on 76785 and 76025 into Wednesday's FOMC.
-
Key Data Points (📊):
- CPI gap up on Friday could be one of the largest bull traps in months — creator headline thesis
- Inflation report showed no progress towards 2% — macro claim
- 10-year rates are pressing 5% — macro level
- Scotty B's bond bazooka did absolutely nothing to bolster auctions into end of week — creator claim
- Mag 7s and select leaders acting as anchors for the market — creator claim
- SPY weekly: red-bodied hammer, lower high and lower low, broke previous bar low but closed back inside previous week's range — candle structure
- SPY weekly line in the sand near 75475 — level
- SPY weekly: above 10-week SMA/50-day moving average and above 20-week SMA; classic bull flag if resistance trend line breaks — technical
- Expected move upper bound 77710 and lower bound 75148 — levels
- Key inflection point 76785 — level
- Bottom end of range 76025 — level
- Daily CPI gap up: bearish inverted hammer, morning rally then weak close at lows of day session, below declining 20 SMA, at flattening 8 EMA — technical
- Daily trend count: lower low into daily 50 SMA, potential lower high — technical
- Bearish path references weekly level 75475, lower bound of weekly expected move, and 749 — downside levels
- FOMC on Wednesday is the wild card — catalyst
- Creator belief: market has priced in Kevin Worsh hiking rates; if he holds rates, Fed credibility goes out the window, bond market punishes him, market goes lower; if he hikes, market may reward credibility — macro claim
- 2-year yield is pushing higher — macro claim
- ZB 30-year bond: Scotty Bessant mentions backing stop with $6 billion; bond continues to sell off — creator claim
- Fib 61.8 reinforces key level; Friday low is fib 38.2 — technical confluence
- Anchored VWAPs on intraday: in the slop; need to clear top of stack at 76785 — technical
- Six additional trade ideas teased at end of show — not detailed in provided evidence -
Technical Levels & Setups OR Macro Drivers (📌):
- CPI hot on month-over-month but not so hot as to be game over; gap-up may be short squeeze or bull trap.
- Weekly bull flag and hammers conflict with daily lower-high and bearish inverted-hammer structure.
- Bullish SPY path requires holding 76025 early in week, reclaiming Friday low, clearing 76785, and retaking moving-average stack.
- Bearish SPY path starts if market fails above 76785, forms lower highs on hourly, and loses 76025; then expect lower into 75475 or deeper toward 75148/749.
- FOMC Wednesday and Kevin Worsh rate decision act as expectation confirmation or expectation breaker.
- Bond-market credibility and 30-year selloff after the $6B buyback claim are macro pressure points.
- Anchored VWAP stack and fib confluence reinforce 76785 as key level.
- Hourly trend count watches for a higher low versus Thursday low; break over 76785 after higher low would be compelling for higher. -
Risk/Reward Framework (⚖️):
- Entry: Not established by the available evidence.
- Stop: Not established by the available evidence.
- Targets: Close gap; 76025 bottom end of range; 75475 weekly level; Lower bound of weekly expected move at 75148; 749
- Risk/Reward: Not established by the available evidence.
- Position Size: Not established by the available evidence.
- Probability: Not established by the available evidence. -
Scenario Analysis (🔄):
| Scenario | Probability | Target | Trigger |
|---|---|---|---|
| Bull | Not established by the available evidence. | Top end of range / upper bound 77710 | Hold 76025 early week, reclaim Friday low, clear 76785, and retake moving-average stack. |
| Base | Not established by the available evidence. | Not established by the available evidence. | FOMC Wednesday wildcard; market holds 76025 but cannot clear 76785. |
| Bear | Not established by the available evidence. | 75475 weekly level, lower bound 75148, and 749 | Fail above 76785 or loss of 76025; lower highs on hourly chart. | -
Risk Factors (⚠️):
- FOMC and Kevin Worsh rate decision could invalidate both bullish and bearish pathing; creator claims a hike may be bullish while holding rates may be bearish.
- Weekly bull flag could invalidate the bearish daily lower-high setup.
- Bond market credibility risk and 30-year selloff despite $6B buyback claim.
- CPI gap-up may be short squeeze rather than new-money buying.
- Levels are expected-move and technical levels, not guaranteed support or resistance.
- Transcript ends before the six additional trade ideas, so those cannot be verified.
- No explicit stop, position size, probability, or risk/reward ratio is established in the evidence. -
Actionable Trading/Allocation Plan (🎯):
- Monitor SPY reaction at 76785 and 76025; creator says failure above 76785 or loss of 76025 supports the lower path.
- Verify whether 76025 holds early in the week and whether Friday low is reclaimed; creator's bullish path requires that.
- Track FOMC Wednesday and the Kevin Worsh rate decision against the creator's claim that a hike may be rewarded and a hold may be punished.
- Watch 10-year rates near 5%, 2-year yield direction, and ZB 30-year bond behavior after the $6B buyback claim.
- Check weekly close relative to 75475 and the bull flag resistance trend line.
- Check hourly anchored VWAP stack and whether price clears 76785.
- Review the full video for the six additional trade ideas not present in the provided evidence.

-
Creator Horizon Category (⏱️): Long-Horizon Macro / Structural — The claims concern LLM training-data governance, proprietary IP diffusion, and open-source versus closed-model confidentiality rather than a short-term market setup.
-
One-Line Thesis (💡): All-In Podcast speaker claims that LLM chats containing novel proprietary insights may be used for training even when personal information is excluded, and that the absence of NDA/confidentiality protections can diffuse organizational IP, driving a stated preference for open source.
-
Key Data Points (📊):
- Speaker claims novel scientific questions asked in an LLM chat were later described by the same model or next version under a different account: 'it actually just describes this exact thing that we had in our chat in the previous version.'
- Speaker qualifies this as 'a handful of anecdotal experiences' but says domain/niche novelty and lack of papers indicate no new external corpus: 'I know that there isn't some new corpus of information out there that's training the new model.'
- Speaker concludes: 'my conversation or our analyses have been used for training.'
- Speaker frames issue as model allowed to train on unidentifiable data: 'it doesn't use any of my personal information, but it can use an insight derived from our chat.'
- Speaker says no NDA or confidentiality provisions exist with the LLM service provider: 'We don't have any NDA or confidentiality provisions or protections with them being a service provider back to us.'
- Speaker states open-source preference: 'I care a lot about open source because I don't want them having my chat logs because they can use it for training to create an IP advantage that is now diffused to the rest of the market.'
- No ticker, price level, valuation, date, or portfolio position appears in EVIDENCE. -
Technical Levels & Setups OR Macro Drivers (📌):
- LLM provider may use insights derived from chats as training data even when personal information is stripped.
- Absence of NDA/confidentiality provisions with LLM service provider increases organizational IP exposure.
- Anecdotal cross-account/model-version replication of novel insight suggests training-data leakage to creator.
- Open-source models/self-hosting are framed as mitigation to prevent provider from holding chat logs and creating diffused IP advantage.
- Novel scientific/niche ideation with few published papers is the context where creator sees no external corpus that could explain later model output. -
Risk/Reward Framework (⚖️):
- Entry: Not established by the available evidence.
- Stop: Not established by the available evidence.
- Targets: Not established by the available evidence.
- Risk/Reward: Not established by the available evidence.
- Position Size: Not established by the available evidence.
- Probability: Not established by the available evidence. -
Scenario Analysis (🔄):
| Scenario | Probability | Target | Trigger |
|---|---|---|---|
| Bull | Not established by the available evidence. | Not established by the available evidence. | Creator states open-source preference because 'I don't want them having my chat logs because they can use it for training to create an IP advantage that is now diffused to the rest of the market.' |
| Base | Not established by the available evidence. | Not established by the available evidence. | Model is allowed to train on unidentifiable data: 'it doesn't use any of my personal information, but it can use an insight derived from our chat.' |
| Bear | Not established by the available evidence. | Not established by the available evidence. | Later account/version describes exact prior chat insight, and creator says 'We don't have any NDA or confidentiality provisions or protections with them being a service provider back to us.' | -
Risk Factors (⚠️):
- Creator's leakage evidence is explicitly anecdotal; causality between chat and later model output is not proven by EVIDENCE.
- Training-data opacity prevents independent verification of whether the same insight came from creator's chat or another source.
- No NDA/confidentiality provisions with provider means contractual protections may be absent or unverified.
- Model-version timing and cross-account comparisons could produce false positives without controlled testing.
- No ticker, valuation, level, date, or portfolio-size data in EVIDENCE limits market-impact assessment. -
Actionable Trading/Allocation Plan (🎯):
- Verify LLM provider contract/terms for training-on-inputs, opt-out, data retention, confidentiality, and NDA availability against creator's claim of no NDA/confidentiality provisions.
- Reproduce the creator's anecdotal test: ask a novel scientific question in one account, then query same or later model version from a different account for conceptual/verbatim leakage.
- Maintain timestamped internal logs of proprietary prompts, novel insights, and publication status to establish provenance if leakage is suspected.
- Assess open-source or self-hosted LLM deployment against the creator's stated concern about provider-held chat logs and IP diffusion.
- Track model release notes and version changes for post-training reappearance of previously non-public insights.

-
Creator Horizon Category (⏱️): Short-Term Technical — Creator frames next week's FOMC and constricting ranges breaking in the second half of September as the key near-term technical catalyst for Q4 2026 momentum.
-
One-Line Thesis (💡): TheChartGuys' Dan claims the market is in unusually tight constricting ranges into next week's FOMC, with the break likely deciding whether bulls or bears control Q4 2026, while he still treats longer-term charts as bull-controlled unless levels like SPY weekly EMA 12 and SMH support fail.
-
Key Data Points (📊):
- Creator claims FOMC next week is a significant event and that constricting/tightening ranges will break in the second half of September, dictating Q4 2026 momentum and the bulls-vs-bears battle of six-plus weeks.
- Creator claims market is pricing an 87% probability of a rate hike today, after PPI/CPI shifted prior 50/50 odds to a very likely rate hike.
- Creator says if there is no hike, the market is incorrect on pricing and that would be the more volatile event, especially Wed/Thu/Fri next week.
- Creator claims NASDAQ has gone almost straight sideways for almost three weeks in roughly a 3% range, the tightest such period probably in years.
- Creator says the S&P 500 has been weaker than NASDAQ due to industrials and less-important sectors, and is still testing weekly EMA 12; SPY weekly EMA 12 close below would significantly shift his bull perception.
- Creator claims SMH is in a sideways tightening range likely to break in September, or early October if not; bull break sets a monthly higher low, bear break toward the low would be most bearish since March 2025.
- Creator claims IGV is weakening with a daily downtrend approaching weekly support of 9972; bears need to take out 9972 to shape a monthly lower high.
- Creator claims MAGS is strongest short term and near all-time high; Nvidia double-topped at all-time high cited at 236 and 23450 and rolled over significantly, with potential head-and-shoulders on next bounce.
- Creator cites XLF made a new all-time high last Thursday but broke bear with no follow-through; if weekly EMA 12 is support, it is a weekly bull flag after all-time highs.
- Creator cites XLV much weaker this past week, but anything above 157 is a weekly higher low; EMA 12 coming into play.
- Creator cites industrials lost weekly uptrend, IYT monthly consolidation with EMA2 key, XLB materials chopping sideways toward weekly support.
- Creator cites ABBV double top at all-time highs, tightening range, weekly EMA 12 support; if XLV sets weekly higher low, ABBV is positioned well.
- Creator cites Tesla grinding up and getting tight; dollar in daily downtrend with double bottom and resistance zones; gold has daily double bottom and is trying a not-yet-set weekly higher low; silver set weekly higher low officially but he does not believe it and is watching for a megaphone if Monday bounce.
- Creator cites DRAM broke daily resistance to highest level in a couple months, but he watches MU and SNDK rather than only DRAM to avoid fakeouts.
- Creator claims summer volume lull with constricting ranges should end with volume spike and higher opportunity after six weeks, but direction depends on FOMC or a week after. -
Technical Levels & Setups OR Macro Drivers (📌):
- FOMC next week as major catalyst with creator-cited 87% market-implied rate hike probability.
- Constricting weekly and daily equilibrium ranges across NASDAQ, SMH, SPY, XLF, XLV, gold, Tesla, and other setups.
- S&P 500 weaker than NASDAQ because XLF and XLV have topped out and consolidated while NASDAQ remains sideways.
- Bear breaks in S&P/SPY have lacked follow-through when NASDAQ holds support, producing bounces.
- SMH weekly range break setup: bull break sets monthly higher low; bear break targets prior low and would be most bearish since March 2025.
- IGV daily downtrend into weekly support 9972; bear trigger is losing 9972 for a monthly lower high.
- Nvidia double top at all-time high and rollover, with potential head-and-shoulders on next bounce.
- Megaphone pattern watch in silver/metals after consecutive bull and bear breaks without follow-through.
- Memory setup: DRAM daily resistance break versus creator watching MU and SNDK to avoid fakeouts.
- XLF weekly EMA 12 as bull-flag support; XLV 157 as weekly higher-low threshold; ABBV double top and tightening range.
- Individual name watch: Meta relative strength, Apple high weekly close, Google/Amazon failed two-day bounces, Tesla tightening. -
Risk/Reward Framework (⚖️):
- Entry: Not established by the available evidence.
- Stop: Not established by the available evidence.
- Targets: Not established by the available evidence.
- Risk/Reward: Not established by the available evidence.
- Position Size: Not established by the available evidence.
- Probability: Not established by the available evidence. -
Scenario Analysis (🔄):
| Scenario | Probability | Target | Trigger |
|---|---|---|---|
| Bull | Not established by the available evidence. | Not established by the available evidence. | Creator says if SMH breaks bull on the weekly, a monthly higher low is being set; if SPY/XLF hold weekly EMA 12 and XLV sets a weekly higher low above 157, his bull framing remains. |
| Base | Not established by the available evidence. | Not established by the available evidence. | Creator assumes Monday and Tuesday are boring and says it is a question whether the range breaks for the FOMC or a week after. |
| Bear | Not established by the available evidence. | Not established by the available evidence. | Creator says if the sideways ranges break bear, if SMH breaks bear toward the low, or if SPY loses and closes below weekly EMA 12, his bull perception significantly shifts and he may reassess long/hedge exposure. | -
Risk Factors (⚠️):
- Creator not watching tick by tick due travel creates lack of continuity in his market read.
- Creator-cited 87% rate hike pricing could be wrong; no hike would make the market incorrect and be the more volatile event.
- Tight ranges can fake out in both directions; megaphone pattern can stop out both bulls and bears.
- Sector divergence: XLF and XLV topped out while NASDAQ sideways, shifting the prior inverse relationship less favorably for bulls.
- Nvidia double top and rollover, IGV weakening, Amazon gap down, and Google/Amazon no follow-through are stated bearish or failed-bounce risks.
- DRAM resistance break may be a fakeout; creator says watching MU and SNDK instead of only DRAM.
- No exact entry, stop, target, risk-reward ratio, or position size is established in the evidence.
- FOMC outcome and market reaction must be verified to confirm whether the range breaks bull or bear. -
Actionable Trading/Allocation Plan (🎯):
- Verify FOMC outcome and market reaction Wed-Fri next week, including whether a rate hike occurs and whether no-hike volatility materializes.
- Track whether NASDAQ, SMH, and SPY weekly ranges break and whether follow-through occurs, per creator's active-trader framing.
- Monitor SPY weekly close versus weekly EMA 12 as creator's stated bull-perception shift guide.
- Monitor IGV weekly support 9972, XLV 157 weekly higher-low threshold, and XLF weekly EMA 12.
- Track Nvidia double top/head-and-shoulders potential, Google/Amazon daily higher-low attempts, Meta weekly trend lines, Apple weekly close, and Tesla tightening.
- Track dollar double bottom/resistance zones, gold weekly higher low, silver megaphone if Monday bounce, and DRAM versus MU/SNDK memory.
- Cross-check creator's 87% rate-hike pricing claim against market-implied rates/futures.

-
Creator Horizon Category (⏱️): Long-Horizon Macro / Structural — Creators frame the video around AI-safety claims, regulatory capture, and Anthropic's S1/IPO tension rather than a near-term price setup.
-
One-Line Thesis (💡): All-In Podcast panel claims Jacob Coxin's resignation tweet alleging AI could kill us all is a coordinated doomer/regulatory-capture op, while Anthropic safety lead Evan Hubinger's >10% extinction-probability post creates an IPO/S1 product-liability contradiction for Anthropic's push toward a public listing in the trillions.
-
Key Data Points (📊):
- Headline claim: AI researcher Jacob Coxin quit Anthropic over fears AI could kill us all; worked at OpenAI then Anthropic over three years; started at Anthropic 6 weeks before resigning.
- Coxin quoted claim: people building AI earnestly believe it could kill us all by the end of the decade; not a marketing stunt; OpenAI and Anthropic racing straight to self-improving super intelligence and gambling with our lives.
- Viral metrics claim: Coxin tweet went to 150 million views; host compares it to an Elon/Coca-Cola tweet; separate claim says 110 million views on a Tuesday; two posts 200 million combined.
- Evan Hubinger, who leads Alignment Science at Anthropic, quoted claim: Jacob is correct here; we really do earnestly believe AI could kill all humans; personally thinks over 10% within the next decade; no plan yet to solve alignment.
- Political claim: Bernie Sanders proposed legislation to ban super intelligence and pause AI development; Governor JB Pritsker replied it is time to sound the alarm louder on reining in AI.
- Sacks claim: media calls Coxin a whistleblower, but no data, report, leaked information, facts, or evidence was brought forward; this is all vibes.
- Coordination claim: Coxin account had almost no activity, almost no followers, and no prior posts; if prior posts existed they were scrubbed; within a day it found a huge audience.
- Amplification claim: three well-organized, well-funded doomer groups amplified in first 15 minutes: Nathan Calvin/Encode AI pushing SP53; Peter Wilddeford/AI Policy Network pushing federal regulations; Daniel Koko Taio/AI Futures Project dropping a Rogan episode with same phraseology.
- Funding claim: all three groups are funded by Yan Talon, described as an EA mega donor doomer type and co-lead of the Anthropic Series A.
- Timing claim: Wall Street Journal story covering the resignation letter was posted minutes before the tweet storm itself; hosts call it an embargo and say WSJ was briefed under embargo and screwed up published times.
- Process claim: Coxin reached out to come on the pod, then canceled this morning; questions would include who connected him with the Wall Street Journal.
- Tenure claim: Coxin was relatively low-to-mid-level employee; estimates heard of 6 weeks to 3 months; Sacks says let's say 3 months or maximum 3 to 4 months.
- IPO claim: Anthropic has an active S1 process underway; hosts discuss asking public market investors to underwrite the company to a value in the trillions.
- Historical IPO examples cited: Google Playboy interview during quiet period; Slack CNBC comments about Tesla/SpaceX and Slack network effects almost stopped IPO and required S1 refiling/disclaimers.
- Regulatory-capture claim: end goal is to create a federal department of AI or AI regulator; some want a pause; some want a ban on super intelligence; Daario has called for FDAI.
- Analogy claim: Philip Morris-like situation where cigarettes are known to kill but company takes itself public and figures it out later; tobacco executives told Congress nicotine was not addictive in The Insider context.
- Freeberg examples: Al Gore's Inconvenient Truth IPCC forecasts have been disproven; Fauci said COVID would kill us all and led to lockdowns. -
Technical Levels & Setups OR Macro Drivers (📌):
- Viral AI-safety resignation tweet amplified by aligned doomer/regulatory groups; WSJ embargo timing; rapid jump from X/AI community to nightly news in under 24 hours.
- Anthropic internal validation by alignment lead Evan Hubinger creates product liability and false representation disclosure tension ahead of an S1/IPO.
- Push for federal AI regulator, AI department, pause, or ban on superintelligence; political amplification by Bernie Sanders and JB Pritsker.
- Coordination evidence claimed: blank account, rapid amplification by funded groups, donor link to Anthropic Series A, and pre-tweet WSJ story.
- Structural contradiction claimed: Anthropic says core product is unsolved and potentially civilization-ending while asking public investors to underwrite a trillion-dollar IPO. -
Risk/Reward Framework (⚖️):
- Entry: Not established by the available evidence.
- Stop: Not established by the available evidence.
- Targets: Not established by the available evidence.
- Risk/Reward: Not established by the available evidence.
- Position Size: Not established by the available evidence.
- Probability: Not established by the available evidence. -
Scenario Analysis (🔄):
| Scenario | Probability | Target | Trigger |
|---|---|---|---|
| Bull | Not established by the available evidence. | Not established by the available evidence. | Anthropic publicly renounces Coxin's claims as hyperbolic/no evidence and disavows or clarifies Hubinger's >10% extinction-probability post. |
| Base | Not established by the available evidence. | Not established by the available evidence. | Anthropic does not resolve the contradiction; internal employees continue validating Coxin; S1/IPO process faces ongoing liability and disclosure questions. |
| Bear | Not established by the available evidence. | Not established by the available evidence. | Anthropic agrees with the doomer claims or Bernie Sanders side, implying further development should be frozen or superintelligence banned, making a trillion-dollar IPO untenable. | -
Risk Factors (⚠️):
- No data, report, or leaked information from Coxin is presented, so the core whistleblower claim is unverified and described by Sacks as vibes.
- Coordination and amplification claims, including donor links and first-15-minute amplification, are not independently verified in the evidence.
- WSJ publication timing could be an embargo error rather than evidence of orchestration; exact timestamp mechanics are not established.
- No ticker, price, entry, stop, target, IPO date, or valuation figure besides the qualitative word trillions is established.
- Anthropic's internal employee support and inability to disavow the whistleblower may prevent resolution of the S1/IPO contradiction.
- Regulatory outcomes for Bernie Sanders bill, SP53, federal AI department, or AI regulator are not established by the evidence. -
Actionable Trading/Allocation Plan (🎯):
- Verify Jacob Coxin's X post view counts, account history, follower count, and posting timeline.
- Verify the Wall Street Journal article publication timestamp relative to the tweet storm and whether an embargo was used.
- Verify funding links between Yan Talon, Encode AI, AI Policy Network, AI Futures Project, and Anthropic Series A.
- Monitor Anthropic S1 or IPO filings for risk-factor language on product liability, safety, extinction risk, and false representation.
- Track Bernie Sanders bill, SP53, federal AI department, and AI regulator proposals for legislative progress.
- Monitor whether Anthropic publicly disavows or validates Coxin's and Hubinger's claims.
- Verify Evan Hubinger's role at Anthropic, his >10% claim, and any official Anthropic position on alignment risk.
- Check whether Jacob Coxin appears on All-In or other interviews after canceling this morning.

-
Creator Horizon Category (⏱️): Long-Horizon Macro / Structural — The discussion concerns retirement-account access and eligibility structure, not a short-term market trade or macro forecast.
-
One-Line Thesis (💡): The Compound hosts do not dispute the WSJ retirement-savings sequence—max out 401k, backdoor option, mega backdoor Roth 401k conversion, cash balance pension plan—and argue the missing caveat is that income level and employer access determine who can use these options.
-
Key Data Points (📊):
- mega backdoor Roth 401k conversion — WSJ article option cited by listener
- max out 401k — first step in WSJ sequence discussed by hosts
- backdoor option — second step in WSJ sequence discussed by hosts
- cash balance pension plan — fourth step in WSJ sequence discussed by hosts
- Hosts: 'No, I don't think so' — response to whether the WSJ sequence missed anything for maximizing retirement savings
- Hosts: income level probably has a say — caveat on eligibility and access
- Hosts: not everybody has access to a cash balance pension — access limitation
- Hosts: not all these options are open to every type of investor — broader access limitation
- Hosts: 'these are all very cool things, but unfortunately not everybody has access' — stated missing caveat
- Listener: already maxes out 401k but does not save for retirement anywhere else — personal situation
- Listener: asks if mega backdoor Roth 401k conversion is legit and a good option if available through employer — framing question -
Technical Levels & Setups OR Macro Drivers (📌):
- WSJ article as catalyst for listener question on mega backdoor Roth 401k conversion
- Listener already maxes 401k, creating demand for additional retirement savings options
- Employer plan availability gates mega backdoor Roth 401k conversion
- Income level affects eligibility and access per hosts
- Cash balance pension plan access limited; hosts cite not everybody has one
- Hosts’ central setup: retirement optimization ladder is acknowledged as cool but unevenly accessible -
Risk/Reward Framework (⚖️):
- Entry: Not established by the available evidence.
- Stop: Not established by the available evidence.
- Targets: Not established by the available evidence.
- Risk/Reward: Not established by the available evidence.
- Position Size: Not established by the available evidence.
- Probability: Not established by the available evidence. -
Scenario Analysis (🔄):
| Scenario | Probability | Target | Trigger |
|---|---|---|---|
| Bull | Not established by the available evidence. | Not established by the available evidence. | Employer plan and income level permit the listener to access mega backdoor Roth 401k conversion and potentially other options discussed. |
| Base | Not established by the available evidence. | Not established by the available evidence. | WSJ sequence—max 401k, backdoor, mega backdoor Roth 401k, cash balance pension—is acknowledged by hosts; they say no material omission besides access and income constraints. |
| Bear | Not established by the available evidence. | Not established by the available evidence. | Employer does not offer mega backdoor Roth 401k conversion or cash balance pension, and hosts emphasize not everybody has access. | -
Risk Factors (⚠️):
- No direct verification in transcript that listener's employer plan supports mega backdoor Roth 401k conversion
- No direct verification of listener's income eligibility or tax situation
- Cash balance pension availability not universal per hosts
- Legal or tax legitimacy and implementation details of mega backdoor Roth 401k conversion not independently verified in transcript
- No numeric limits, deadlines, or tax consequences provided
- Hosts do not provide personalized suitability analysis
- Plan-specific rules necessary to verify eligibility are not discussed -
Actionable Trading/Allocation Plan (🎯):
- Verify with employer or plan administrator whether the mega backdoor Roth 401k conversion is available through the employer.
- Confirm income-level eligibility and access constraints raised by hosts.
- Check whether employer offers a cash balance pension plan.
- Read the cited WSJ article to confirm the full sequence and caveats.
- Consult a qualified tax or retirement professional for personal suitability and tax treatment verification.

-
Creator Horizon Category (⏱️): Long-Horizon Macro — Creator frames US/Japan debt metrics, Treasury issuance, real rates, and Bank of Japan policy as macro issues that could be revisited in six months to a year.
-
One-Line Thesis (💡): Creator claims the key macro setup is US/Japan debt metrics—with the US singled out as worst—plus excessive US Treasury issuance and another equally large issue group, while real rates matter but something else may break across all industries; Bank of Japan policy is called hyper important and unlikely to give up soon.
-
Key Data Points (📊):
- Worst debt metrics: Japan and US named, then corrected to 'actually United States' — sovereign debt ranking claim.
- US government has been issuing too much debt, and creator says there is now another issue or group of issues equally big — fiscal/issuance risk.
- Treasury Secretary described as 'very unusual' — fiscal-policy personnel emphasis.
- Rich people don't talk to robots; they pay someone else to talk to robots and bring information back within reason — AI/robot information-intermediary claim.
- Korea called 'a pretty interesting country now' — Korea macro/structural focus.
- Real rates said to be relevant, but 'there's been something else' — real-rates caveat.
- Creator asks whether something is going to break and says it is impacting all industries at the same time — cross-industry break risk.
- Railroads cited as a prior important but specific thing, unlike current cross-industry impact — historical analogy.
- Creator says we could easily in 6 months be talking about this all over again — recurrence horizon.
- Asymmetric information claim: 'he knows what the Bank of Japan is going to do' — BOJ policy information edge.
- Bank of Japan 'not going to give up anytime soon' — BOJ policy persistence claim.
- 'Is it special? Yes. It's hyper important' — importance claim.
- No ticker symbols, price levels, valuations, entry, stop, target, ratio, or position size explicitly named in EVIDENCE. -
Technical Levels & Setups OR Macro Drivers (📌):
- US and Japan debt metrics, with US singled out as worst — sovereign debt sustainability setup.
- US Treasury issuance concern plus an additional equal-sized issue group — fiscal supply/policy setup.
- Real rates noted as relevant but insufficient — macro discount-rate setup.
- Bank of Japan policy path and asymmetric information — central-bank catalyst.
- Cross-industry simultaneity versus railroad-era specific shock — broad market contagion setup.
- Korea highlighted as interesting — regional macro setup.
- AI/robot information asymmetry via intermediaries — adoption/information access theme. -
Risk/Reward Framework (⚖️):
- Entry: Not established by the available evidence.
- Stop: Not established by the available evidence.
- Targets: Not established by the available evidence.
- Risk/Reward: Not established by the available evidence.
- Position Size: Not established by the available evidence.
- Probability: Not established by the available evidence. -
Scenario Analysis (🔄):
| Scenario | Probability | Target | Trigger |
|---|---|---|---|
| Base | Not established by the available evidence. | Not established by the available evidence. | Creator says we could easily in 6 months be talking about this all over again. |
| Bear | Not established by the available evidence. | Not established by the available evidence. | Creator asks 'Is something going to break?' and says it is impacting all industries at the same time. | -
Risk Factors (⚠️):
- Debt-metric ranking claim is uncorroborated and the specific metric is not specified.
- 'Another issue or group of issues' is not identified in EVIDENCE.
- 'Something else' beyond real rates is not defined in EVIDENCE.
- BOJ asymmetric-information claim cannot be verified from EVIDENCE.
- No tickers, levels, valuations, entries, stops, targets, or position sizes are present.
- Transcript is clipped and conversational; speaker attribution and context are partly ambiguous.
- Cross-industry break risk lacks timeframe, magnitude, or transmission channel.
- Korea and AI/robot remarks are suggestive but not developed into a testable thesis. -
Actionable Trading/Allocation Plan (🎯):
- Verify the specific debt metric behind the claim that the US has the worst debt metrics versus Japan.
- Track US Treasury issuance, fiscal deficit, and debt-service metrics for confirmation of the 'too much debt' claim.
- Monitor Bank of Japan communications and meetings plus real-rate developments for the 'not going to give up' and asymmetric-information claims.
- Review full source video or transcript to identify the unnamed 'another issue or group of issues' and the 'something else' beyond real rates.
- Screen cross-industry indicators such as credit spreads, earnings, and capex for evidence of simultaneous impact broader than the railroad-era analogy.
- Follow Korea macro/policy and AI/robot information-intermediary themes to see if creator develops them into explicit theses.
- Check whether any tickers, levels, valuations, or portfolio implications are mentioned outside the provided EVIDENCE.
-
Creator Horizon Category (⏱️): Short-Term Technical — The description states live pre-market technical analysis for futures and options traders and the title frames a live reaction to the CPI Inflation Report.
-
One-Line Thesis (💡): Trade Brigade's live pre-market prep centers on the CPI Inflation Report and its live market reaction, with the creator positioning the session as technical analysis for futures and options traders; no specific tickers, levels, trade parameters, or directional bias are established by the available metadata.
-
Key Data Points (📊):
- Headline: '[LIVE] Pre-Market Prep – CPI Inflation Report Live Market Reaction' — video title
- Schedule claim: live every trading day at 8:00 AM EST — description
- Audience claim: pre-market technical analysis for futures traders and options traders — description
- Macro catalyst keyword: CPI Inflation Report — title
- Technical analysis keyword: #TechnicalAnalysis — description hashtags
- Live keyword: #Live — description hashtags
- Promotional figure: Get 20% off TradeZella (Use 'TB') — description
- Linked resources: Live Squawk, Technical Analysis Course, Trading Scripts, Swing Trade Newsletter — description
- Community links: Join the Floor Traders, Free Discord, Follow on X @TradeBrigadeCo — description -
Technical Levels & Setups OR Macro Drivers (📌):
- CPI Inflation Report as live macro catalyst; creator frames session as live market reaction.
- Pre-market session scheduled around 8:00 AM EST for futures and options traders.
- Technical-analysis-focused preparation rather than fundamental valuation; no specific instruments named in metadata.
- No explicit levels, entries, stops, targets, or risk/reward disclosed in available metadata. -
Risk/Reward Framework (⚖️):
- Entry: Not established by the available evidence.
- Stop: Not established by the available evidence.
- Targets: Not established by the available evidence.
- Risk/Reward: Not established by the available evidence.
- Position Size: Not established by the available evidence.
- Probability: Not established by the available evidence. -
Scenario Analysis (🔄):
| Scenario | Probability | Target | Trigger |
|---|---|---|---|
| Bull | Not established by the available evidence. | Not established by the available evidence. | Verification condition: check the full video transcript for a bullish setup tied to the CPI Inflation Report live reaction. |
| Base | Not established by the available evidence. | Not established by the available evidence. | Verification condition: check the full video transcript for a base-case setup tied to the CPI Inflation Report live reaction. |
| Bear | Not established by the available evidence. | Not established by the available evidence. | Verification condition: check the full video transcript for a bearish setup tied to the CPI Inflation Report live reaction. | -
Risk Factors (⚠️):
- No transcript or video content in evidence; specific tickers, levels, and trade plans cannot be verified.
- No CPI consensus, actual, or surprise figure is provided; macro reaction direction is not established.
- No entry, stop, target, position size, or probability is disclosed; setup invalidation is unverifiable.
- Metadata provides no contingency plan for the CPI Inflation Report live market reaction.
- Description includes a disclaimer that it is informational only, not financial or legal advice; creator claims are not independently validated. -
Actionable Trading/Allocation Plan (🎯):
- Retrieve full video transcript or recording to verify any tickers, chart levels, entries, stops, or targets mentioned during the live session.
- Verify the CPI Inflation Report release against an official inflation data source or primary economic calendar, including consensus and actual figures.
- Monitor the live market reaction in the futures/options instruments the creator discusses, but only after identifying them from the source.
- Check Trade Brigade's linked Live Squawk, newsletter, and scripts for any documented setups or levels not included in metadata.
- Record the stated 8:00 AM EST schedule for time-stamping any later claims.

-
Creator Horizon Category (⏱️): Other — Episode spans an October 16th iPhone Duo launch catalyst and Jens Nordvig's claim that macro markets are the most interesting he has seen, with structural AI/data and private-market themes.
-
One-Line Thesis (💡): The Compound episode pairs a bullish novelty-driven iPhone Duo launch discussion ($2,000 price, October 16th sale, expected sellout) with Vanda president Jens Nordvig's claim that macro markets are more interesting than ever and that combining flow/positioning data with AI and human-vetted insights is the commercial edge.
-
Key Data Points (📊):
- Private capital projected to hit 26.7 trillion by 2030 — Franklin Templeton sponsor-read claim.
- iPhone Duo / 'iPhone 2' headline price $2,000 — host/guest discussion; one version up to almost $4,000 mentioned.
- iPhone Duo financing $53 per month vs iPhone 18 Pro Max roughly $38 per month, or $23 more — host/guest discussion.
- On sale October 16th — stated in the iPhone Duo segment.
- Tech blogs expected $2,500; lower average selling price surprised consumers — creator/guest claim.
- Apple will sell out however many they can make, which will not be a lot — creator/guest claim.
- Sell out immediately because it is novel; long time since there was anything novel — creator/guest claim.
- Vision Pro mentioned as something nobody needs, while everybody needs the phone — creator/guest claim.
- Jens Nordvig is president and board member of Vanda; founded Exante Data in 2016; served more than 100 institutional clients; Exante merged with Vanda.
- New platform launch soon called Van Analytics — guest claim.
- Jens Nordvig: 'I've never seen markets being more interesting than they are now' — macro markets prime-time claim.
- Hybrid data model: data-only business is tricky; clients want vetted insights; AI robot for speed; humans for top-notch conceptual thinking and vetting.
- Josh Brown heuristic: rich people do not talk to robots; they pay someone else to talk to the robots and bring back vetted information.
- Franklin Templeton sponsor read promotes private credit, private equity, real assets and ftprivatearkets.com; disclaimer notes investing involves risk including possible loss of principle. -
Technical Levels & Setups OR Macro Drivers (📌):
- iPhone Duo novelty and limited supply drive expected immediate sellout; monthly financing frames $2,000 as $53 per month and reduces headline-price friction.
- Apple is described as not targeting the person worried about the price of the phone; next iteration could be Duo Pro, bigger, faster and more expensive.
- Vanda/Exante merger combines Exante's currency and fixed-income focus with Vanda's macro-equity and retail-flow tracking.
- AI efficiency is framed as a competitive edge requiring scale; clients still demand human-vetted macro insight rather than raw data or black-box output.
- Private markets access gap: institutions have been in private markets for decades while most individual investors barely have a toe in the water.
- Macro markets are described as exceptionally interesting, supporting demand for positioning data, flow intelligence and tactical macro insight. -
Risk/Reward Framework (⚖️):
- Entry: Not established by the available evidence.
- Stop: Not established by the available evidence.
- Targets: Not established by the available evidence.
- Risk/Reward: Not established by the available evidence.
- Position Size: Not established by the available evidence.
- Probability: Not established by the available evidence. -
Scenario Analysis (🔄):
| Scenario | Probability | Target | Trigger |
|---|---|---|---|
| Bull | Not established by the available evidence. | Not established by the available evidence. | iPhone Duo launches October 16th at $2,000 and sells out immediately because it is novel and supply is limited, as discussed; macro markets remain more interesting than ever and Van Analytics AI/human-vetted insights gain client adoption. |
| Base | Not established by the available evidence. | Not established by the available evidence. | iPhone Duo goes on sale October 16th at $2,000 with $53 per month financing, roughly comparable to iPhone 18 Pro Max financing as discussed, while Vanda/Exante integration and Van Analytics launch proceed without an explicit demand forecast. |
| Bear | Not established by the available evidence. | Not established by the available evidence. | Headline-price complaints or a $2,500 pricing path weaken iPhone demand, with the discussion noting uncertainty whether it sells out at $2,500; AI-generated macro insight proves outdated or unvetted, repeating the data-only business difficulties described. | -
Risk Factors (⚠️):
- No unit sales, revenue, margin, or valuation data for Apple or the iPhone Duo is provided; demand claims are speculative.
- Pricing risk: discussion notes complaints about the headline price and uncertainty whether the device sells out at $2,500.
- Supply risk: claim that Apple will sell out however many it can make, but 'not a lot' implies constrained volume.
- AI insight risk: robot-generated macro analysis may be outdated or insufficiently vetted; clients want confidence and human responsibility.
- Sponsor conflict: the 26.7 trillion private-capital projection and private-markets access framing come from a Franklin Templeton sponsor read.
- Evidence is truncated mid-sentence at 'market mic,' so the full macro thesis and any specific market calls are not established.
- No tickers, entry, stop, target, position size, probability, or risk/reward parameters are stated in the evidence. -
Actionable Trading/Allocation Plan (🎯):
- Verify the October 16th iPhone Duo on-sale date and track sell-through, delivery wait times, and supply constraints against the expected-sellout claim.
- Check current Apple/carrier financing: $2,000 headline price, $53 per month for iPhone Duo, and roughly $38 per month for iPhone 18 Pro Max.
- Monitor whether Apple follows the discussed pattern of launching a higher-priced Duo Pro after the initial lower average selling price.
- Verify Vanda/Exante merger details, Jens Nordvig's role, the more-than-100 institutional-client claim, and the Van Analytics platform launch.
- Track whether macro flow/positioning data demand and AI-plus-human-vetted insight models are adopted by institutional and wealth clients.
- Attribute the 26.7 trillion by 2030 private-capital figure to Franklin Templeton's sponsored material and seek independent corroboration.
- Review the full episode transcript for any omitted macro calls, tickers, levels, or portfolio implications beyond this truncated evidence.

-
Creator Horizon Category (⏱️): Short-Term Technical — Video title and description frame a live trading/stock news stream with #fomc and 'current market environment' but provide no explicit horizon or directional thesis.
-
One-Line Thesis (💡): Creator headline claims 'Something is brewing...' for a SEP 11 Stock Market LIVE/live trading/stock news stream, but the available evidence does not state a specific ticker, catalyst, level, or directional thesis.
-
Key Data Points (📊):
- Title: 'Something is brewing... - SEP 11 - Stock Market LIVE, Live Trading, Stock News' — video headline claim.
- #fomc — macro keyword hashtag in description; no FOMC date, decision, or market impact stated.
- Description references '25 years ago' and thanks police, firefighters, and veterans — non-market contextual statement.
- Trading platforms listed: Etrade Pro (screen shown), ThinkOrSwim (long term investing), Fidelity (long term).
- Creator disclaimer: 'Option trading is really risky and you are more than likely going to lose your money copying anything you see on this stream or channel.'
- Creator disclaimer: 'Do not copy the trades.'
- No tickers, prices, valuations, levels, entries, stops, targets, position sizes, probabilities, or risk/reward ratios are stated in EVIDENCE. -
Technical Levels & Setups OR Macro Drivers (📌):
- Headline phrase 'Something is brewing...' implies a developing market setup, but no specific catalyst or direction is named in EVIDENCE.
- Live trading/stock news format and #fomc hashtag suggest focus on current market news and macro event risk, but EVIDENCE does not specify the event timing or expected outcome.
- Creator notes the stream is live and in real-time and may not answer questions when 'in my zone trading given the current market environment' — implies active intraday trading context.
- No specific technical setup, level, ticker, or trade structure is provided in EVIDENCE. -
Risk/Reward Framework (⚖️):
- Entry: Not established by the available evidence.
- Stop: Not established by the available evidence.
- Targets: Not established by the available evidence.
- Risk/Reward: Not established by the available evidence.
- Position Size: Not established by the available evidence.
- Probability: Not established by the available evidence. -
Scenario Analysis (🔄):
| Scenario | Probability | Target | Trigger |
|---|---|---|---|
| Unavailable | Not established by the available evidence. | Not established by the available evidence. | Verify source evidence. | -
Risk Factors (⚠️):
- Metadata-only source: no transcript, on-screen levels, positions, or performance data are available.
- Title 'Something is brewing...' is an unverified headline claim without a stated ticker, catalyst, level, or direction.
- #fomc hashtag implies macro event risk, but EVIDENCE does not establish timing, outcome, or market reaction.
- Creator states options trading is risky and viewers are more than likely to lose money copying stream trades; no risk controls are provided in EVIDENCE. -
Actionable Trading/Allocation Plan (🎯):
- Monitor the source video/transcript for the specific 'Something is brewing...' claim and any named ticker, catalyst, level, or FOMC reference.
- If the creator later states any ticker, entry, stop, target, or position size, verify it against primary market data before treating it as an evidence-bound parameter.
- Treat all trade examples as educational per creator disclaimer and do not infer probability, position sizing, or risk/reward from the metadata.

-
Creator Horizon Category (⏱️): Long-Horizon Macro / Structural — Creator frames Apple's foldable, A20 on-device AI, and handset demand across Q4, 27, and a potential new product category rather than a short-term technical setup.
-
One-Line Thesis (💡): Creator claims Apple's foldable under $2,000, A20 two-nanometer TSM on-device AI, and iPhone 18 Pro/Pro Max $100 price increase will drive handset demand, with foldable supply constrained in Q4 but potentially a blockbuster by 27.
-
Key Data Points (📊):
- TSM / A20 / two-nanometer — Creator claim: the A20 chip is a two-nanometer chip manufactured by TSM, specifically designed so Apple can run AI and agentic workflows on device.
- Apple foldable / under $2,000 — Creator says the duo/foldable is coming out under $2,000; tech blogger consensus was more like 2500, which creator calls an upside surprise.
- Foldable supply / Q4 — Creator says they will not be able to make enough foldables for it to move the needle in Q4, but hopes it becomes a blockbuster product in 27.
- iPhone 18 Pro and Pro Max / +$100 — Creator says both will be up $100, well within expectations, and expects them to sell a ton.
- Apple AI / on-device — Creator disagrees with Malcolm that there is no AI; says Apple's on-device work is far in advance of what anyone else is doing and probably will do.
- Apple LLM — Creator says Apple does not have its own LLM, or has one internally that is not really in use; creator says that is perfectly fine and cites Apple not having its own search engine while selling a billion iPhones.
- Watch and AirPods — Creator calls them nice, but says the big picture is how many handsets and whether foldable becomes a massive category; creator says yes. -
Technical Levels & Setups OR Macro Drivers (📌):
- Foldable price below $2,000 versus roughly 2500 blogger consensus as a demand catalyst; creator expects waiting lists.
- A20 two-nanometer chip from TSM enabling Apple on-device AI and agentic workflows, aligned with Apple's safety and security brand.
- iPhone 18 Pro and Pro Max $100 price increase described as within expectations, supporting creator's expectation of high unit sales.
- Foldable supply constraint limiting Q4 revenue impact, with 27 positioned as the potential blockbuster year.
- Absence of an active public Apple LLM not treated as disqualifying by creator, using the search-engine analogy. -
Risk/Reward Framework (⚖️):
- Entry: Not established by the available evidence.
- Stop: Not established by the available evidence.
- Targets: Not established by the available evidence.
- Risk/Reward: Not established by the available evidence.
- Position Size: Not established by the available evidence.
- Probability: Not established by the available evidence. -
Scenario Analysis (🔄):
| Scenario | Probability | Target | Trigger |
|---|---|---|---|
| Bull | Not established by the available evidence. | Not established by the available evidence. | Creator says the foldable is going to be a hit, under $2,000 versus roughly 2500 consensus leads to waiting lists, and hopefully in 27 it becomes a blockbuster product; on-device A20 AI is far in advance of rivals. |
| Base | Not established by the available evidence. | Not established by the available evidence. | Creator says foldable cannot be made in enough volume to move the needle in Q4; iPhone 18 Pro/Pro Max are up $100 within expectations and should sell a ton; watch and AirPods are nice but secondary. |
| Bear | Not established by the available evidence. | Not established by the available evidence. | Malcolm's claim that there is no AI is referenced; creator concedes Apple lacks its own LLM or has one internally not really in use, and foldable supply is explicitly unable to move the Q4 needle. | -
Risk Factors (⚠️):
- Supply constraint risk: creator says Apple will not be able to make enough foldables to move the needle in Q4.
- AI thesis dispute: Malcolm's claim that there is no AI is cited, and creator concedes Apple's LLM is absent or internal and not really in use.
- Demand forecast risk: creator expects iPhone 18 Pro/Pro Max to sell a ton and foldable to create waiting lists, but no unit, revenue, or probability figures are provided.
- Category adoption risk: creator says the big question is whether foldable becomes a massive category, which remains an assertion rather than evidence-backed outcome.
- No valuation, earnings, margin, or financial target is established in the evidence. -
Actionable Trading/Allocation Plan (🎯):
- Verify the foldable launch price against creator's under $2,000 claim and the cited roughly 2500 tech blogger consensus.
- Track TSM's two-nanometer A20 chip production and Apple's on-device AI/agentic workflow claims for corroboration.
- Monitor Q4 foldable supply and whether it moves the needle, then track 27 evidence for the blockbuster-product thesis.
- Check iPhone 18 Pro and Pro Max pricing against the stated $100 increase and monitor sell-through/unit demand commentary.
- Assess Apple's LLM status relative to creator's claim that it is internal and not really in use.
- Watch for waiting lists or order delays as the creator-predicted foldable demand indicator.
-
Creator Horizon Category (⏱️): Short-Term Technical — The title and description frame the video as live pre-market technical analysis for futures and options traders reacting to the PPI inflation report.
-
One-Line Thesis (💡): Trade Brigade's live pre-market prep is headlined by the PPI inflation report and its live market reaction, positioned as technical analysis for futures and options traders.
-
Key Data Points (📊):
- Title: '[LIVE] Pre-Market Prep – PPI Inflation Report Live Market Reaction' — headline catalyst.
- Description: 'We are live every trading day at 8:00 AM EST providing the best pre market technical analysis for futures traders and options traders.' — schedule and audience claim.
- Catalyst keyword: PPI Inflation Report — macro inflation release in title.
- Instrument classes: futures traders and options traders — stated audience, not specific tickers.
- Promotional item: TradeZella 20% discount — description claim.
- Disclaimer: informational only, not financial or legal advice, not Registered Investment Advisor, buying and selling financial instruments is highly speculative and carries risk — creator statement.
- No ticker, price level, valuation, entry, stop, target, ratio, position size, or probability is stated in the provided metadata. -
Technical Levels & Setups OR Macro Drivers (📌):
- PPI inflation report as live macro catalyst.
- Pre-market live market reaction to the PPI report.
- Technical analysis for futures and options traders.
- Recurring live schedule: every trading day at 8:00 AM EST.
- No explicit directional setup, ticker, or level is established by metadata. -
Risk/Reward Framework (⚖️):
- Entry: Not established by the available evidence.
- Stop: Not established by the available evidence.
- Targets: Not established by the available evidence.
- Risk/Reward: Not established by the available evidence.
- Position Size: Not established by the available evidence.
- Probability: Not established by the available evidence. -
Scenario Analysis (🔄):
| Scenario | Probability | Target | Trigger |
|---|---|---|---|
| Bull | Not established by the available evidence. | Not established by the available evidence. | Verification condition: whether the PPI inflation report live market reaction is interpreted bullishly in the pre-market session. |
| Base | Not established by the available evidence. | Not established by the available evidence. | PPI Inflation Report is released and Trade Brigade proceeds with scheduled 8:00 AM EST pre-market technical analysis for futures and options. |
| Bear | Not established by the available evidence. | Not established by the available evidence. | Verification condition: whether the PPI inflation report live market reaction is interpreted bearishly in the pre-market session. | -
Risk Factors (⚠️):
- Metadata-only evidence: no transcript, so no actual thesis, levels, tickers, or risk management claims can be verified.
- PPI inflation report can produce macro volatility; creator's disclaimer says buying and selling financial instruments is highly speculative and carries risk.
- No explicit invalidation level or stop is stated in the metadata.
- Promotional links may contain additional claims not verified by the evidence.
- No portfolio implication or allocation guidance is stated in the metadata. -
Actionable Trading/Allocation Plan (🎯):
- Review the source video or transcript for any stated tickers, levels, directional bias, or risk parameters, since the metadata-only evidence does not include them.
- Verify the PPI inflation report release details and timing via an official economic calendar before relying on the title as a catalyst.
- Monitor whether the live stream's stated 8:00 AM EST pre-market technical analysis for futures or options includes explicit setups; treat any promotional links as separate from market analysis.
- Record any creator-provided entry, stop, target, ratio, position size, or probability only if literally stated in the video; none are present in the metadata.

-
Creator Horizon Category (⏱️): Short-Term Technical — The evidence supports this horizon classification.
-
One-Line Thesis (💡): Creator headline claim: 'Bessent Wants A SQUEEZE (No Bessent)' and description: 'Main goal is squeeze the bond shorts' in a SEP 10 live trading/stock news stream tagged #fomc.
-
Key Data Points (📊):
- Title headline: 'Bessent Wants A SQUEEZE (No Bessent) - SEP 10 - Stock Market LIVE, Live Trading, Stock News' — creator's lead claim references Bessent and a squeeze, with parenthetical 'No Bessent'.
- Description: 'Main goal is squeeze the bond shorts...' — stated objective is to squeeze bond shorts.
- Hashtags include #stockmarket #Investing #stocks #livetrading #Trading #fomc — FOMC is the only macro event keyword explicitly present.
- Trading platforms listed: Etrade pro (screen shown), ThinkOrSwim (long term investing), Fidelity (long Term) — portfolio/tooling context.
- Creator links Stock & options Bootcamp at JoshAnswers.com — educational/options context.
- Disclaimer: educational purposes only; 'Do not copy the trades'; option trading is risky and copying may lose money — creator-stated risk caveat.
- Nightly Watchlist/main channel tutorial link present — additional source not analyzed in evidence. -
Technical Levels & Setups OR Macro Drivers (📌):
- Bond-short squeeze as creator-stated main goal.
- Bessent reference in headline with 'No Bessent' caveat.
- FOMC hashtag as possible macro/event driver.
- Live trading and stock news format.
- Options trading bootcamp and risk disclaimer.
- Long-term investing platforms listed separately from live trading. -
Risk/Reward Framework (⚖️):
- Entry: Not established by the available evidence.
- Stop: Not established by the available evidence.
- Targets: Not established by the available evidence.
- Risk/Reward: Not established by the available evidence.
- Position Size: Not established by the available evidence.
- Probability: Not established by the available evidence. -
Scenario Analysis (🔄):
| Scenario | Probability | Target | Trigger |
|---|---|---|---|
| Bull | Not established by the available evidence. | Not established by the available evidence. | Literal description states 'Main goal is squeeze the bond shorts'; verification condition is bond shorts being forced to cover. |
| Base | Not established by the available evidence. | Not established by the available evidence. | Literal format is 'Stock Market LIVE, Live Trading, Stock News' with #fomc; verification condition is a live session without disclosed direction, level, or target. |
| Bear | Not established by the available evidence. | Not established by the available evidence. | Literal title includes '(No Bessent)'; verification condition is absence of the referenced Bessent-related squeeze or failure of bond shorts to cover. | -
Risk Factors (⚠️):
- No ticker, bond instrument, yield level, entry, stop, target, or position size is provided in EVIDENCE.
- No transcript or visual data in METADATA-ONLY evidence; on-screen trades and charts unavailable.
- 'Bessent' and '(No Bessent)' are not explained; identity, role, and intended meaning are not established.
- 'Squeeze the bond shorts' lacks timing, magnitude, instrument, and market direction specifics beyond the phrase.
- FOMC hashtag does not establish an FOMC date, policy expectation, or outcome.
- Creator disclaimer states options trading is risky and copying trades may lose most or all of initial investment. -
Actionable Trading/Allocation Plan (🎯):
- Verify creator's exact bond-squeeze claim against the stream transcript or on-screen charts; metadata alone does not support a level or instrument.
- Clarify what 'Bessent' and '(No Bessent)' mean in the title, since EVIDENCE does not explain them.
- Monitor FOMC-related news only as a possible catalyst because #fomc is present but no event detail is given.
- Check linked Nightly Watchlist/main channel for any tickers or levels not present in this EVIDENCE.
- Treat the creator's own options-risk and do-not-copy-trades disclaimers as context for any claims made in the stream.
- Record that risk_reward fields are unstated; do not infer entry, stop, target, ratio, size, or probability.

-
Creator Horizon Category (⏱️): Short-Term Technical — The creator frames CPI at 8:30 Friday and daily/hourly SPY/QQQ levels as the immediate decision points.
-
One-Line Thesis (💡): Trade Brigade's Matt claims the market is stuck in a chopping balance range, with CPI at 8:30 Friday as the catalyst that decides whether balance rules persist; he flags SPY/ES 762 support, 76785 flag lows, 774.85 equal highs and QQQ 7135–71250/71675/722/724/72920/707 as key levels.
-
Key Data Points (📊):
- Headline: market stuck, chopping in range; bears couldn't get lower high last Thursday; bulls couldn't get higher low this Tuesday; all comes down to Friday CPI at 8:30 — creator framing.
- SPY daily: equal highs 774.85; support bounces around 762; flag lows updated from 76750 to 76785; below declining 20 SMA and 8 EMA; above upward-sloping 50 SMA — creator claim.
- SPY hourly: Tuesday opening drive closed gap to Wednesday high but closed weak below key reference points and Wednesday high; Wednesday gap down not fully closed — creator claim.
- SPY market internals: substantial volume outflows; advance-decline not in trend lower zone but not near zero; cumulative builds this week more bearish than bullish — creator claim.
- Sector breadth: all sectors except energy red this week; not rotational market — creator claim.
- SPY market profile: value moving lower; gap-down value not overlapping previous day's low; D-period excess low only bullish item — creator claim.
- QQQ/NDX daily: potential higher low; 'mother of all dogeis' in middle of range; over follow-through day low; closed over 8 EMA; just under flattening 20 SMA — creator claim.
- QQQ levels: midpoint 7135 to about 71250; gap close above 722; break into gap over 724; fill towards 72920; 71675; range lows 707 — creator claim.
- QQQ internals: volume outflows substantial under 400 million; advance-decline wrecked under trend lower zone; cumulative ticks quite bearish; 6000 +/- read, 7500 downside as dogee — creator claim; calls it bearish divergence.
- Creator CPI view: personal belief CPI will come in a little hot; cites elevated PMIs and services pricing PMIs increasing faster — creator claim.
- Creator notes Dell pulling back from 'pie in the sky rally'; Intel, AMD, memory had okay days; questions supportive breadth if heavy hitters pull back — creator claim.
- Creator mentions four additional trade ideas in video but those ideas are not present in provided transcript — source-material limitation.
- Creator references article 'CPI has the deciding vote' at tradebrigade.co/analysis — creator claim. -
Technical Levels & Setups OR Macro Drivers (📌):
- CPI at 8:30 Friday as catalyst; creator says hot/cold matters less than market response.
- Balance rules in force until proven otherwise; non-trending market.
- Bullish look-below-and-fail setup if range low breaks and recovers; target midpoint then opposing end 774.85.
- QQQ double-bottom potential if holds midpoint 7135–71250; then acceptance/fight for gap close over 722 and gap over 724 toward 72920.
- QQQ bear-flag risk under 71675; rotation back to midpoint/range lows.
- Hit-and-run tactics: trim/take profit into resistance, short A-to-B, no expectation of follow-through in balance.
- Need Johnny-on-the-spot rotation in heavy hitters if Intel/AMD/memory/Dell pull back to keep market neutral.
- Sector red except energy, internals bearish divergence. -
Risk/Reward Framework (⚖️):
- Entry: Not established by the available evidence.
- Stop: Not established by the available evidence.
- Targets: SPY/ES opposing end of balance 774.85; QQQ gap fill towards 72920; QQQ range lows 707; QQQ midpoint 7135–71250
- Risk/Reward: Not established by the available evidence.
- Position Size: Not established by the available evidence.
- Probability: Not established by the available evidence. -
Scenario Analysis (🔄):
| Scenario | Probability | Target | Trigger |
|---|---|---|---|
| Bull | Not established by the available evidence. | QQQ gap fill towards 72920; SPY opposing end of balance 774.85 | CPI well received; evidence of changed tone pre-market/day session; QQQ holds 7135–71250 and fights for gap close over 722/724; SPY look-below-and-fail. |
| Base | Not established by the available evidence. | QQQ midpoint 7135–71250; range chop | CPI does not resolve; balance rules remain; price continues ping-pong lows/highs. |
| Bear | Not established by the available evidence. | QQQ range lows 707; SPY support around 762 | CPI poorly received; SPY breaks range low; QQQ drops midpoint/71675 and accepts lower distribution. | -
Risk Factors (⚠️):
- CPI response can invalidate both bull/bear technical reads; creator explicitly says all comes down to Friday and to keep open mind.
- Creator warns not to over-read bearish clues because market may support at range low.
- QQQ relative strength depends on Intel/AMD/memory; if heavy hitters pull back, breadth may not support market.
- Bearish internals divergence may not produce immediate downside in balance.
- Creator's hot CPI belief is personal and not established as probable.
- Provided transcript lacks the four additional trade ideas and exact entries/stops/sizing. -
Actionable Trading/Allocation Plan (🎯):
- Verify CPI release at 8:30 Friday and assess pre-market and day-session response, per creator.
- Monitor SPY/ES levels: 774.85 equal highs, 76785 flag lows, 762 support bounces.
- Monitor QQQ levels: 7135–71250 midpoint, 71675, 722, 724, 72920, 707.
- Track market internals: volume flows, advance-decline, cumulative ticks, sector breadth ex-energy.
- Check creator's referenced article 'CPI has the deciding vote' at tradebrigade.co/analysis.
- Review source video end/description for four additional trade ideas, since they are not in transcript.
- Watch whether QQQ holds midpoint for double-bottom or breaks 71675 for bear flag.
- Watch Dell, Intel, AMD, memory complex for rotation/breadth signals.

-
Creator Horizon Category (⏱️): Short-Term Technical — The creator centers the note on daily/weekly chart levels and rotation into PPI, CPI, and FOMC within the next five trading days.
-
One-Line Thesis (💡): Creator TheChartGuys/Joey claims the S&P 500 and NASDAQ are sideways/rangebound while semis and memory (DRAM, MU, INTC, SMH, SK Highix) try to lead, with PPI/CPI/FOMC within five trading days and bulls needing to hold previous all-time highs and weekly 12 EMA and clear double tops for weekly higher lows.
-
Key Data Points (📊):
- PPI, CPI, and FOMC are all within the next five trading days — creator's macro catalyst framing
- S&P 500 remains sideways; bulls are holding previous all-time high and weekly 12 EMA; bear break would mean monthly consolidation and losing weekly 12 EMA for first time since war lows
- NASDAQ is rangebound with relative strength; bulls need back through double top for weekly higher low; potential weekly uptrend and monthly bull flag in one fell swoop
- DRAM: daily EQ bull break with big-time follow-through; monthly higher low set
- MU: monthly higher low set, though not by a ton
- INTC: monthly higher low trying to form
- NQES ratio: uptrend for quite some time; looking for monthly higher low; if it forms, tech back on the map on semis/memory
- SK Highix: one of the stronger names; monthly higher low very much set
- Russell: weekly head and shoulders; bulls defended support initially, bears brought it back down; break lows would be monthly consolidation follow-through
- SMH QQQ ratio: bears got weekly downtrend confirming, no follow-through into strong bounce; sets stage for monthly higher low in the ratio
- XLF: weekly consolidation; bulls need hold previous all-time high and weekly 12 EMA; monthly lower high trying to form
- XLV: lost the 12 EMA with solid follow-through; weekly bulls trying to hold weekly 12 EMA and previous all-time high; if lost, monthly consolidation shaping up
- IGV: weekly consolidation underway; higher low at 11049; bears need take out weekly 12 EMA for monthly consolidation; daily downtrend as guide
- Mags: not doing a whole ton; weekly moving up without conviction; watch daily uptrend; if lost, weekly higher low support
- XBI: lower lows continue to lack follow-through; scouting weekly higher low; aggressive bulls looking off weekly 12 EMA, patient bulls off two week 12 EMA
- MRNA: massive gap up; trading within it; until mother bar breaks nothing changes; support loss would mean weekly consolidation underway and weekly higher low watch
- NBDA: knocking on all-time high resistance; not much follow-through; head-and-shoulders/rising wedge risk; ratio chart balance area must break upside to regain throne
- Tesla QQQ: long periods of balance then huge breakouts; currently in long balance, not close to breakout structurally; still looking for weekly lower high
- SNDK: trying to get monthly higher low set; potential monthly bull flag if done
- TSM: monthly higher low already done
- AMD: knocking right up on resistance
- Dell: new all-time highs; weekly 12 EMA rider
- Gold: not great or bad; middle of last week's range; break above high for weekly higher low
- Platinum: healthy weekly higher low set; confirmed weekly bull flag; no follow-through at the moment
- Silver: healthy weekly higher low set
- Copper: staying strong; new all-time highs on unadjusted chart this week; adjusted chart still has levels overhead
- Miners: looking really good and healthy; trying for healthy weekly higher low
- GDX GLD ratio: staying strong; trying to push up and over yearly triple top; watch daily 12 EMA; loss would be a red flag -
Technical Levels & Setups OR Macro Drivers (📌):
- Rotation setup: creator says healthy market action would be B team XLF, XLV, IGV, and mags coming down while previous leaders semis and memory resume control
- Red-flag setup: creator says lack of rotation and everything going down would be a very clear red flag
- Semis/memory domino setup: DRAM, MU, INTC, and SK Highix monthly higher lows increase odds NASDAQ, SMH, and NQES ratio follow
- S&P/NASDAQ range resolution setup: bull break sets weekly higher low; bear break starts monthly consolidation
- XLF/XLV bearish clue setup: creator says aggressive bearish case after bullish sign in SMH and DRAM played out like June 4th shift
- IGV setup: weekly consolidation, 11049 higher low, and weekly 12 EMA as bear trigger for deeper monthly consolidation
- NBDA/Tesla setup: long balance areas need ratio-chart upside breaks/new highs for old leaders to regain leadership
- Metals setup: platinum weekly bull flag, silver weekly higher low, copper unadjusted all-time highs, miners strength, and GDX/GLD yearly triple-top push support the group watch -
Risk/Reward Framework (⚖️):
- Entry: Not established by the available evidence.
- Stop: Not established by the available evidence.
- Targets: Not established by the available evidence.
- Risk/Reward: Not established by the available evidence.
- Position Size: Not established by the available evidence.
- Probability: Not established by the available evidence. -
Scenario Analysis (🔄):
| Scenario | Probability | Target | Trigger |
|---|---|---|---|
| Bull | Not established by the available evidence. | Not established by the available evidence. | S&P breaks sideways range bull and sets weekly higher low; NASDAQ clears double top for weekly higher low; SMH QQQ or NQES ratio monthly higher low forms; DRAM/MU/INTC/SK Highix monthly higher lows lead semis and memory |
| Base | Not established by the available evidence. | Not established by the available evidence. | S&P 500 and NASDAQ remain sideways/rangebound; DRAM/MU/INTC monthly higher lows occur without broad index breakout; XLF/XLV/IGV/mags rotation continues; SMH QQQ ratio remains in balance |
| Bear | Not established by the available evidence. | Not established by the available evidence. | S&P range breaks bear, monthly consolidation starts and weekly 12 EMA is lost for first time since war lows; Russell breaks lows for monthly consolidation follow-through; XLV loses weekly 12 EMA/previous ATH; GDX GLD ratio loses daily 12 EMA; no rotation and everything goes down | -
Risk Factors (⚠️):
- PPI, CPI, and FOMC within the next five trading days create event volatility; creator calls it a buffet of volatility incoming
- S&P bear break would lose weekly 12 EMA for the first time since war lows and start monthly consolidation
- If one index breaks down into monthly consolidation, creator says odds increase that others follow
- XLF/XLV bearish setup after bullish SMH/DRAM sign may not repeat the June 4th pattern; creator notes clues do not pay bills and the traded name's levels matter
- IGV monthly consolidation risk if weekly 12 EMA is taken out; 11049 is the cited higher low
- NBDA and Tesla remain in long balance with no close structural breakout; follow-through risk persists
- Metals follow-through is lacking after platinum weekly bull flag, silver weekly higher low, and GDX/GLD push over yearly triple top; loss of GDX/GLD daily 12 EMA is cited as a red flag
- MRNA mother bar remains unresolved; support loss would start weekly consolidation
- XBI lower lows lack follow-through; weekly higher low is not confirmed
- Exact timing of PPI, CPI, and FOMC is not specified in the transcript beyond next five trading days; no entries, stops, targets, ratios, position sizes, or probabilities are stated -
Actionable Trading/Allocation Plan (🎯):
- Track PPI, CPI, and FOMC within the next five trading days and compare outcomes with S&P 500 and NASDAQ range boundaries
- Verify S&P 500 previous all-time high and weekly 12 EMA; monitor bear break as a monthly consolidation signal
- Monitor NASDAQ double-top level for weekly higher low and potential weekly uptrend/monthly bull flag
- Monitor DRAM, MU, INTC, SK Highix monthly higher lows and SMH QQQ ratio for a monthly higher low
- Watch Russell lows for monthly consolidation follow-through; watch XLF previous ATH/weekly 12 EMA; XLV weekly 12 EMA/previous ATH; IGV weekly 12 EMA and 11049 higher low
- Watch NBDA QQQ and Tesla QQQ ratio balance areas for upside break or new highs
- Watch MRNA mother bar/support, gold weekly high, platinum/silver weekly higher lows, copper unadjusted all-time highs, and GDX/GLD daily 12 EMA
- No entry, stop, target, ratio, position size, or probability is established by the evidence; treat as monitoring only
-
Creator Horizon Category (⏱️): Long-Horizon Macro — Creator discusses higher interest rates and fixed-income returns, including lending to the US government at 4.7%, as a macro allocation theme.
-
One-Line Thesis (💡): Creator claims higher interest rates should be celebrated for fixed-income investors because they can now lend to the US government at 4.7% and potentially earn a real after-tax return, despite investor anxiety tied to past bond losses.
-
Key Data Points (📊):
- Higher interest rates are 'awesome' for fixed income investors — creator's headline claim.
- Fixed income investors finally have high fixed income — creator claim.
- Loan money to the US government for 4.7% — literal yield cited by creator.
- Real after-tax return available — creator claim tied to 4.7% US government lending.
- Interest rates rose from 0.5% to 5% and bonds got massacred — creator cites as past PTSD source.
- Individual investors anxiety over higher rates; financial advisers saying opposite should be true — creator framing.
- Now on the other side of that — creator claim.
- No tickers, specific bonds, durations, or tax rates specified in evidence. -
Technical Levels & Setups OR Macro Drivers (📌):
- Higher rates create high fixed income yields for fixed income investors.
- US government yield of 4.7% cited as attractive lending opportunity.
- Real after-tax return cited as benefit if tax assumptions hold.
- Adviser view: higher rates should reduce investor anxiety rather than increase it.
- Past rate shock 0.5% to 5% and bond massacre cited as source of investor PTSD/fear. -
Risk/Reward Framework (⚖️):
- Entry: Not established by the available evidence.
- Stop: Not established by the available evidence.
- Targets: Not established by the available evidence.
- Risk/Reward: Not established by the available evidence.
- Position Size: Not established by the available evidence.
- Probability: Not established by the available evidence. -
Scenario Analysis (🔄):
| Scenario | Probability | Target | Trigger |
|---|---|---|---|
| Bull | Not established by the available evidence. | Not established by the available evidence. | Creator's scenario: rates stay high enough that lending to US government at 4.7% provides a real after-tax return. |
| Base | Not established by the available evidence. | Not established by the available evidence. | Creator says market is now on the other side of the 0.5%-to-5% rate rise and high fixed income is available. |
| Bear | Not established by the available evidence. | Not established by the available evidence. | Repeat or memory of rates rising from 0.5% to 5% causing bonds to be massacred and investor PTSD. | -
Risk Factors (⚠️):
- No specific fixed income instrument, maturity, duration, credit quality, or ticker is identified, limiting verification.
- 4.7% US government yield is not dated or tied to a specific security, so current availability is unverified.
- Real after-tax return claim lacks tax rate, inflation, and fee assumptions.
- Interest-rate risk remains: creator cites 0.5% to 5% rise causing bond massacre, but does not specify whether that risk is fully past.
- Investor anxiety and adviser frustration are framed qualitatively; no survey/data source provided.
- No risk/reward, stop, target, or position sizing is provided. -
Actionable Trading/Allocation Plan (🎯):
- Verify current US government yields, including whether 4.7% is nominal or real and for which maturity.
- Check tax and inflation assumptions required for creator's 'real after-tax return' claim.
- Monitor rate path relative to the cited 0.5% to 5% historical move and bond-market drawdown risk.
- Identify specific fixed-income instruments and durations if evaluating the creator's theme.
- Separate creator's macro claim from personalized suitability; no portfolio action implied by evidence.

-
Creator Horizon Category (⏱️): Other — No specific market horizon is established; the video uses a generic trade-management analogy without time or asset context.
-
One-Line Thesis (💡): Trading is compared to a flight: entry requires substantial setup and energy, but once in the trade with a stop loss set, the trader should minimize decision-making and let the trade play out in 'cruise control.'
-
Key Data Points (📊):
- Analogy: trade setup requires 'a lot of work and energy', including establishing a game plan and selecting the symbol to trade
- Claim: in-trade management is like cruise control — less energy, no constant decisions
- Stop loss is mentioned as pre-set and used to let the trade play out -
Technical Levels & Setups OR Macro Drivers (📌):
- Pre-trade: establish game plan, choose the name/ticker, and manually execute entry
- Post-entry: rely on pre-set stop loss and avoid active decision-making while trade runs -
Risk/Reward Framework (⚖️):
- Entry: Not established by the available evidence.
- Stop: Not established by the available evidence.
- Targets: Not established by the available evidence.
- Risk/Reward: Not established by the available evidence.
- Position Size: Not established by the available evidence.
- Probability: Not established by the available evidence. -
Scenario Analysis (🔄):
| Scenario | Probability | Target | Trigger |
|---|---|---|---|
| Unavailable | Not established by the available evidence. | Not established by the available evidence. | Verify source evidence. | -
Risk Factors (⚠️):
- The evidence is only an analogy; no concrete invalidation triggers, risk parameters, or verification data are provided
- Oversimplification risk: actual trade management may require adaptive decisions despite the 'cruise control' framing -
Actionable Trading/Allocation Plan (🎯):
- Review other TheChartGuys content for concrete trade examples that specify stop-loss placement and entry criteria
- Verify whether the creator's subsequent videos describe exceptions where mid-trade intervention is necessary
-
Creator Horizon Category (⏱️): Short-Term Technical — The evidence supports this horizon classification.
-
One-Line Thesis (💡): Creator expects a gap-down, 'pretty ugly' open pressured by Google and Amazon news, rising oil and rates, with the 10-year bond auction as today's key catalyst while the market remains in a downtrend and awaits Friday's CPI report.
-
Key Data Points (📊):
- Dow futures down about 65 basis points (creator's wording), S&P futures down 37, Nasdaq futures down 49 as of Wednesday morning.
- Oil futures +2.64% to $95.49/barrel; separate headline cites Brent crude topping $100/barrel for first time since July.
- Fed watch shows 62.4% probability of a hike priced in, up from 52% before NFP and 59% after Friday's close; market pricing roughly three hikes by September 2027.
- Friday CPI at 8:30 is the 'big bad inflation report' coming up.
- Google reportedly investing a record $15 billion in AI infrastructure in Finland; Amazon doing a $3 billion UK offering.
- Apple event today: 'Surprise and Shine' iPhone 18 event, new CEO.
- Earnings: Casey's General Store reported after close yesterday; Oracle, Adobe, Restoration Hardware due Thursday after close.
- ES futures on 4-hour chart: pressing overnight lows, lower highs, lower lows, still a downtrend, at lows of the flag. -
Technical Levels & Setups OR Macro Drivers (📌):
- Gap-down open driven by Google and Amazon news pressuring index lower.
- Oil prices continuing to climb while 10-year yield responds, supporting higher rate-hike odds.
- Friday CPI is the big event; creator notes PMI may suggest inflation comes in hotter than expected or at least in line.
- Creator emphasizes market reaction to hot/cold CPI is the only thing that matters, not the number itself. -
Risk/Reward Framework (⚖️):
- Entry: Not established by the available evidence.
- Stop: Not established by the available evidence.
- Targets: Not established by the available evidence.
- Risk/Reward: Not established by the available evidence.
- Position Size: Not established by the available evidence.
- Probability: Not established by the available evidence. -
Scenario Analysis (🔄):
| Scenario | Probability | Target | Trigger |
|---|---|---|---|
| Bull | Not established by the available evidence. | Not established by the available evidence. | Creator references the alternate argument that bond buyers will step in because rates 'probably going to come down at some point,' which could stabilize the market if it plays out at the 10-year auction. |
| Base | Not established by the available evidence. | Not established by the available evidence. | Verify the trigger against the source evidence. |
| Bear | Not established by the available evidence. | Not established by the available evidence. | If oil stays elevated and 10-year yield continues pushing higher, creator notes 'rates up, oil up, futures down' and ES remains in a downtrend with lower lows; Fed hike odds keep stacking higher. | -
Risk Factors (⚠️):
- Friday CPI could move rate-hike odds sharply; creator has no committed market path before that print.
- Oil price spike may be an unverified headline vs the stated oil futures figure; Brent $100 headline conflicts with the displayed $95.49 crude price.
- Event risk: Trump speaking at 9:15 p.m., which could ripple into oil, rates, and equities overnight.
- Creator provides no specific price levels, stops, or targets for any trade.
- No confirmation yet on how much of the 10-year auction will be bought by the Fed or outside buyers. -
Actionable Trading/Allocation Plan (🎯):
- Watch whether Fed watch hike probability moves from the current 62.4% ahead of the Thursday PPI and Friday CPI prints.
- Track oil futures against the stated $95.49 crude level and the contradictory Brent $100 headline.
- Flag the 9:15 p.m. Trump speech as an overnight futures catalyst.
-
Creator Horizon Category (⏱️): Long-Horizon Macro — Creator references a possible financial crisis within a 5 to 15 year window, signaling a multi-year macro focus rather than short-term trading.
-
One-Line Thesis (💡): The creator argues that AI-driven market strength may not be as necessary as popularly thought, highlights Nvidia surpassing Apple in trailing twelve-month operating income, and questions whether a financial crisis in the next 5–15 years is needed to justify the point, while explicitly framing such commentary as prudent rather than a stock call.
-
Key Data Points (📊):
- Financial crisis possibility in next 5, 10, 15 years — long-term concern raised in discussion
- Nvidia operating income over last 12 months higher than Apple — comparative earnings claim
- AI spending said to keep market from falling apart, but creator thinks that narrative is 'actually probably wrong' — skepticism of AI capex support
- Not a stock market call, just being prudent — creator's mitigation of interpretation
- 'We have to get way stupider than this' — comment on perceived market enthusiasm or irrationality
- Root for the boomers — interaction with demographic dynamics -
Technical Levels & Setups OR Macro Drivers (📌):
- AI capital spending and its assumed market-supportive role is a key driver under challenge
- Operating income comparison between Nvidia and Apple frames large-cap tech relative strength
- Discussion of financial crisis timelines (5-15 years) sets a long-term macro setup
- Demographic factor of boomers mentioned as a market or macro driver -
Risk/Reward Framework (⚖️):
- Entry: Not established by the available evidence.
- Stop: Not established by the available evidence.
- Targets: Not established by the available evidence.
- Risk/Reward: Not established by the available evidence.
- Position Size: Not established by the available evidence.
- Probability: Not established by the available evidence. -
Scenario Analysis (🔄):
| Scenario | Probability | Target | Trigger |
|---|---|---|---|
| Bull | Not established by the available evidence. | Not established by the available evidence. | AI spending continues to support markets and no financial crisis materializes within the cited 5-15 year window. |
| Base | Not established by the available evidence. | Not established by the available evidence. | Markets remain dependent on AI capex but the creator's skepticism about that dependency persists, leading to a cautious stance without a definitive collapse. |
| Bear | Not established by the available evidence. | Not established by the available evidence. | A financial crisis occurs in the next 5-15 years, as the creator suggests must happen for the 'point' to be validated. | -
Risk Factors (⚠️):
- Transcript is fragmented and lacks full context; key claims may be misattributed or misinterpreted
- No explicit probability or timing on the financial crisis discussion is provided
- Nvidia vs Apple operating income claim requires verification with external financial statements
- The creator's actual stance on AI-related market support is uncertain—only a rejection of one narrative is captured
- The phrase 'we have to get way stupider than this' is ambiguous without surrounding dialogue -
Actionable Trading/Allocation Plan (🎯):
- Monitor fiscal and monetary conditions over a multi-year horizon for signs of systemic stress that could precede a financial crisis
- Verify Nvidia's and Apple's latest trailing twelve-month operating income figures against official SEC filings
- Track corporate AI capex and its correlation with broad market performance to test the creator's skepticism about the AI-support thesis
- Review demographic outlooks related to the 'boomer' factor and their asset allocation implications

-
Creator Horizon Category (⏱️): Long-Horizon Macro — Discussion centers on multi-year bull market wealth effects, potential future recession/crisis, and structural AI investment crowding out rather than a near-term trade.
-
One-Line Thesis (💡): The Compound hosts argue that 15 years of bull-market wealth creation has made trillion-dollar companies and massive AI spending possible, but human nature makes a future financial crisis/panic inevitable; Trump policies may have delayed it by keeping rates higher, and the market is not yet 'stupid enough' for an AI-driven blowoff.
-
Key Data Points (📊):
- Every company in the top 10 of the S&P 500 (and going out to 11/12) is now a trillion-dollar company; Eli Lilly is a trillion-dollar company; JPMorgan is within spitting distance of $1 trillion.
- Hyperscaler and Nvidia debt issuance as a percentage of Treasury bond issuance is ~70% (chart from Michael Seymble), cited as a possible driver of higher government bond yields.
- WSJ chart shows private construction relative to December 2023: data-center construction is rising while all other private construction is falling off a cliff.
- WSJ chart also shows the US attack on Iran occurred near the actual bottom in rates this year, after which yields took off.
- Duality Research via Kevin Gordon: S&P 500 is up less than 2% since June while forward earnings estimates have jumped 10.7%, implying the market has become roughly 8% cheaper over the summer.
- Apple was the first trillion-dollar company (~2015-2016); at the time it seemed fantastical, but now Broadcom is also 'sniffing a trillion' and it barely draws comment.
- Ray Dalio's article on the 'bond market supply and demand problem' is cited as the source of clients' bond-yield anxiety; hosts plan to address it at Future Proof with Colin. -
Technical Levels & Setups OR Macro Drivers (📌):
- Prolonged equity expansion created a vast pool of capital funding everything from a $13 Chipotle bowl to a $12.5B Lakers purchase to hyperscaler buildouts via debt, equity, SPVs, secondaries, etc.
- Large tech companies' size, profitability, and high margins give them the agency for the AI buildout, but that buildout was only possible after a raging bull market.
- AI spending is crowding out both government bond demand and other private construction; higher rates are negatively impacting commercial, residential, and industrial real estate.
- White House actions (tariffs, war with Iran) kept inflation and rates stickier than a pure tax-cut 'ballroom' approach would have, potentially capping an AI bubble and delaying an ugly outcome.
- Individual investor anxiety over higher rates conflicts with the advisory view that ~4.7% risk-free real after-tax returns should be celebrated.
- Hosts note that without AI spending, the economy may already be in recession; other private construction is being hit from both high rates and AI competition for resources. -
Risk/Reward Framework (⚖️):
- Entry: Not established by the available evidence.
- Stop: Not established by the available evidence.
- Targets: Not established by the available evidence.
- Risk/Reward: Not established by the available evidence.
- Position Size: Not established by the available evidence.
- Probability: Not established by the available evidence. -
Scenario Analysis (🔄):
| Scenario | Probability | Target | Trigger |
|---|---|---|---|
| Bull | Not established by the available evidence. | Not established by the available evidence. | If White House higher-rate policies continue to prevent an AI bubble and earnings growth keeps up, the expansion could persist without a recession this decade; hosts call that 'certainly possible.' |
| Base | Not established by the available evidence. | Not established by the available evidence. | Current state: S&P 500 up <2% since June while forward earnings jumped 10.7%, implying ~8% multiple compression; no recession yet but markets are 'quiet' and pundits repetitive. |
| Bear | Not established by the available evidence. | Not established by the available evidence. | If hyperscaler/Nvidia debt issuance keeps crowding out Treasury issuance and AI spending continues to drain other private construction, higher rates could eventually produce a recession/financial crisis; hosts expect this at some point due to human nature. | -
Risk Factors (⚠️):
- No timeline is given for the predicted recession or financial crisis; statements are qualitative macro/speculative.
- The ~70% debt issuance ratio and WSJ construction charts lack methodology/verification in the transcript.
- Claims about trillion-dollar companies include imprecise language like 'within spitting distance' and 'almost 12.'
- Hosts acknowledge punditry has become repetitive and they may be extrapolating from the current regime.
- No tickers, entry/exit points, or portfolio actions are established in the evidence. -
Actionable Trading/Allocation Plan (🎯):
- Monitor monthly Treasury issuance and hyperscaler/Nvidia corporate debt issuance to test the claimed ~70% crowding-out ratio.
- Track S&P 500 price and forward earnings estimates weekly to see if valuation multiple compression persists.
- Review WSJ/private construction data for data-center versus ex-data-center categories as a recession/expansion signal.
- Follow White House tariff, war, and rate policy changes for their effect on bond yields, mortgage rates, and housing.
- Watch whether broad-market earning upgrades continue to outpace price gains, which would make stocks cheaper without falling.

-
Creator Horizon Category (⏱️): Short-Term Technical — Creator analyzes Bitcoin, ETH, and related instruments on daily/4-hour/30-minute technical levels ahead of near-term CPI and FOMC catalysts.
-
One-Line Thesis (💡): TheChartGuys' Dan argues Bitcoin is at a decision point at daily EMA12, with bulls needing follow-through after a resistance break while a break below 76,000 without follow-through would confirm a bearish megaphone; ETH's tightening range, NASDAQ equilibrium, and CPI/FOMC will determine direction.
-
Key Data Points (📊):
- Bitcoin daily EMA12 is the key level; it held last consolidation into a bull break and is now being retested.
- Market pricing implies ~60% chance of rate hike; CPI on Friday could shift that to upper 60s or down to 40%.
- NASDAQ double-bottomed at daily support, rejected at daily resistance, and has a tightening daily range.
- Bitcoin resistance break had no follow-through; 76,000 is the level to watch for a megaphone confirmation (break with no follow-through).
- Ethereum is at second-tightest range in years; resistance at 2567, break needs follow-through else megaphone watch.
- CRCL showed relative weakness vs IBIT all day; broke Friday's low; still daily uptrend, above 8587 is a daily higher low.
- Altcoins had strong holiday weekend; ZEC lead alt; Sushi moved 50% in one day, drawing attention.
- Bitcoin now reacts significantly to macro data due to mass adoption and ETFs. -
Technical Levels & Setups OR Macro Drivers (📌):
- Bitcoin: daily EMA12 acts as launch pad after sideways consolidation; inverse head and shoulders forming on 30-minute chart.
- Bitcoin: megaphone pattern risk — break of resistance/support without follow-through, then reversal.
- Ethereum: 12-hour equilibrium with higher low, lower high; tightening range implies imminent volatility.
- ZEC: trending move → sideways consolidation → EMA12 kiss → continuation; consecutive inside bars signal tightening.
- CRCL: shift from relative strength to relative weakness vs IBIT shifts probability needle (minor factor).
- NASDAQ: daily equilibrium, CPI/FOMC likely to break tightening range; direction will influence crypto. -
Risk/Reward Framework (⚖️):
- Entry: Not established by the available evidence.
- Stop: Not established by the available evidence.
- Targets: Not established by the available evidence.
- Risk/Reward: Not established by the available evidence.
- Position Size: Not established by the available evidence.
- Probability: Not established by the available evidence. -
Scenario Analysis (🔄):
| Scenario | Probability | Target | Trigger |
|---|---|---|---|
| Bull | Not established by the available evidence. | Not established by the available evidence. | Bitcoin holds daily EMA12 and confirms bull break with follow-through; ETH breaks 2567 with follow-through; inverse H&S on 30-minute confirms, leading toward higher levels. |
| Base | Not established by the available evidence. | Not established by the available evidence. | Continued sideways equilibrium across Bitcoin, ETH, and NASDAQ; daily EMA12 holds but no follow-through; levels like 76,000 Bitcoin and 2567 ETH not broken decisively. |
| Bear | Not established by the available evidence. | Not established by the available evidence. | Bitcoin breaks 76,000 with no follow-through, confirming megaphone; ETH breaks support in tight range; CRCL sustained relative weakness; NASDAQ breaks daily equilibrium to downside. | -
Risk Factors (⚠️):
- CPI on Friday could shift rate-hike probability dramatically, driving volatility in both directions.
- FOMC day after CPI (per video date) likely causes range break in NASDAQ, influencing crypto.
- Megaphone pattern on Bitcoin/ETH could lead to false breaks and stop-outs for both bulls and bears.
- CRCL relative weakness may indicate broader crypto-stock sentiment shift.
- Low-volume holiday weekend moves may not persist into regular trading week. -
Actionable Trading/Allocation Plan (🎯):
- Monitor CPI print on Friday and subsequent shift in market-implied rate-hike probability (60% baseline).
- Watch Bitcoin's 76,000 level for a break without follow-through, which would confirm megaphone downside risk.
- Watch ETH's 2567 breakout for follow-through vs. a top-out/no follow-through scenario.
- Track CRCL vs IBIT relative performance for signs of continued weakness or reversal.
- Observe ZEC's continuation after holding daily EMA12, noting inside-bar tightening as potential precursor to move.
- Follow NASDAQ's daily range break into CPI/FOMC as a leading indicator for crypto direction.

-
Creator Horizon Category (⏱️): Short-Term Technical — The evidence supports this horizon classification.
-
One-Line Thesis (💡): The creator claims that on September 9, markets are being driven by AI, Yen, and Oil events despite looming liquidity and seasonality factors.
-
Key Data Points (📊):
- SEP 9 — date found in video title
- AI, Yen & Oil — stated as market-driving events in title
- looming liquidity and seasonality — stated as backdrop in description
- Option trading is really risky; educational purposes only — disclaimer in description -
Technical Levels & Setups OR Macro Drivers (📌):
- AI-related events — cited by title as a market driver
- Yen currency moves — cited by title as a market driver
- Oil price moves — cited by title as a market driver
- Liquidity concerns — cited as a looming risk factor in description
- Seasonality — cited as a looming factor in description -
Risk/Reward Framework (⚖️):
- Entry: Not established by the available evidence.
- Stop: Not established by the available evidence.
- Targets: Not established by the available evidence.
- Risk/Reward: Not established by the available evidence.
- Position Size: Not established by the available evidence.
- Probability: Not established by the available evidence. -
Scenario Analysis (🔄):
| Scenario | Probability | Target | Trigger |
|---|---|---|---|
| Unavailable | Not established by the available evidence. | Not established by the available evidence. | Verify source evidence. | -
Risk Factors (⚠️):
- No specific price levels, trade setups, or position details are provided in the available evidence; creator explicitly warns against copying trades.
- The creator notes options trading is risky and that viewers are more than likely to lose money if copying trades — a stated risk of acting on stream content. -
Actionable Trading/Allocation Plan (🎯):
- Cross-reference any trading ideas presented in the stream with the creator's educational disclaimers and independent news sources.
-
Creator Horizon Category (⏱️): Other — Event-driven debate on an imminent Apple product reveal (foldable iPhone) with no explicit market forecast or price levels.
-
One-Line Thesis (💡): The video debates whether Apple's upcoming foldable iPhone, set for a reveal tomorrow and priced at over $2,000, will flop or become another hit, with panelists split on nostalgia/analog appeal versus high price and growing screen fatigue.
-
Key Data Points (📊):
- Tomorrow is John Turnus's first big reveal — unnamed product reveal disclosed in the transcript.
- Foldable iPhone reveal expected tomorrow — product-specific claim from transcript.
- Price over $2,000 — explicit price claim for the new device.
- Apple acknowledges technology existed but was 'prohibitively expensive' — quote attribution within transcript.
- Samsung has had foldables forever — comparison claim used by creator panel.
- Panelist Chart: 'people are just it's nauseating to open up your phone and be inundated with Instagram real notifications' — direct quote.
- Panelist Chart: 'just the process of folding it open' is a key product experience — direct quote.
- Panelist Sean: '$2,000 for a phone feels like a lot' — direct quote.
- Panelist Matt: 'people have no governor anymore what they pay for' due to financing — direct quote.
- Panelist Matt references 'the good Apple VR things' and then calls buyers 'Morons' — sarcastic joke.
- No specific Apple ticker or market metric mentioned in transcript. -
Technical Levels & Setups OR Macro Drivers (📌):
- Apple product reveal event anticipated as a catalyst for sentiment on Apple's product pipeline.
- Price point over $2,000 is a dominant discussion driver for perceived consumer acceptance.
- Nostalgia and 'analog boom' are invoked by Chart as a macro-backdrop for wanting a physical folding action.
- Screen-time fatigue and notification overload are cited as reasons consumers may embrace a more deliberate opening process.
- Financing dynamics supposedly reduce consumer price sensitivity — Matt's argument for indifferent purchasing behavior.
- Competitive context is Samsung's existing foldable line, which has normalized the form factor. -
Risk/Reward Framework (⚖️):
- Entry: Not established by the available evidence.
- Stop: Not established by the available evidence.
- Targets: Not established by the available evidence.
- Risk/Reward: Not established by the available evidence.
- Position Size: Not established by the available evidence.
- Probability: Not established by the available evidence. -
Scenario Analysis (🔄):
| Scenario | Probability | Target | Trigger |
|---|---|---|---|
| Bull | Not established by the available evidence. | Not established by the available evidence. | Chart's view that consumers will 'ditch their current iPhones and switch' because the folding process reduces constant screen interface and taps into nostalgia/analog desire. |
| Base | Not established by the available evidence. | Not established by the available evidence. | Matt's fence position: both sides are plausible; financing removes the 'governor' on what people will pay, limiting the relevance of high price. |
| Bear | Not established by the available evidence. | Not established by the available evidence. | Sean's view that a $2,000 phone is high while people are trying to be on their phones less; the added screen would likely only serve movie/TV watchers, a narrow segment. | -
Risk Factors (⚠️):
- Product reveal date and name are based on the transcript's internal claim (John Turnus, tomorrow); actual confirmation is missing.
- The $2,000+ price point could deter consumers, as Sean suggests, especially given widespread screen fatigue.
- Foldable technology is not new (Samsung's presence) so Apple needs to differentiate beyond a form factor.
- Potential overreliance on financing-driven demand may not sustain if credit conditions tighten.
- No concrete sales forecast, supply chain data, or historical comparison for foldable adoption is provided in the evidence. -
Actionable Trading/Allocation Plan (🎯):
- Monitor the official Apple reveal event (referenced as tomorrow) for product details, exact pricing, and availability.
- Verify whether the 'John Turnus' name is a real person or a mis-transcription; cross-check reliable event calendars.
- Track competitor Samsung's foldable pricing and sales trajectory as a benchmark for Apple's expected adoption.
- Review historical consumer response to high-priced Apple devices (e.g., Apple Vision Pro) for context on the 'morons' quip.
- Watch for pre-order data and third-party surveys on consumer willingness to pay over $2,000 for a foldable phone.

-
Creator Horizon Category (⏱️): Long-Horizon Macro / Structural — The evidence describes a persistent architectural weakness in AI data privacy rather than a short-term event or tradeable setup.
-
One-Line Thesis (💡): Creator claims zero-data-retention (ZDR) policies in AI cannot guarantee privacy because leak vectors are non-obvious and even model companies may possess unknown trapdoors, so an independent third-party layer is necessary to manage exposure.
-
Key Data Points (📊):
- ZDR switch — zero data retention — 'magic term' that cannot guarantee safety.
- Model companies with ZDR policies 'are probably trying their best' but 'may still have trapdoors that they don't even know about'.
- Independent third-party layer recommended to interface with models because 'there are trapdoors everywhere'.
- Leak vectors in AI are described as 'non-obvious' and 'lurking'. -
Technical Levels & Setups OR Macro Drivers (📌):
- Non-obvious data leak vectors in AI make privacy 'fragile' and 'brittle'.
- Even best-effort ZDR policies are insufficient because unknown trapdoors can be discovered by third parties.
- The need for an independent third-party interface layer arises from the inability to guarantee data retention. -
Risk/Reward Framework (⚖️):
- Entry: Not established by the available evidence.
- Stop: Not established by the available evidence.
- Targets: Not established by the available evidence.
- Risk/Reward: Not established by the available evidence.
- Position Size: Not established by the available evidence.
- Probability: Not established by the available evidence. -
Scenario Analysis (🔄):
| Scenario | Probability | Target | Trigger |
|---|---|---|---|
| Bull | Not established by the available evidence. | Not established by the available evidence. | Adoption and demonstrated effectiveness of an independent third-party layer that manages exposure across AI models. |
| Base | Not established by the available evidence. | Not established by the available evidence. | Model companies continue to offer ZDR policies while unknown trapdoors remain undetected or unacknowledged. |
| Bear | Not established by the available evidence. | Not established by the available evidence. | A non-obvious data leak vector is exploited or a trapdoor is discovered despite ZDR policies, confirming that current guarantees are insufficient. | -
Risk Factors (⚠️):
- No specific leak vector, trapdoor, or model company is named; the claim is not yet falsifiable.
- The assertion that ZDR policies cannot be guaranteed is unverified and may be contradicted by future technical controls.
- The recommendation for a third-party layer is untested; that layer itself could introduce new leak paths. -
Actionable Trading/Allocation Plan (🎯):
- Monitor industry and regulatory discussions for any disclosed AI data breach incident linked to ZDR policies.
- Track announcements of independent third-party AI privacy or data-retention-layer products/services.
- Verify whether any specific AI model company publicly acknowledges undiscovered trapdoors or modifies ZDR guarantees.

-
Creator Horizon Category (⏱️): Long-Horizon Macro / Structural — Creator analyzes systematic media and PR dynamics around AI companies' pre-IPO earned media rather than a specific tradeable setup.
-
One-Line Thesis (💡): Creator claims AI companies and media are jointly exploiting performative 'sentient AI' framing to generate earned media and ratchet retail interest ahead of OpenAI's IPO, priming demand for IPO shares.
-
Key Data Points (📊):
- OpenAI IPO — 'earned media' before IPO priming share purchases
- Sentient AI framing — described as 'performative' and 'farcical'
- Dwarakesh — writing cited as attention-seeking and providing media fuel
- National press — story 'gone everywhere' after Dwarakesh's contribution -
Technical Levels & Setups OR Macro Drivers (📌):
- Performative labeling of AI as sentient replacing classic language ('bugs', 'audit log')
- Media's shift from truth-seeking to entertainment/ratings-seeking
- Anthropic and OpenAI cooperating in a 'dance' with media
- Earned media as free advertising before OpenAI's IPO -
Risk/Reward Framework (⚖️):
- Entry: Not established by the available evidence.
- Stop: Not established by the available evidence.
- Targets: Not established by the available evidence.
- Risk/Reward: Not established by the available evidence.
- Position Size: Not established by the available evidence.
- Probability: Not established by the available evidence. -
Scenario Analysis (🔄):
| Scenario | Probability | Target | Trigger |
|---|---|---|---|
| Unavailable | Not established by the available evidence. | Not established by the available evidence. | Verify source evidence. | -
Risk Factors (⚠️):
- No quantified evidence of IPO timing, valuation, or actual media impact on share pricing
- Creator's critique is qualitative and attribution of intent to Dwarakesh is subjective
- Missing verification of whether 'earned media' will translate into durable retail demand
- Potential for media backlash if sentience framing is exposed as performative -
Actionable Trading/Allocation Plan (🎯):
- Monitor OpenAI IPO filings and prospectus for disclosures referencing media coverage or retail interest
- Track frequency of 'sentient AI' versus 'bug/audit' language in national press articles
- Verify Dwarakesh's original writing and its reach across media outlets
- Compare coverage patterns of Anthropic and OpenAI prior to known capital events
-
Creator Horizon Category (⏱️): Short-Term Technical — The channel describes the video as pre-market technical analysis for futures and options traders, indicating a short-term trading horizon.
-
One-Line Thesis (💡): The video's headline claims that broad markets are weak while memory stocks show relative strength, and questions whether memory stocks can maintain that strength.
-
Key Data Points (📊):
- "Everything Is WEAK But Memory Stocks" – headline claim of relative weakness in broad market vs. strength in memory sector.
- Pre market technical analysis for futures traders and options traders – channel's stated purpose of the live broadcast.
- Live every trading day at 8:00 AM EST – schedule information. -
Technical Levels & Setups OR Macro Drivers (📌):
- Not established by the available evidence. -
Risk/Reward Framework (⚖️):
- Entry: Not established by the available evidence.
- Stop: Not established by the available evidence.
- Targets: Not established by the available evidence.
- Risk/Reward: Not established by the available evidence.
- Position Size: Not established by the available evidence.
- Probability: Not established by the available evidence. -
Scenario Analysis (🔄):
| Scenario | Probability | Target | Trigger |
|---|---|---|---|
| Unavailable | Not established by the available evidence. | Not established by the available evidence. | Verify source evidence. | -
Risk Factors (⚠️):
- Video content is not provided in evidence; all claims are unverified.
- Headline claim may be misleading without specific tickers or data. -
Actionable Trading/Allocation Plan (🎯):
- Review the full video to obtain specific tickers, levels, and claims regarding memory stock strength.
- Cross-reference any claims from the video with independent market data for verification.
-
Creator Horizon Category (⏱️): Other — Evidence covers behavioral habit-formation techniques, not market or investment horizons.
-
One-Line Thesis (💡): To build lasting habits, the creator recommends pairing an obvious environmental cue with the 2-minute rule—scaling down the target action until it takes two minutes or less—because a habit must be established before it can be improved.
-
Key Data Points (📊):
- 2-minute rule — scale any intended habit down to something taking 2 minutes or less
- 45-minute yoga workout scaled to 'roll out the yoga mat and do the first pose'
- Mitch (from Atomic Habits) lost over 100 lb, first 6 weeks limited gym visits to 5 minutes max
- Leo Babauta quote — make it so easy you can't say no
- Ed Latimore quote — 'The heaviest weight at the gym is the front door'
- No financial tickers, price levels, valuations, dates, or portfolio metrics appear in the evidence -
Technical Levels & Setups OR Macro Drivers (📌):
- Make habit cues obvious (e.g., place yoga mat in corner of living room) — creator's example
- Make habit execution easy via the 2-minute rule to reduce intimidation
- Master the art of showing up before optimizing effort (Mitch's 5-minute gym rule) -
Risk/Reward Framework (⚖️):
- Entry: Not established by the available evidence.
- Stop: Not established by the available evidence.
- Targets: Not established by the available evidence.
- Risk/Reward: Not established by the available evidence.
- Position Size: Not established by the available evidence.
- Probability: Not established by the available evidence. -
Scenario Analysis (🔄):
| Scenario | Probability | Target | Trigger |
|---|---|---|---|
| Bull | Not established by the available evidence. | Not established by the available evidence. | If the 2-minute rule is consistently applied and habit identity formation succeeds, the user 'increases the odds' of performing the habit, per creator claim. |
| Base | Not established by the available evidence. | Not established by the available evidence. | If the user initially resists the trick but follows it anyway, they may still 'get over that hump and get started' — creator's described typical response. |
| Bear | Not established by the available evidence. | Not established by the available evidence. | If a user rejects the scaling trick as a 'mental trick' and refuses to engage, no habit formation occurs — no empirical probability or metric provided. | -
Risk Factors (⚠️):
- No financial or trading risk applies — evidence is purely behavioral advice.
- Missing verification: Creator provides anecdotal stories (Mitch, Atomic Habits) but no controlled or peer-reviewed data on habit adherence rates.
- Potential pushback risk: Users may perceive the 2-minute rule as insufficiently ambitious, as the creator acknowledges. -
Actionable Trading/Allocation Plan (🎯):
- To verify the creator's claim, track daily adherence to a 2-minute version of a habit for at least two weeks and compare with baseline.
- Monitor whether starting with the 2-minute rule subsequently leads to longer sessions (e.g., the 'next step follows' claim).
- Confirm source material: The creator references Leo Babauta and Ed Latimore quotes, and the story of Mitch from Atomic Habits, for independent reading.

-
Creator Horizon Category (⏱️): Short-Term Technical — Video title announces a one-week liquidity window ending around SEP 8 and description ties positioning to the imminent CPI print.
-
One-Line Thesis (💡): Creator asserts the market is entering the 'Last Week of Liquidity' as of September 8, linking 'war drama' and the upcoming CPI print to a 'sell bonds no matter what' stance.
-
Key Data Points (📊):
- Last Week of Liquidity — video title claims a specific time-bound market condition
- SEP 8 — stream date and reference point for the liquidity window
- Sell bonds no matter what? — creator's description-level rhetorical stance on bond positioning
- War drama + Waiting for CPI — macro conditions cited by creator as driving the bond-sell narrative
- CPI — awaited catalyst mentioned in description
- Two long-term platforms (ThinkOrSwim, Fidelity) and one active platform (Etrade pro) — creator's stated execution setup -
Technical Levels & Setups OR Macro Drivers (📌):
- Creator implies CPI is a key event for bond markets, with a pre-commitment to selling bonds regardless of outcome
- Geopolitical 'war drama' is cited as a secondary macro pressure alongside CPI wait
- Title suggests a defined liquidity phase expiring after the current week (SEP 8-based)
- Creator states trading on Etrade Pro for active trades and ThinkOrSwim/Fidelity for long-term holdings -
Risk/Reward Framework (⚖️):
- Entry: Not established by the available evidence.
- Stop: Not established by the available evidence.
- Targets: Not established by the available evidence.
- Risk/Reward: Not established by the available evidence.
- Position Size: Not established by the available evidence.
- Probability: Not established by the available evidence. -
Scenario Analysis (🔄):
| Scenario | Probability | Target | Trigger |
|---|---|---|---|
| Bear | Not established by the available evidence. | Not established by the available evidence. | Creator's stated 'War drama + Waiting for CPI = Sell bonds no matter what?' | -
Risk Factors (⚠️):
- No specific tickers, levels, or trade parameters appear in the evidence — only a macro bias
- The 'sell bonds no matter what' line is presented as a question, not a confirmed trade setup
- Video is live-stream educational content with explicit disclaimer against copying trades
- No verification of actual bond positions or market reaction expectations beyond the title/description -
Actionable Trading/Allocation Plan (🎯):
- Monitor CPI release date and actual print against creator's pre-stated bond-selling bias
- Verify whether the 'last week of liquidity' claim corresponds to observable market volume/liquidity conditions
- Cross-reference creator's subsequent video content for any concrete trade setups or levels

-
Creator Horizon Category (⏱️): Long-Horizon Macro — The episode addresses macro-level allocation and life-stage investing questions (debt crisis, asset classes, cash management, spending) with no intraday or technical focus.
-
One-Line Thesis (💡): Ask The Compound 239, hosted by Ben Carlson and Duncan Hill, covers audience questions on navigating a government debt crisis, choosing between stocks, bonds and cash, international stock allocation, cash parking, middle-aged investing, and spending strategies, but the metadata-only evidence provides no specific market views, tickers, or figures.
-
Key Data Points (📊):
- Government debt crisis how-to-play segment — timestamp 02:51
- Stocks, bonds or cash allocation segment — timestamp 06:55
- International stock allocation segment — timestamp 09:25
- Cash parking options segment — timestamp 16:10
- Middle-aged investing segment — timestamp 20:10
- Spending strategies segment — timestamp 27:45 -
Technical Levels & Setups OR Macro Drivers (📌):
- Not established by the available evidence. -
Risk/Reward Framework (⚖️):
- Entry: Not established by the available evidence.
- Stop: Not established by the available evidence.
- Targets: Not established by the available evidence.
- Risk/Reward: Not established by the available evidence.
- Position Size: Not established by the available evidence.
- Probability: Not established by the available evidence. -
Scenario Analysis (🔄):
| Scenario | Probability | Target | Trigger |
|---|---|---|---|
| Unavailable | Not established by the available evidence. | Not established by the available evidence. | Verify source evidence. | -
Risk Factors (⚠️):
- Missing verification: no transcript or detailed show notes, so any claimed allocations, strategies, or figures cannot be verified from the metadata
- No specific invalidation risks or market levels provided in the available description -
Actionable Trading/Allocation Plan (🎯):
- Review the video at the listed timestamps to extract detailed claims per segment
- Check the episode's podcast page or other sources for transcripts to verify any numerical claims or investment recommendations
-
Creator Horizon Category (⏱️): Other — Evidence contains only metadata and sponsorship details; no investment horizon is stated or derivable.
-
One-Line Thesis (💡): The video is a 'What Are Your Thoughts' episode with Josh Brown and Michael Batnick, but the available metadata does not disclose any market discussion, thesis, or investment catalyst.
-
Key Data Points (📊):
- DBMF promoted as world's largest managed futures ETF with $4.16 billion AUM as of July 31, 2026 — sponsor claim in description.
- Hosts are employees of Ritholtz Wealth Management and may hold positions in discussed securities — standard disclosure.
- Podcast content includes segments: 'Make The Case' and 'Mystery Chart' per timestamps — no details provided. -
Technical Levels & Setups OR Macro Drivers (📌):
- Not established by the available evidence. -
Risk/Reward Framework (⚖️):
- Entry: Not established by the available evidence.
- Stop: Not established by the available evidence.
- Targets: Not established by the available evidence.
- Risk/Reward: Not established by the available evidence.
- Position Size: Not established by the available evidence.
- Probability: Not established by the available evidence. -
Scenario Analysis (🔄):
| Scenario | Probability | Target | Trigger |
|---|---|---|---|
| Unavailable | Not established by the available evidence. | Not established by the available evidence. | Verify source evidence. | -
Risk Factors (⚠️):
- Video content entirely unverified from metadata — no actual claims to evaluate.
- Sponsor assertions regarding DBMF's size and ranking are unsubstantiated by independent sources in the evidence.
- Disclosure notes hosts may hold positions, but no specific positions are identified. -
Actionable Trading/Allocation Plan (🎯):
- Obtain full video transcript or show notes to extract actual discussion points, tickers, and levels.
- Verify DBMF AUM and 'world's largest' ranking via fund sponsor or regulatory documents independent of this video.
- Monitor October 2026 for any subsequent comments or corrections from The Compound regarding episode content.

-
Creator Horizon Category (⏱️): Long-Horizon Macro — Video headline and topics center on recession probability for the remainder of the 2020s and structural macro forces like AI debt and yields.
-
One-Line Thesis (💡): The hosts discuss whether the U.S. can avoid another recession for the rest of the 2020s, weighing an AI-driven debt binge as a key risk against positive signals like rising yields and ongoing M&A activity.
-
Key Data Points (📊):
- No recessions for the rest of the 2020s — hypothesis raised in video title
- AI debt binge — discussion topic flagged as potential macro risk
- Dead cat bounce in software stocks — observation claimed
- Bull market M&A deals — activity noted as ongoing
- Rising yields — discussed as a good thing
- No one cares about dividends anymore — sentiment claim
- Gen Z will be buying houses — demographic/property claim
- Kevin Warsh thoughts on the economy — commentary segment
- AI civilizations — speculative topic in episode
- Episode 480 of Animal Spirits with hosts Michael Batnick and Ben Carlson -
Technical Levels & Setups OR Macro Drivers (📌):
- AI debt binge as a potential destabilizer to the growth cycle
- Rising yields interpreted as a sign of economic strength
- Software stocks showing only a 'dead cat bounce' rather than sustained recovery
- Bull market M&A activity as evidence of corporate confidence
- Demographic shift with Gen Z entering homeownership -
Risk/Reward Framework (⚖️):
- Entry: Not established by the available evidence.
- Stop: Not established by the available evidence.
- Targets: Not established by the available evidence.
- Risk/Reward: Not established by the available evidence.
- Position Size: Not established by the available evidence.
- Probability: Not established by the available evidence. -
Scenario Analysis (🔄):
| Scenario | Probability | Target | Trigger |
|---|---|---|---|
| Bull | Not established by the available evidence. | Not established by the available evidence. | Verify the trigger against the source evidence. |
| Bear | Not established by the available evidence. | Not established by the available evidence. | Discussion topic 'AI debt binge' suggests a potential credit or growth shock that could trigger a recession. |
| Base | Not established by the available evidence. | Not established by the available evidence. | Description lists 'dead cat bounce in software stocks' and 'bull market M&A deals', implying a muddle-through market with sector rotation. | -
Risk Factors (⚠️):
- AI debt binge could lead to credit stress or a financial accident
- Rising yields may eventually become restrictive for equity valuations
- Software sector weakness persists beyond a temporary bounce
- Recession risk remains unresolved despite the no-recession headline
- Dividend-focused investors underperforming amid a growth-driven market -
Actionable Trading/Allocation Plan (🎯):
- Monitor macro data releases for recession signals (e.g., GDP, employment, yield curve)
- Track corporate debt issuance, especially in AI-related sectors, for signs of overleveraging
- Review software sector fundamentals to distinguish a bounce from a durable recovery
- Follow M&A announcements as a barometer of corporate confidence
- Listen to full episode for detailed arguments and host opinions

-
Creator Horizon Category (⏱️): Other — Evidence describes a behavioral science technique, not a financial market or asset horizon.
-
One-Line Thesis (💡): Katy Milkman's temptation bundling pairs an enjoyable activity with a needed habit to make the required behavior immediately rewarding, as shown by her own use of audiobooks at the gym.
-
Key Data Points (📊):
- Temptation bundling — pairing something you love with something you should do, per Katy Milkman.
- Katy Milkman — James G. Dinan Professor at Wharton, author of How to Change.
- She only let herself enjoy page-turner audiobooks at the gym, and soon couldn't wait to work out. -
Technical Levels & Setups OR Macro Drivers (📌):
- Immediate reward coupling: giving oneself access to an appealing treat only during the performance of a necessary task.
- Habit formation through association of exercise with anticipated audiobook pleasure. -
Risk/Reward Framework (⚖️):
- Entry: Not established by the available evidence.
- Stop: Not established by the available evidence.
- Targets: Not established by the available evidence.
- Risk/Reward: Not established by the available evidence.
- Position Size: Not established by the available evidence.
- Probability: Not established by the available evidence. -
Scenario Analysis (🔄):
| Scenario | Probability | Target | Trigger |
|---|---|---|---|
| Unavailable | Not established by the available evidence. | Not established by the available evidence. | Verify source evidence. | -
Risk Factors (⚠️):
- The claim is based on a single anecdote; no controlled experimental data is cited.
- Effectiveness may vary by individual and context; not all pleasurable pairings sustain motivation long-term. -
Actionable Trading/Allocation Plan (🎯):
- Verify the evidence base for temptation bundling in Katy Milkman's book How to Change.
- Monitor personal adherence and reward strength when applying temptation bundling to a target habit.

-
Creator Horizon Category (⏱️): Long-Horizon Macro / Structural — Title references Trump's instincts on AI and data centers, indicating a broader structural policy/industry discussion rather than a short-term trade.
-
One-Line Thesis (💡): David Sacks, on the All-In Podcast, asserts that President Trump's instincts regarding AI and data centers are correct, according to the video title.
-
Key Data Points (📊):
- Trump's instincts on AI and data centers are right — claim attributed to David Sacks in the video title -
Technical Levels & Setups OR Macro Drivers (📌):
- Not established by the available evidence. -
Risk/Reward Framework (⚖️):
- Entry: Not established by the available evidence.
- Stop: Not established by the available evidence.
- Targets: Not established by the available evidence.
- Risk/Reward: Not established by the available evidence.
- Position Size: Not established by the available evidence.
- Probability: Not established by the available evidence. -
Scenario Analysis (🔄):
| Scenario | Probability | Target | Trigger |
|---|---|---|---|
| Unavailable | Not established by the available evidence. | Not established by the available evidence. | Verify source evidence. | -
Risk Factors (⚠️):
- Metadata-only evidence provides no specifics; claims may lack verifiable details.
- Missing full episode content prevents independent validation of Sacks' arguments. -
Actionable Trading/Allocation Plan (🎯):
- Review the full All-In Podcast episode to extract specific AI/data center claims and any policy or market implications.
- Cross-reference with public statements or policy proposals from Trump on AI and data centers to assess alignment.

-
Creator Horizon Category (⏱️): Short-Term Technical — The creator discusses anticipating near-term range breaks driven by volume and volatility spikes.
-
One-Line Thesis (💡): TheChartGuys claims a trading edge in recognizing tightening ranges (higher lows and lower highs forming an 'equilibrium') and anticipates that a volume/volatility spike will soon break the range, directing trader focus to high-opportunity moments.
-
Key Data Points (📊):
- Equilibrium = series of higher lows and lower highs tightening into a range
- Break of equilibrium signals 'spike in volume and volatility' in the near term
- Opportunity to trade is 'limited' while the range tightens
- Break yields 'more significant opportunity'
- Focus management is critical due to 'opportunity cost' -
Technical Levels & Setups OR Macro Drivers (📌):
- Tightening range (equilibrium) as a precursor to a volatility expansion
- Higher lows and lower highs compressing price action
- Anticipated volume/volatility spike following the break -
Risk/Reward Framework (⚖️):
- Entry: Not established by the available evidence.
- Stop: Not established by the available evidence.
- Targets: Not established by the available evidence.
- Risk/Reward: Not established by the available evidence.
- Position Size: Not established by the available evidence.
- Probability: Not established by the available evidence. -
Scenario Analysis (🔄):
| Scenario | Probability | Target | Trigger |
|---|---|---|---|
| Unavailable | Not established by the available evidence. | Not established by the available evidence. | Verify source evidence. | -
Risk Factors (⚠️):
- No specific instrument, direction, timeframe, or price level is mentioned in the evidence.
- Break direction (up or down) is not specified, so trades depend on additional confirmation.
- Verification of the claimed edge is absent; no backtested data or success rate provided. -
Actionable Trading/Allocation Plan (🎯):
- Monitor selected markets for patterns of higher lows and lower highs converging into an equilibrium range.
- Prepare to shift focus when tightening is detected, anticipating a near-term volume/volatility break.
- Require a confirmed break (in either direction) with increased volume before treating opportunity as 'significant'.

-
Creator Horizon Category (⏱️): Long-Horizon Macro / Structural — Creator emphasizes AI agentic workflows and crypto tokenization as a structural disruption, with near-term market views secondary to this long-horizon theme.
-
One-Line Thesis (💡): AI agents and crypto-based tokenized portfolios constitute the most important investment opportunity, while bond-fear narratives are overblown and equities remain supported by strong earnings revisions and profit margins.
-
Key Data Points (📊):
- 20+ year Treasury total return −3% YTD, versus −32% in 2022
- Nikkei up 52% year-over-year (after Zero Hedge scare on May 20)
- SMH (semiconductors) up 88% Y/Y
- MSCI World up 16% Y/Y, MSCI EM up 30% Y/Y
- MSCI World Bank Index up 29% Y/Y
- Manufacturing PMI at 55
- Oil near $86, 6th contract forward up 22% Y/Y
- Junk spreads at tightest level ever; triple C spreads widening
- Treasury Secretary Bessent expects Japan to act to boost yen
- Nvidia approaching new all-time highs
- 20+ year bond return −3% YTD vs −32% in 2022 -
Technical Levels & Setups OR Macro Drivers (📌):
- AI agent adoption accelerating; creator says time for learning AI workflows is gone
- Tokenization via AI agents can build diversified portfolios with strong Sharpe ratio
- Strong earnings revisions and profit margins globally argue for long equities
- Bond fears contradicted by low bond volatility (BVAL low), tight junk spreads, asleep inflation swaps
- US/Japan government coordination to suppress yields (Bessent comment)
- Nvidia breakout as leading indicator; bearish semiconductor calls are 'bubble bias'
- S&P correction viewed as consolidation above rising 200-day moving averages
- Recent tech momentum lows blamed on deleveraging, not fundamentals -
Risk/Reward Framework (⚖️):
- Entry: Not established by the available evidence.
- Stop: Not established by the available evidence.
- Targets: Not established by the available evidence.
- Risk/Reward: Not established by the available evidence.
- Position Size: Not established by the available evidence.
- Probability: Not established by the available evidence. -
Scenario Analysis (🔄):
| Scenario | Probability | Target | Trigger |
|---|---|---|---|
| Bull | Not established by the available evidence. | Not established by the available evidence. | Verify the trigger against the source evidence. |
| Base | Not established by the available evidence. | Not established by the available evidence. | Equities remain range-bound (S&P basically unchanged June–September) while consolidation continues and 200-day moving average catches up; no new highs until after midterms. |
| Bear | Not established by the available evidence. | Not established by the available evidence. | Verify the trigger against the source evidence. | -
Risk Factors (⚠️):
- No explicit price levels, stops, or position sizes are offered—claims are qualitative and chart-dependent, limiting verifiability.
- AI agent and tokenization opportunity is asserted without objective evidence of adoption rates or portfolio performance.
- JGB yield breakout and Japan coordination are presented as bullish but depend on government actions that are not guaranteed.
- Semiconductor bullishness hinges on Nvidia breaking to new highs; if Nvidia fails at resistance, the AI trade setup invalidates. -
Actionable Trading/Allocation Plan (🎯):
- Track Nvidia price for a confirmed new all-time-high close.
- Verify Bessent's coordination statements on Japan and any yen-boosting actions from the Japanese government.

-
Creator Horizon Category (⏱️): Short-Term Technical — The video analyzes intraday to weekly SPY price action and targets ahead of the upcoming CPI report on Friday.
-
One-Line Thesis (💡): Trade Brigade claims the memory trade (Micron, SanDisk) revived semiconductors while SPY's failed breakdown suggests upward bias, with a monthly measured move target near $850, but Friday CPI and key support levels will determine near-term direction.
-
Key Data Points (📊):
- Memory trade led by Micron and SanDisk on Friday — even after hot non-farm payroll data pressured markets lower
- SPY monthly measured move forecast from bull flag breakout: ~$850
- NASDAQ still within 'junk drawer' — but semiconductors waking back up
- CPI on Friday as a potential catalyst -
Technical Levels & Setups OR Macro Drivers (📌):
- Failed breakdown on SPY weekly: sellers didn't follow through below previous week's low; bar closed higher, leaning bullish
- Hourly inverted head and shoulders triggered upward via gap and go on Thursday
- Monthly bar closed in upper third, above breakout level, with higher high and higher low
- Semiconductor strength from Micron and SanDisk as sector leadership -
Risk/Reward Framework (⚖️):
- Entry: Not established by the available evidence.
- Stop: Not established by the available evidence.
- Targets: Not established by the available evidence.
- Risk/Reward: Not established by the available evidence.
- Position Size: Not established by the available evidence.
- Probability: Not established by the available evidence. -
Scenario Analysis (🔄):
| Scenario | Probability | Target | Trigger |
|---|---|---|---|
| Bull | Not established by the available evidence. | Not established by the available evidence. | Verify the trigger against the source evidence. |
| Base | Not established by the available evidence. | Not established by the available evidence. | Verify the trigger against the source evidence. |
| Bear | Not established by the available evidence. | Not established by the available evidence. | Verify the trigger against the source evidence. | -
Risk Factors (⚠️):
- A hot CPI print on Friday could pressure the market lower and invalidate the bullish setup. -
Actionable Trading/Allocation Plan (🎯):
- Watch the CPI report on Friday for potential impact on interest-rate sentiment and index direction.
- Track semiconductor leadership (Micron, SanDisk) as a confirming signal for the memory trade continuation.

-
Creator Horizon Category (⏱️): Short-Term Technical — Creator focuses on balance vs trending markets and an upcoming FOMC event as a near-term catalyst to break tightening ranges.
-
One-Line Thesis (💡): The creator claims markets are currently in tightening/balancing ranges and that the FOMC is positioned to break these ranges, with the most likely scenarios still taking shape.
-
Key Data Points (📊):
- Balancing Markets Tighten — title claim describing current market state
- FOMC setting up to break tightening ranges — claim that the FOMC is a catalyst for range resolution
- Most likely scenarios continue to shape up — claim that scenario probabilities are still forming -
Technical Levels & Setups OR Macro Drivers (📌):
- FOMC meeting as potential catalyst for breaking tightening ranges
- Balance vs trending market taxonomy used to classify current price action -
Risk/Reward Framework (⚖️):
- Entry: Not established by the available evidence.
- Stop: Not established by the available evidence.
- Targets: Not established by the available evidence.
- Risk/Reward: Not established by the available evidence.
- Position Size: Not established by the available evidence.
- Probability: Not established by the available evidence. -
Scenario Analysis (🔄):
| Scenario | Probability | Target | Trigger |
|---|---|---|---|
| Unavailable | Not established by the available evidence. | Not established by the available evidence. | Verify source evidence. | -
Risk Factors (⚠️):
- Metadata provides no specific tickers, market indices, or price levels to verify the range claims.
- Direction of the FOMC break (up or down) is unspecified, making bullish/bearish outcomes indeterminate.
- Balance vs trending definition is subjective and not operationalized in the available evidence.
- No probabilities or timeframes are attached to the 'most likely scenarios' claim. -
Actionable Trading/Allocation Plan (🎯):
- Watch the full video or obtain transcript to identify which specific markets and tightening ranges are referenced.
- Monitor FOMC meeting announcements and subsequent price action for range break confirmation.
- Cross-reference the creator's balance/trending framework with observable chart structures in relevant indices or commodities.
-
Creator Horizon Category (⏱️): Long-Horizon Macro / Structural — Video spans AI model releases, school AI bans, and a US-Venezuela oil deal, implying structural shifts in technology, policy, and energy markets.
-
One-Line Thesis (💡): All-In hosts claim OpenAI's GPT-6 Astra may have reached AGI (Brockman says AGI per WaPo), while NYC bans AI in K-8 schools and a US-Venezuela oil deal emerges, amid 'Tech Euphoria 2.0' and AI-brained influencer conflicts.
-
Key Data Points (📊):
- GPT-6 Astra release — OpenAI announced; Greg Brockman quoted by WaPo calling it AGI.
- Sam Altman interviewed by Axios — headline 'sobering siren'.
- NYC public schools banning AI use in middle school year — ABC7 report.
- US-Venezuela oil deal — discussed without specific terms in video description.
- Dwarkesh's Hugging Face hack article sparks Bernie Sanders AI ban discussion.
- Polymarket event: Which company has best AI model end of 2026 — referenced.
- Polymarket event: US enacts AI safety bill before 2027 — referenced. -
Technical Levels & Setups OR Macro Drivers (📌):
- OpenAI GPT-6 Astra release and AGI claim is the central AI sentiment driver.
- NYC school AI ban K-8 represents a regulatory/education adoption headwind.
- US-Venezuela oil deal could alter crude supply dynamics and geopolitical alignment.
- All-In Summit scheduled one week out, potential for policy and technology announcements.
- Dwarkesh/Hugging Face article fueling political reaction (Bernie Sanders AI ban) — a policy catalyst. -
Risk/Reward Framework (⚖️):
- Entry: Not established by the available evidence.
- Stop: Not established by the available evidence.
- Targets: Not established by the available evidence.
- Risk/Reward: Not established by the available evidence.
- Position Size: Not established by the available evidence.
- Probability: Not established by the available evidence. -
Scenario Analysis (🔄):
| Scenario | Probability | Target | Trigger |
|---|---|---|---|
| Bull | Not established by the available evidence. | Not established by the available evidence. | If GPT-6 Astra independently verifies as AGI-level per third-party evals, and AI-safety bill fails in Congress. |
| Base | Not established by the available evidence. | Not established by the available evidence. | If AGI claim is debated but AI adoption accelerates in industry while school bans remain localized; US-Venezuela deal proceeds without legislative blockage. |
| Bear | Not established by the available evidence. | Not established by the available evidence. | If NYC-style AI bans expand to other jurisdictions or AI safety bill gains momentum, and oil deal collapses over sanctions. | -
Risk Factors (⚠️):
- AGI claim from OpenAI is unverified; the WaPo/Axios reports are one-sided.
- NYC school AI ban is state/municipal but may signal broader regulatory trend.
- US-Venezuela oil deal lacks disclosed terms, creating uncertainty over enforcement.
- References in show link to Politico data center polling — suggests political pressure on AI infrastructure. -
Actionable Trading/Allocation Plan (🎯):
- Monitor OpenAI's GPT-6 Astra technical documentation and third-party benchmark results to evaluate the AGI claim.
- Track NYC DOE policy implementation timeline and any extension to higher grades or other cities.
- Follow official US and Venezuelan government statements or legislative text on the oil deal.
- Watch Polymarket odds on 'best AI model end of 2026' and 'US AI safety bill before 2027' as real-time sentiment indicators.
- Review the linked Axios and WaPo articles for Altman/Brockman direct quotes and model capabilities.

-
Creator Horizon Category (⏱️): Long-Horizon Macro / Structural — The segment spans multi-year S&P earnings resilience, automation-led factory CapEx, AI/data-center spending, sector rotation, and demographic labor-fill questions.
-
One-Line Thesis (💡): The Compound creators argue the positive S&P story rests not on one macro narrative but on resilient earnings, rising automated factory CapEx, and broadening rotation, while warning that investors who over-index to negative narratives "miss the next 20% the S&P" and framing current sentiment as "pensive" rather than overtly bearish.
-
Key Data Points (📊):
- next 20% the S&P — claimed by creators as the move investors miss when they get carried away by negative narratives
- 18 to 35-year-olds — creators say factories will not all be filled by that cohort; much will be automated
- 2000 — creators call the current rotation the healthiest aspect versus the 2000 cycle
- Shake Shack is not supplying french fries to data centers — creator metaphor flagging that AI/data-center CapEx does not broad-broad-based consumer/capex benefit
- outputs and results continue to get better — claim tied to the technical incentive not to draw down CapEx -
Technical Levels & Setups OR Macro Drivers (📌):
- Earnings are going up without additional head count — productivity-driven earnings support thesis.
- We're going to have a lot more factories, but a lot of it's going to be automated — manufacturing CapEx is real but labor-intensive employment may not follow.
- Outputs and results continue to get better, so there is no technical incentive for drawing down CapEx — continuation driver for AI/data-center invest.
- The rotation happening is the healthiest thing versus 2000 — sector broadening is framed as support for the cycle.
- The glass half full version is we're building the wall of worry and you need that — sentiment setup for continued upside resilience. -
Risk/Reward Framework (⚖️):
- Entry: Not established by the available evidence.
- Stop: Not established by the available evidence.
- Targets: Not established by the available evidence.
- Risk/Reward: Not established by the available evidence.
- Position Size: Not established by the available evidence.
- Probability: Not established by the available evidence. -
Scenario Analysis (🔄):
| Scenario | Probability | Target | Trigger |
|---|---|---|---|
| Bull | Not established by the available evidence. | Not established by the available evidence. | Positive earnings without headcount and continued data-center/factory CapEx outputs let investors avoid missing "the next 20% the S&P"; rotation continues. |
| Base | Not established by the available evidence. | Not established by the available evidence. | Economy and S&P earnings both remain resilient, the "wall of worry" persists, and rotation keeps the cycle healthier than 2000. |
| Bear | Not established by the available evidence. | Not established by the available evidence. | The "negative narrative" wins if CapEx is drawn down, factories do not get filled by the 18-to-35 cohort, or demographic/automation anxiety — "live longer but nothing to do and nowhere to live" — becomes dominant. | -
Risk Factors (⚠️):
- Creator claims contain no numeric earnings, valuation, or sector-concentration figures, so the "next 20%" statement is not independently verifiable from the transcript.
- Shake Shack/data-center comment highlights risk that CapEx enthusiasm is concentrated and does not translate into broad consumer-facing earnings.
- No explicit invalidation level or stop is provided; the "pensive" closing line acts as an unquantified downside tell.
- Automation "more factories" claim needs verification against factory construction/employment data before accepting as a durable driver.
- Rotation "healthiest vs 2000" claim needs breadth/leadership data to confirm the cycle is not late-stage. -
Actionable Trading/Allocation Plan (🎯):
- Track data-center and factory CapEx commitments to see whether outputs/results remain strong enough to disincentivize drawdowns.
- Check manufacturing jobs and labor-force participation for the 18-to-35 age cohort against factory-automation investment.
- Follow index/sector rotation trends relative to 2000-style concentration to test the "healthiest rotation" claim.
- Reconcile any "next 20% S&P" expectation only after establishing current index level, EPS path, and multiple assumptions — none are set in the video.
-
Creator Horizon Category (⏱️): Short-Term Technical — Video is a live pre-market preparation for immediate trading reaction to the US labor report using technical analysis for futures and options traders.
-
One-Line Thesis (💡): The creator presents a live pre-market preparation for the critical US Labor Report, focusing on real-time market reaction and technical analysis for futures and options traders.
-
Key Data Points (📊):
- CRITICAL Labor Report — central macro catalyst highlighted in the video title
- Live Market Reaction — video is explicitly tracking immediate market response
- Pre-market technical analysis — described as 'the best pre market technical analysis for futures traders and options traders'
- Broadcast time 8:00 AM EST — video streams every trading day at this time
- Futures and options traders — stated target audience
- Live squawk link and technical analysis course — promoted in description, not part of core claims -
Technical Levels & Setups OR Macro Drivers (📌):
- US Labor Report (likely non-farm payrolls) as the key macro event driving live market reaction
- Pre-market technical analysis for futures and options — likely using charts and order flow, as per creator's stated approach -
Risk/Reward Framework (⚖️):
- Entry: Not established by the available evidence.
- Stop: Not established by the available evidence.
- Targets: Not established by the available evidence.
- Risk/Reward: Not established by the available evidence.
- Position Size: Not established by the available evidence.
- Probability: Not established by the available evidence. -
Scenario Analysis (🔄):
| Scenario | Probability | Target | Trigger |
|---|---|---|---|
| Unavailable | Not established by the available evidence. | Not established by the available evidence. | Verify source evidence. | -
Risk Factors (⚠️):
- No specific tickers, levels, entries, stops, or probabilities are disclosed in the metadata; actual claims are only in the unverified video content.
- The description includes a disclaimer stating the information is not financial or legal advice and that buying/selling financial instruments is speculative and risky. -
Actionable Trading/Allocation Plan (🎯):
- Watch the full video to capture the creator's stated trade setups, levels, and probabilities for the labor report reaction.
- Cross-reference the labor report release data (actual figures vs consensus) against any market claims made in the video.

-
Creator Horizon Category (⏱️): Long-Horizon Macro — The discussion compares asset classes using 100-year historical performance frequencies and long-term expected returns.
-
One-Line Thesis (💡): Josh claims that despite stocks' highest long-term expected return, he would choose cash for its flexibility, because over the past 100 years cash beat stocks in about one-third of years and bonds beat stocks in about three and a half out of every 10 years, while bonds currently yield 5% and cash yields three and a half percent or so with zero volatility.
-
Key Data Points (📊):
- $1,000 in USD cash, $1,000 in VT ETF, $1,000 in AG are the comparative asset options
- Stocks obviously have the highest long-term expected return
- Bonds have the best yield right now — about 5% on a bond market index fund like BND or AG
- Cash is sitting at about three and a half percent with zero volatility
- Over past 100 years, cash has beaten stocks about one-third of every year
- Over past 100 years, bonds have beaten stocks about three and a half out of every 10 years
- Duncan says he would take stocks
- Josh says he would probably take cash because it gives the most flexibility -
Technical Levels & Setups OR Macro Drivers (📌):
- Stocks' long-term expected return advantage vs. current valuation levels
- Bonds' 5% yield as an attractive income stream
- Cash's three and a half percent yield with zero volatility and optionality
- Historical frequency of cash and bonds outperforming stocks in any given year -
Risk/Reward Framework (⚖️):
- Entry: Not established by the available evidence.
- Stop: Not established by the available evidence.
- Targets: Not established by the available evidence.
- Risk/Reward: Not established by the available evidence.
- Position Size: Not established by the available evidence.
- Probability: Not established by the available evidence. -
Scenario Analysis (🔄):
| Scenario | Probability | Target | Trigger |
|---|---|---|---|
| Unavailable | Not established by the available evidence. | Not established by the available evidence. | Verify source evidence. | -
Risk Factors (⚠️):
- Historical outperformance frequency claims (one-third and three and a half out of 10) lack sources and are ambiguous about the definition of 'beaten'
- Video does not specify current stock valuation levels, making the attractiveness comparison incomplete
- The 5% bond yield may be time-stamped to the video date and may not persist
- Ticker 'AG' may be a misstatement for a commonly known bond ETF such as AGG; verification required -
Actionable Trading/Allocation Plan (🎯):
- Verify the 100-year rolling annual return statistics for cash vs. stocks and bonds vs. stocks using a reliable dataset (e.g., Morningstar, Ibbotson)
- Check current yields and composition of VT, BND, and the bond ETF referred to as 'AG' at the video's publication date
- Monitor changes in cash-equivalent rates relative to the indicated three and a half percent yield
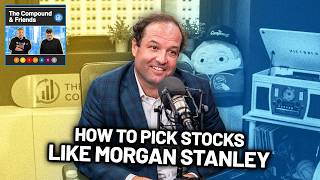
-
Creator Horizon Category (⏱️): Long-Horizon Macro / Structural — Skelly describes a paradigm shift in the economy away from cyclicals, an AI spending supercycle, and tariff-pricing stickiness that he expects to drive earnings for the next several quarters.
-
One-Line Thesis (💡): Dan Skelly argues the S&P 500's 28% index-level and 14% median-company earnings growth in Q2 reflects tariff-related price passthrough (companies kept 60-70% of price hikes) plus AI productivity on a no-hire/no-fire workforce, with a 12-24 month AI-driven labor 'lever' still to boost margins.
-
Key Data Points (📊):
- Q2 S&P 500 earnings growth ~28% YoY at the index level; median company ~14% YoY
- Q2 revenue growth ~15% YoY versus ~6% nominal GDP
- Wealth management revenues moved from ~8% of Morgan Stanley firm revenues in 2005 to ~60% pro forma after Smith Barney, E*Trade, and Morgan Stanley at Work deals
- Companies passed through 60-70% of tariff-related cost increases and did not give the pricing back
- No hiring/no firing environment has persisted for a couple of years; AI productivity is showing up in margins
- AI-driven labor reduction/margin 'lever' is expected to hit within 12-24 months, according to Skelly
- Morgan Stanley Wealth + MSIM total assets 'something like 16-17 trillion'
- Q2 revenue growth of 15% on 6% nominal GDP is called 'incredible' by Skelly -
Technical Levels & Setups OR Macro Drivers (📌):
- Sticky tariff-related price increases on top of productivity gains are boosting margins for the 'average' company, not just megacap tech
- AI spending is creating an atypical economic cycle; labor apocalypse/software apocalypse fears have not materialized
- Fortune 500 behavior seen as AI productivity on top of existing workforce, not broad headcount changes
- Market rotation/broadening from concentrated first-half momentum leadership is seen as rebalancing investor sentiment from FOMO to 50/50
- Historical cyclical labor needs (assembly line, logistics) are being avoided as revenue grows without proportional headcount additions -
Risk/Reward Framework (⚖️):
- Entry: Not established by the available evidence.
- Stop: Not established by the available evidence.
- Targets: Not established by the available evidence.
- Risk/Reward: Not established by the available evidence.
- Position Size: Not established by the available evidence.
- Probability: Not established by the available evidence. -
Scenario Analysis (🔄):
| Scenario | Probability | Target | Trigger |
|---|---|---|---|
| Bull | Not established by the available evidence. | Not established by the available evidence. | AI productivity continues and the 12-24 month labor 'lever' materializes as real margin uplift; index and median earnings growth stay elevated |
| Base | Not established by the available evidence. | Not established by the available evidence. | Economy stays resilient, tariff price passthrough sticks, and earnings broadening persists with no recession triggers |
| Bear | Not established by the available evidence. | Not established by the available evidence. | Pricing power breaks (companies finally forced to give back tariff hikes) or one of the AI 'boogeymen' (labor apocalypse, software apocalypse) reasserts; rotation/leadership implosion deepens | -
Risk Factors (⚠️):
- Skelly explicitly frames the tariff-linked earnings boost as a 'presumption' he is trying to prove with data, not an established fact
- No specific portfolio parameters, entry points, targets, or position sizes are given in the transcript
- The 'labor lever' is hypothetical/forward-looking and not yet visible in margin data
- The market-broadening and 50/50 sentiment claims are anecdotal and not sourced to a formal poll
- Morgan Stanley asset figure is conversational ('something like 16 17 trillion'), not audited -
Actionable Trading/Allocation Plan (🎯):
- Track next quarters' S&P 500 index versus median EPS growth to confirm broadening (Q2: 28% index vs 14% median)
- Monitor earnings calls/commentary for whether companies maintain tariff-driven price increases or announce rollbacks
- Watch for data on headcount, productivity, and AI adoption to validate the 12-24 month 'labor lever' thesis
- Follow Morgan Stanley GIC and Dan Skelly's CNBC/appearances for updates on market concentration and broadening

-
Creator Horizon Category (⏱️): Short-Term Technical — The creator describes a live trading stream reacting to the September 4 NFP release, suggesting an intraday or near-term horizon.
-
One-Line Thesis (💡): The creator claims that today's Non-Farm Payrolls (NFP) report is the central catalyst but may trigger less market movement than typical because rate-hike odds have 'chilled...for now.'
-
Key Data Points (📊):
- Headline: 'Non Farm Vigilantes - SEP 4 - Stock Market LIVE, Live Trading, Stock News' — emphasis on NFP and live trading.
- Description line: 'NFP but not as reactive since rate hike odds chilled...for now.' — central claim of reduced market reactivity.
- Trading platforms used: E*TRADE Pro (screen shown), ThinkOrSwim (long-term investing), Fidelity (long-term).
- Videos referenced: 'Nightly Watchlist/main channel' and 'How to make the long term' — no tickers or levels provided.
- Disclaimer: 'Option trading is really risky and you are more than likely going to lose your money copying anything you see on this stream or channel.' — creator-issued risk warning. -
Technical Levels & Setups OR Macro Drivers (📌):
- NFP (Non-Farm Payrolls) release on September 4 — key macro catalyst.
- Chilled rate-hike odds — reduces expected market reaction to NFP, per creator.
- Live trading environment across multiple platforms — no specific setup disclosed. -
Risk/Reward Framework (⚖️):
- Entry: Not established by the available evidence.
- Stop: Not established by the available evidence.
- Targets: Not established by the available evidence.
- Risk/Reward: Not established by the available evidence.
- Position Size: Not established by the available evidence.
- Probability: Not established by the available evidence. -
Scenario Analysis (🔄):
| Scenario | Probability | Target | Trigger |
|---|---|---|---|
| Unavailable | Not established by the available evidence. | Not established by the available evidence. | Verify source evidence. | -
Risk Factors (⚠️):
- No specific invalidation level or price trigger is provided; creator did not disclose entry, stop, or target.
- Creator explicitly warns that options trading is risky and copying trades likely leads to losses.
- Absence of an actual NFP number or rate-hike probability figure in the evidence prevents quantitative scenario analysis. -
Actionable Trading/Allocation Plan (🎯):
- Monitor the September 4 NFP release data (actual vs. consensus) to compare against the creator's claim of reduced market reactivity.
- Track changes in rate-hike odds (e.g., fed funds futures pricing or other measures) to verify whether they remain 'chilled.'
- Review the creator's additional videos (Nightly Watchlist, 'How to make the long term') for any detailed trade plans or levels, as the live stream description lacks specifics.
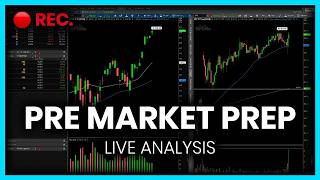
-
Creator Horizon Category (⏱️): Short-Term Technical — The video is explicitly labeled as pre-market technical analysis for futures and options traders, implying a short-term trading horizon.
-
One-Line Thesis (💡): The video claims that market weakness remains as traders test the impact of 'Trump's pullout plan' during the pre-market session.
-
Key Data Points (📊):
- WEAKNESS REMAINS — video title claim
- Markets Test Trump's Pullout Plan — video title claim
- Live every trading day at 8:00 AM EST — from description
- Pre-market technical analysis for futures traders and options traders — from description -
Technical Levels & Setups OR Macro Drivers (📌):
- Persistent market weakness — central thesis based on video title
- Trump's pullout plan — macro/political catalyst referenced in title
- Pre-market session focus — timing of analysis (8:00 AM EST) -
Risk/Reward Framework (⚖️):
- Entry: Not established by the available evidence.
- Stop: Not established by the available evidence.
- Targets: Not established by the available evidence.
- Risk/Reward: Not established by the available evidence.
- Position Size: Not established by the available evidence.
- Probability: Not established by the available evidence. -
Scenario Analysis (🔄):
| Scenario | Probability | Target | Trigger |
|---|---|---|---|
| Unavailable | Not established by the available evidence. | Not established by the available evidence. | Verify source evidence. | -
Risk Factors (⚠️):
- No specific tickers, price levels, or invalidation conditions are present in the metadata-only evidence.
- The phrase 'Trump's pullout plan' is ambiguous without further video content.
- The video is live pre-market content; claims are unverified until the full recording is reviewed. -
Actionable Trading/Allocation Plan (🎯):
- Review full video content to extract exact indices, futures, levels, and stop/target parameters.
- Verify the meaning of 'Trump's pullout plan' and its market relevance from the video narrative.
- Monitor the timeframe (8:00 AM EST) to align with the video's pre-market analysis context.

-
Creator Horizon Category (⏱️): Short-Term Technical — The stream is a real-time trading and stock news session focused on sector rotation among software, semiconductors, and staples for the near term.
-
One-Line Thesis (💡): Creator asserts that the current market phase is 'rotate rather than retreat' and that upcoming earnings reports from IGV (software) and SMH (semiconductors) will be the key catalysts to watch.
-
Key Data Points (📊):
- Rotate rather than retreat continues — headline thesis from description.
- Good earnings on the 2 dominant fields of IGV & SMH will play out interesting — creator's forecast for these ETFs.
- Sectors referenced: Software (IGV), Chips/Semiconductors (SMH), Staples (implied by video title).
- Video is a live trading stream with real-time stock news, not a recorded analysis. -
Technical Levels & Setups OR Macro Drivers (📌):
- Upcoming earnings from IGV and SMH are positioned as the dominant catalysts.
- Rotation theme across software, chips, and staples drives the narrative.
- Multiple trading platforms (E*Trade, ThinkOrSwim, Fidelity) used but no specific strategy disclosed. -
Risk/Reward Framework (⚖️):
- Entry: Not established by the available evidence.
- Stop: Not established by the available evidence.
- Targets: Not established by the available evidence.
- Risk/Reward: Not established by the available evidence.
- Position Size: Not established by the available evidence.
- Probability: Not established by the available evidence. -
Scenario Analysis (🔄):
| Scenario | Probability | Target | Trigger |
|---|---|---|---|
| Unavailable | Not established by the available evidence. | Not established by the available evidence. | Verify source evidence. | -
Risk Factors (⚠️):
- No specific earnings dates, price levels, or valuation context provided.
- Creator's own disclaimer: options trading is risky and copying trades likely loses money.
- Earnings could disappoint and disrupt the 'rotate rather than retreat' narrative.
- Absence of quantifiable entry, stop, or target levels limits verification. -
Actionable Trading/Allocation Plan (🎯):
- Monitor IGV and SMH for upcoming earnings reports and subsequent price action to validate the creator's catalyst claim.
- Track relative strength among software, semiconductors, and consumer staples sectors to assess whether rotation continues or reverses.
- Access the full video stream for real-time commentary and any additional trade details not captured in metadata.
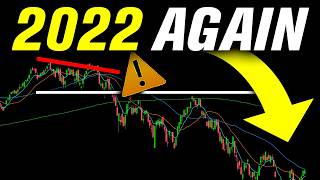
-
Creator Horizon Category (⏱️): Short-Term Technical — Video is a 'Midweek Market Update' that emphasizes key support/resistance levels and an actionable options-trading game plan, while the bear-market title question is not tied to a stated horizon.
-
One-Line Thesis (💡): Trade Brigade's video headlines the question '2022 Bear Market Incoming?' and states it will review the best stocks for options trading, key support/resistance levels, and an actionable game plan across SPY, QQQ, IWM, S&P sectors, a core large-cap list, and specific trade-idea tickers.
-
Key Data Points (📊):
- Title '2022 Bear Market Incoming?' — headline question framing the video.
- Description claims 'best stocks for options trading' and coverage of 'key levels of support and resistance' and an 'actionable game plan'.
- Timestamps: SPY at 00:50, QQQ at 11:50, IWM at 20:35, S&P Sectors at 24:15.
- Sections: Fundamental Evidence at 35:50, Technical Evidence at 40:00.
- Core List at 45:00: NVDA, AAPL, MSFT, AMZN, GOOGL, AVGO, META, TSLA, JPM, MU, AMD, INTC.
- Trade Ideas at 54:30: IREN, GLW, AEHR, NBIS, SMCI, RBRK.
- Promotional links in description: Discord, trading scripts, technical analysis course, TradeZella 20% off code 'TB'. -
Technical Levels & Setups OR Macro Drivers (📌):
- Video structure implies support/resistance levels will be keyed to SPY, QQQ, IWM, S&P sectors, and individual tickers.
- Separate 'Fundamental Evidence' and 'Technical Evidence' blocks suggest a combined fundamental/technical framework.
- Core List and Trade Ideas segments indicate actionable options-trading candidates among large-cap tech/semis and additional trade-idea names. -
Risk/Reward Framework (⚖️):
- Entry: Not established by the available evidence.
- Stop: Not established by the available evidence.
- Targets: Not established by the available evidence.
- Risk/Reward: Not established by the available evidence.
- Position Size: Not established by the available evidence.
- Probability: Not established by the available evidence. -
Scenario Analysis (🔄):
| Scenario | Probability | Target | Trigger |
|---|---|---|---|
| Unavailable | Not established by the available evidence. | Not established by the available evidence. | Verify source evidence. | -
Risk Factors (⚠️):
- No actual support/resistance levels, entries, exits, or economic data are present in the provided metadata; any application requires watching the full video.
- The '2022 Bear Market Incoming?' question is rhetorical in the title; its answer and supporting evidence cannot be verified from this metadata-only record.
- Video includes promotional/affiliate links (TradeZella, scripts, course, Discord) that may create commercial bias.
- Disclaimer states the presenter is not a Registered Investment Advisor and content is informational only. -
Actionable Trading/Allocation Plan (🎯):
- Watch the full video to extract numeric levels for SPY, QQQ, IWM and each named ticker before treating the 'key levels' as actionable.
- Verify whether the Fundamental Evidence and Technical Evidence sections actually support a bear-market analogy to 2022.
- Cross-check each Core List and Trade Ideas ticker against current price, volatility, and options liquidity because metadata provides no options-specific parameters.
- Treat all cited links and discount codes as separate from any analytical claims.
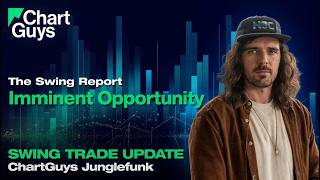
-
Creator Horizon Category (⏱️): Short-Term Technical — All analysis centers on daily/weekly trend confirmations, bounce attempts, and tightening-range breakouts across equity indices and stocks.
-
One-Line Thesis (💡): The broad market is in a low-volume, labor-day-shortened consolidation where bulls defending prior highs have stalled follow-through; the next decisive move depends on daily bounce confirmations (SPY, NQ) and on whether tightening ranges in memory/semiconductor names (MU, SNDK, WDC) break bull or bear, with precious metals in do-or-die weekly consolidation.
-
Key Data Points (📊):
- S&P 500 — confirmed daily downtrend but no follow-through; bulls defend previous all-time high; weekly 12 EMA holds; SPY backtest of prior ATH is clean.
- NASDAQ — slightly lower low with no follow-through; bulls defending value area low; potential weekly bull flag if daily uptrend restarts.
- MU — tightening range described as 'never had a tightening range like this' on DRAM; prior early-August MU tightening-range break led to a solid bounce in NASDAQ.
- SNDK — stronger inside the tightening range, attempting breakout; WDC weaker than peers.
- PLTR — daily: bulls hoping for lower-low no follow-through; creator's trade stopped out at 16618; day's bounce recorded as 2.82%.
- MRNA — tightening daily range; 10% day inside the larger 'mother bar' still counts as opportunity.
- Gold — after 20% move and miners 50% move, weekly consolidation needs bulls to step up for a weekly higher low.
- Silver — similar healthy consolidation so far; another decent leg down would verge into unhealthy.
- Semiconductor ratio (SMH/QQQ) — if weekly downtrend confirms, indicates sustained relative weakness; bulls want to hold lows and prevent confirmation.
- MAGS/SPY — at weekly equilibrium; potential weekly lower high if MAGS loses relative strength.
- TSLA — 'haphazard' daily uptrend, +23% move, but daily higher highs lack follow-through; weekly higher low possible.
- AVGO — bearish earnings initially but bought back up, leaving SMH 'chilling' after hours.
- Low volume / Labor Day — limited trading Monday; expects decisiveness to return in fall. -
Technical Levels & Setups OR Macro Drivers (📌):
- NQ: requires 4-hour uptrend to initiate daily bounce; then must bounce big enough to form daily higher low; given current damage, lower high is most likely on next bounce.
- Memory stocks (MU, SNDK, WDC): tightening ranges are set to break; bull break anticipated to produce a solid daily bounce in NQ and allow MU to shape weekly higher low; bear break would likely push markets down.
- SMH: holding potential double bottom; bull hope for another chance at 'that right there' (prior high) via daily bounce and weekly higher low; bear hope for inverse cup-and-handle leading to lower lows.
- Semiconductor relative strength (SMH/QQQ ratio): bulls want to hold lows and avoid weekly downtrend confirmation; a break up in the ratio could form monthly higher low.
- PLTR: bulls need to regain hourly uptrend, then daily bounce; watch for daily lower high; potential megaphone action if bulls return.
- TSLA: relative strength vs QQQ at weekly 12 EMA; being a clear weekly 12 EMA rider — respecting this level keeps TSLA constructive; bears need to break it to signal sustained weakness.
- Gold/Silver: weekly consolidation remains healthy only if bulls defend current lows and print weekly higher low; otherwise quick monthly lower highs possible.
- MRNA: nothing changes until it breaks out of the 'mother bar' range.
- MAGS: within a broad rising wedge, higher highs lacking follow-through implies potential for tightening/rally-wedge risk. -
Risk/Reward Framework (⚖️):
- Entry: Not established by the available evidence.
- Stop: Not established by the available evidence.
- Targets: Not established by the available evidence.
- Risk/Reward: Not established by the available evidence.
- Position Size: Not established by the available evidence.
- Probability: Not established by the available evidence. -
Scenario Analysis (🔄):
| Scenario | Probability | Target | Trigger |
|---|---|---|---|
| Bull | Not established by the available evidence. | Not established by the available evidence. | SPY and NQ produce a daily bounce after confirmed daily downtrends; memory/semiconductor tightening ranges (MU/SNDK/WDC) break upward, leading to NQ weekly higher low and SMH/QQQ ratio avoiding weekly downtrend confirmation. |
| Base | Not established by the available evidence. | Not established by the available evidence. | Continued low-volume, holiday-impacted consolidation; SPY holds around prior ATH with no follow-through; ranges (MU, MRNA, SNDK) continue tightening without clear breakout direction; metals remain at do-or-die lows without decisive move. |
| Bear | Not established by the available evidence. | Not established by the available evidence. | Bears take out supports: SPY/NQ fail to hold prior ATH/value-area low; memory ranges break downward; SMH/QQQ confirms weekly downtrend; gold/silver lose current lows; XLF breaks supports, undermining the 2-day 12 EMA rider status. | -
Risk Factors (⚠️):
- Low volume and Labor Day holiday may delay or distort technical signals — creator explicitly notes 'right now is not that time' for decisiveness.
- Lack of follow-through on multiple daily and 4-hour trend attempts (SPY, NQ, SMH, TSLA) — lower highs are a persistent risk.
- Semiconductor weakness could persist if MU/SNDK/WDC tightening ranges break to the downside, affecting NASDAQ and broader tech.
- PLTR trade discipline failure (one-shot risk allocation) highlights execution risk but creator notes no major loss; still a missed opportunity.
- MAGS higher highs without follow-through could lead to rising-wedge dynamics and relative underperformance vs SPY.
- Gold/silver at 'do-or-die' lows — any additional leg down would mark unhealthy weekly consolidation.
- Bearish earnings reaction (AVGO) was bought back up, but after-hours action 'chilling' — may not confirm direction. -
Actionable Trading/Allocation Plan (🎯):
- Track tightening-range breakouts in MU, SNDK, WDC; bull breaks would favor NQ upside and weekly higher low in MU, while bear breaks would signal further semiconductor-led downside.
- Watch SMH/QQQ ratio for weekly downtrend confirmation — bulls must hold lows; a break upward would signal monthly higher low and renewed semis leadership.
- For PLTR, monitor whether bulls regain hourly uptrend and hold previous support base; a lower-low no-follow-through pattern would be supportive; continue to respect any daily lower-high risk.
- On metals (gold/silver), watch for weekly higher low formation — if bulls fail and further leg down occurs, weekly consolidation becomes unhealthy.
- In MAGS/SPY, monitor weekly equilibrium level; a weekly lower high in the ratio would signal relative weakness for mega-cap tech.
- Note low-volume environment and Labor Day break — expect decisions to arrive only after fall trading resumes.
-
Creator Horizon Category (⏱️): Short-Term Technical — Creator previews Snowflake earnings and cites last quarter's +38% one-day stock reaction, implying near-term event-driven focus.
-
One-Line Thesis (💡): Snowflake is becoming a critical layer for agentic AI inside the data warehouse, and its upcoming earnings could reprise last quarter's beat-and-raise stock pop (+38% next day) as the market sniffs out expanding margins.
-
Key Data Points (📊):
- 38% — Snowflake stock's one-day gain after its last earnings report
- 12% — Dell's after-hours gain after reporting expanding margins (used as analog for market sniffing out margin expansion)
- Snowflake last reported: beat and raised guidance, then warned competitors to run agentic AI in the data warehouse
- Creator's claim: Snowflake 'ground zero for the agentic future' with LLMs coming into the Snowflake environment, avoiding data duplication/movement -
Technical Levels & Setups OR Macro Drivers (📌):
- Earnings preview for Snowflake (unnamed ticker but context implies SNOW)
- Last quarter's beat-and-raise and subsequent +38% surge as precedent
- Dell's 12% after-hours move on margin expansion cited as evidence the market often anticipates such catalysts
- Structural agentic AI trend: LLMs run inside Snowflake's data warehouse, not by moving data across platforms -
Risk/Reward Framework (⚖️):
- Entry: Not established by the available evidence.
- Stop: Not established by the available evidence.
- Targets: Not established by the available evidence.
- Risk/Reward: Not established by the available evidence.
- Position Size: Not established by the available evidence.
- Probability: Not established by the available evidence. -
Scenario Analysis (🔄):
| Scenario | Probability | Target | Trigger |
|---|---|---|---|
| Bull | Not established by the available evidence. | Not established by the available evidence. | Snowflake delivers another beat-and-raise, possibly leading to a stock reaction similar to the prior +38% one-day move. | -
Risk Factors (⚠️):
- Creator explicitly caveats 'who the hell knows what snow will do tomorrow' — market reaction is unpredictable.
- The +38% move is a historical precedent, not a guarantee; future earnings could disappoint.
- Creator's 'most important layer' claim is opinion, not verified by third-party data in the evidence. -
Actionable Trading/Allocation Plan (🎯):
- Monitor Snowflake's next earnings report for actual results versus guidance and any margin commentary.
- Cross-check Snowflake's product positioning for agentic AI in data warehouses against official announcements.
- Track whether the market reacts similarly to the last quarter's +38% move, acknowledging uncertainty.

-
Creator Horizon Category (⏱️): Long-Horizon Macro — The video addresses economic growth and spending sustainability across the rest of this decade.
-
One-Line Thesis (💡): The creator highlights a debate over whether extreme corporate valuations and heavy spending are sustainable, citing both a bullish case that continued spending can keep the economy growing and a bearish case that spending is unsustainable and late-cycle behavior is visible in the market.
-
Key Data Points (📊):
- Valuations of these companies make no sense — creator notes 'people were dead right about that' — implying prior bearish calls were correct
- If they keep spending this much money, there's no way the economy is going to stop and slow down — presented as a bull argument
- Bears: 'They can't keep spending this much money. This is unsustainable.' — cited as the counter-argument
- Asset managers getting acquired, custodians building scale — categorized as 'rampant bull market behavior'
- Housing activity question: 'How worse would inflation be if housing activity were booming?' — links housing to inflation risk -
Technical Levels & Setups OR Macro Drivers (📌):
- Sustained heavy spending as a potential growth driver (bull case)
- Unchecked spending flagged as unsustainable (bear case)
- Acquisition and custodian scale-building regarded as late-cycle, frothy signals
- Housing activity treated as a possible inflation accelerant -
Risk/Reward Framework (⚖️):
- Entry: Not established by the available evidence.
- Stop: Not established by the available evidence.
- Targets: Not established by the available evidence.
- Risk/Reward: Not established by the available evidence.
- Position Size: Not established by the available evidence.
- Probability: Not established by the available evidence. -
Scenario Analysis (🔄):
| Scenario | Probability | Target | Trigger |
|---|---|---|---|
| Bull | Not established by the available evidence. | Not established by the available evidence. | If they keep spending this much money, the economy keeps growing and does not stop or slow down. |
| Bear | Not established by the available evidence. | Not established by the available evidence. | If spending is unsustainable and forces a slowdown, validating the bearish view that valuations are nonsensical. | -
Risk Factors (⚠️):
- Inability to verify the sustainability of continued spending without specific macro data
- No quantitative targets or valuation levels provided in the video
- Housing activity may exacerbate inflation but the creator provides no metric or timeframe -
Actionable Trading/Allocation Plan (🎯):
- Monitor fiscal spending and economic growth indicators to test whether spending levels persist across the decade
- Track M&A and custodian consolidation headlines as possible froth signals
- Watch housing market activity and inflation data to assess the inflation-housing relationship highlighted in the video
-
Creator Horizon Category (⏱️): Short-Term Technical — Evidence positions the stream as pre-market technical analysis for futures and options traders, focused on structure breaks and short-term downtrend drift.
-
One-Line Thesis (💡): The creator claims markets are breaking structure and drifting into a downtrend, based on live pre-market technical analysis for futures and options traders.
-
Key Data Points (📊):
- STRUCTURE BREAKING — headline claim in title
- Markets Drifting Into A Downtrend — headline claim in title
- Live pre-market technical analysis for futures traders and options traders — stated purpose
- Stream runs every trading day at 8:00 AM EST — claimed cadence
- Product links: live squawk, technical analysis course, trading scripts, newsletter, TradeZella discount — monetization context
- Disclaimer: not financial advice, not a Registered Investment Advisor — stated risk limitation -
Technical Levels & Setups OR Macro Drivers (📌):
- Creator identifies a market 'structure break' as the primary technical setup for the session.
- Creator characterizes the broader market as 'drifting into a downtrend' — direction bias for intrabday trading. -
Risk/Reward Framework (⚖️):
- Entry: Not established by the available evidence.
- Stop: Not established by the available evidence.
- Targets: Not established by the available evidence.
- Risk/Reward: Not established by the available evidence.
- Position Size: Not established by the available evidence.
- Probability: Not established by the available evidence. -
Scenario Analysis (🔄):
| Scenario | Probability | Target | Trigger |
|---|---|---|---|
| Bear | Not established by the available evidence. | Not established by the available evidence. | Creator's stated expectation: structure breaking and markets drifting into a downtrend. |
| Base | Not established by the available evidence. | Not established by the available evidence. | No explicit base-case trigger provided in the available metadata. |
| Bull | Not established by the available evidence. | Not established by the available evidence. | No explicit bull-case trigger provided in the available metadata. | -
Risk Factors (⚠️):
- Metadata-only evidence: no specific tickers, price levels, or timing parameters are available for verification.
- The 'structure break' and 'downtrend' claims are unquantified and cannot be independently assessed from the video description alone.
- Stream is promotional (live squawk, courses, newsletter) and disclaims advisory status — treat content as entertainment/education. -
Actionable Trading/Allocation Plan (🎯):
- Verify the creator's exact chart references and noted structure breaks by reviewing the video transcript or time-stamped replay.
- Monitor the creator's live squawk or newsletter for tickers and price levels associated with the stated downtrend.
- Cross-reference any claimed market indices (e.g., ES, NQ) with independent technical data if available.
- Note the 8:00 AM EST livestream schedule as a recurring source for future pre-market claims.

-
Creator Horizon Category (⏱️): Long-Horizon Macro — The episode covers multi-year macro calls such as no recessions for the rest of the 2020s and Gen Z entering the housing market, alongside shorter-term market themes.
-
One-Line Thesis (💡): The episode of Animal Spirits makes a series of macro and market claims—including an AI debt binge, no recessions for the rest of the 2020s, a dead cat bounce in software stocks, and Gen Z buying houses—without providing supporting data in the metadata.
-
Key Data Points (📊):
- No recessions for the rest of the 2020s — host claim
- AI debt binge — discussed as a market risk
- Dead cat bounce in software stocks — market characterization
- Rising yields are a good thing — stated view
- Gen Z will be buying houses — demographic prediction
- Bull market M&A deals — market trend noted
- No one cares about dividends anymore — investor behavior claim
- The Next Michael Burry — title, implying a contrarian or short-seller profile
- Kevin Warsh thoughts on the economy — cited external commentary
- AI civilizations — speculative/futuristic topic -
Technical Levels & Setups OR Macro Drivers (📌):
- AI debt binge as a potential systemic risk driver
- Rising yields framed as a positive signal for the economy
- Software stocks identified as a 'dead cat bounce' setup
- Bull market M&A activity treated as a confidence indicator
- Gen Z housing demand considered a future tailwind
- Dividend neglect cited as an investor behavior shift -
Risk/Reward Framework (⚖️):
- Entry: Not established by the available evidence.
- Stop: Not established by the available evidence.
- Targets: Not established by the available evidence.
- Risk/Reward: Not established by the available evidence.
- Position Size: Not established by the available evidence.
- Probability: Not established by the available evidence. -
Scenario Analysis (🔄):
| Scenario | Probability | Target | Trigger |
|---|---|---|---|
| Bull | Not established by the available evidence. | Not established by the available evidence. | Hosts claim no recessions for the rest of the 2020s and that rising yields are a good thing, suggesting an optimistic macro backdrop. |
| Base | Not established by the available evidence. | Not established by the available evidence. | The episode discusses both positive themes (rising yields, no recession) and negative risks (AI debt binge, software dead cat bounce) without a clear skew in the metadata. |
| Bear | Not established by the available evidence. | Not established by the available evidence. | The 'AI debt binge' risk and the 'dead cat bounce' characterization of software stocks imply possible downside for markets if those concerns materialize. | -
Risk Factors (⚠️):
- No underlying data or sources provided in the metadata to verify the claims
- The hosts work at Ritholtz Wealth Management and may hold positions in discussed securities, creating potential conflicts of interest
- The video is explicitly informational, not personalized investment advice, and hosts' opinions are their own
- Specific tickers, price levels, valuations, and probability figures are absent from the evidence -
Actionable Trading/Allocation Plan (🎯):
- Verify the 'no recessions for the rest of the 2020s' claim against current macro forecasts and leading indicators
- Monitor corporate debt issuance and AI-related capital spending trends to assess the 'AI debt binge' risk
- Watch software stock price performance relative to earnings to test the 'dead cat bounce' characterization
- Check housing affordability and demographic data for first-time buyers (Gen Z) to evaluate the housing claim
- Review dividend payout trends and investor flows to confirm the 'no one cares about dividends' observation
- Seek out Kevin Warsh's original comments to compare with the hosts' summary

-
Creator Horizon Category (⏱️): Short-Term Technical — The video is a live trading stream dated SEP 2, focusing on immediate market conditions and September seasonality.
-
One-Line Thesis (💡): The creator asserts September is the worst month of the year for stocks, with current conditions characterized by high yields but low volatility.
-
Key Data Points (📊):
- September is the worst month of the year — video description
- High yields but low volatility — video description
- Sorry September (title) — signals bearish seasonal bias -
Technical Levels & Setups OR Macro Drivers (📌):
- September seasonality effect as a negative driver
- High yield environment potentially pressuring equities
- Low volatility setup possibly preceding a move -
Risk/Reward Framework (⚖️):
- Entry: Not established by the available evidence.
- Stop: Not established by the available evidence.
- Targets: Not established by the available evidence.
- Risk/Reward: Not established by the available evidence.
- Position Size: Not established by the available evidence.
- Probability: Not established by the available evidence. -
Scenario Analysis (🔄):
| Scenario | Probability | Target | Trigger |
|---|---|---|---|
| Unavailable | Not established by the available evidence. | Not established by the available evidence. | Verify source evidence. | -
Risk Factors (⚠️):
- No specific tickers, levels, or catalysts are provided in the metadata, making the claims unverifiable.
- The 'worst month' claim is a historical seasonal pattern, not a guaranteed outcome for this September. -
Actionable Trading/Allocation Plan (🎯):
- Monitor the creator's live stream for actual trade setups and specific security mentions.
- Cross-reference September seasonality data with current market indicators to validate the claim.

-
Creator Horizon Category (⏱️): Long-Horizon Macro / Structural — The creator discusses long-term institutional dynamics around scientific funding and culture, not near-term market technicals or specific macro catalysts.
-
One-Line Thesis (💡): The All-In Podcast speaker argues that institutions damage science by imposing business-style KPIs and ROI metrics, and instead should treat scientists as retained elite problem-solvers driven by legacy rather than compensation.
-
Key Data Points (📊):
- 10,000 years — speaker's stated horizon for desired name recognition, versus near-term Silicon Valley pay
- KPIs — administrator-introduced performance metrics criticized as substituting measurable proxies for true scientific value
- ROI — questioned by speaker as a fundamentally non-scientific mindset
- retainer — proposed model: keep top scientists on retainer to call for real problems, rather than funding them based on ROI
- consensus — institutions allegedly force non-consensus radical ideas back into mainstream
- rock stars — treating scientists this way is proposed to retain them -
Technical Levels & Setups OR Macro Drivers (📌):
- Institutional push for 'data-driven' KPIs and ROI — cited as a reason radical ideas cannot happen inside institutions
- Scientists' preference for lasting legacy over material rewards (McLaren comparison) — motivates retainer approach
- Nation-like behavior of the scientific establishment — forces conformity on dissenting views -
Risk/Reward Framework (⚖️):
- Entry: Not established by the available evidence.
- Stop: Not established by the available evidence.
- Targets: Not established by the available evidence.
- Risk/Reward: Not established by the available evidence.
- Position Size: Not established by the available evidence.
- Probability: Not established by the available evidence. -
Scenario Analysis (🔄):
| Scenario | Probability | Target | Trigger |
|---|---|---|---|
| Bull | Not established by the available evidence. | Not established by the available evidence. | If institutions adopt the retainer model and allow radical ideas to proceed without consensus forcing, the speaker implies scientific breakthroughs and retention would improve. |
| Base | Not established by the available evidence. | Not established by the available evidence. | If institutions continue to mix KPI/ROI demands with some scientific autonomy — no evidence in transcript for a specific outcome. |
| Bear | Not established by the available evidence. | Not established by the available evidence. | If the 'nation-like' consensus-forcing persists, radical scientists are lost — speaker states 'you're going to lose them'. | -
Risk Factors (⚠️):
- No supporting data or examples provided for claims about scientist retention or institutional failure
- Transcript lacks specifics on which institutions, scientific fields, or real-world outcomes are referenced
- Speaker's assertion that ROI mindset and scientific mindset are mutually exclusive is unverified -
Actionable Trading/Allocation Plan (🎯):
- Monitor subsequent All-In Podcast episodes for follow-up evidence or case studies on science funding and KPIs
- Verify the speaker's claim about scientist preferences for legacy by checking public statements or surveys from prominent researchers
- Track policy debates around academic research funding metrics (e.g., NIH/NSF review criteria) for echoes of this retainer-style proposal

-
Creator Horizon Category (⏱️): Short-Term Technical — The title references 'Weekly Consolidation' and the description focuses on short-term supports, indicating a short-term technical horizon.
-
One-Line Thesis (💡): The creator asks whether the current sideways price action is bullish or bearish, given that bulls are stalling at resistance while short-term supports are still holding.
-
Key Data Points (📊):
- Bulls stalling at resistance — creator's claim
- Short-term supports still held — creator's claim
- Title question: 'Time For Weekly Consolidation?' — creator's headline
- Description asks: 'Is the sideways trading bullish or bearish?' — creator's question -
Technical Levels & Setups OR Macro Drivers (📌):
- Resistance level stalling bulls (specific level not given)
- Short-term support holding (specific level not given)
- Sideways/consolidation price action being evaluated -
Risk/Reward Framework (⚖️):
- Entry: Not established by the available evidence.
- Stop: Not established by the available evidence.
- Targets: Not established by the available evidence.
- Risk/Reward: Not established by the available evidence.
- Position Size: Not established by the available evidence.
- Probability: Not established by the available evidence. -
Scenario Analysis (🔄):
| Scenario | Probability | Target | Trigger |
|---|---|---|---|
| Bull | Not established by the available evidence. | Not established by the available evidence. | Bulls break above the resistance level that is currently stalling them. |
| Base | Not established by the available evidence. | Not established by the available evidence. | Price continues to trade sideways without breaking resistance or support. |
| Bear | Not established by the available evidence. | Not established by the available evidence. | Short-term supports are lost, leading to downside. | -
Risk Factors (⚠️):
- No specific price levels provided in metadata, making verification of resistance/support impossible.
- No clear invalidation level stated.
- The question of bullish vs bearish is unanswered in the metadata alone. -
Actionable Trading/Allocation Plan (🎯):
- Watch the video for specific resistance/support price levels.
- Monitor price action relative to the mentioned resistance and support zones.
- Look for confirmation of breakout or breakdown in coming sessions.

-
Creator Horizon Category (⏱️): Other — The evidence contains only metadata (title, description, sponsor) with no substantive market horizon or investment content.
-
One-Line Thesis (💡): The video metadata identifies only episode 238 of Ask The Compound with hosts Ben Carlson and Duncan Hill; no investment thesis or market commentary is present in the provided evidence.
-
Key Data Points (📊):
- Episode 238 of Ask The Compound — hosts Ben Carlson and Duncan Hill
- Sponsor segment: Fitnexa / SomniPods 3, discount code ATC10 ($10 off) — non-investment promotional content
- Description includes standard disclaimers and links to social media, newsletter, and Ritholtz Wealth Management disclosures — no specific market claims -
Technical Levels & Setups OR Macro Drivers (📌):
- Not established by the available evidence. -
Risk/Reward Framework (⚖️):
- Entry: Not established by the available evidence.
- Stop: Not established by the available evidence.
- Targets: Not established by the available evidence.
- Risk/Reward: Not established by the available evidence.
- Position Size: Not established by the available evidence.
- Probability: Not established by the available evidence. -
Scenario Analysis (🔄):
| Scenario | Probability | Target | Trigger |
|---|---|---|---|
| Unavailable | Not established by the available evidence. | Not established by the available evidence. | Verify source evidence. | -
Risk Factors (⚠️):
- No investment claims are present in the evidence to invalidate; any analysis would require the full video transcript or audio content. -
Actionable Trading/Allocation Plan (🎯):
- Retrieve the full video transcript or audio to extract any substantive investment claims, tickers, or market commentary.
- Verify the episode's actual discussion topics by checking the show notes or timestamps in the full video description.
-
Creator Horizon Category (⏱️): Short-Term Technical — The video centers on Snowflake's imminent earnings report and a sudden momentum crash on Wall Street, both near-term market events.
-
One-Line Thesis (💡): The hosts preview Snowflake earnings as a potential tell on AI demand and software sector health, debate Tim Cook's Apple legacy, question whether software stocks are truly dead, and examine a momentum crash and Clear Secure.
-
Key Data Points (📊):
- Snowflake earnings preview — positioned as a signal for AI demand and the future of software
- Tim Cook's run at Apple — discussed as a potential 'greatest CEO' candidate
- Software stocks — debate over whether they are 'really dead'
- Momentum crash — described as 'sudden' and hitting Wall Street
- Clear Secure — featured as a discussion topic
- Episode segments: Intro, Snowflake Earnings Preview, Ed Zitron, Thanks Tim Cook, Software. Not Dead Yet, Momentum Crash?, Make The Case, Mystery Chart -
Technical Levels & Setups OR Macro Drivers (📌):
- Snowflake's upcoming earnings report as a catalyst for AI demand sentiment
- Debate on the terminal state of software stocks as a sector positioning theme
- Sudden momentum crash as a technical near-term market driver
- Tim Cook's legacy framing as a long-term Apple structural commentary
- Clear Secure as an individual stock discussion (no specifics provided) -
Risk/Reward Framework (⚖️):
- Entry: Not established by the available evidence.
- Stop: Not established by the available evidence.
- Targets: Not established by the available evidence.
- Risk/Reward: Not established by the available evidence.
- Position Size: Not established by the available evidence.
- Probability: Not established by the available evidence. -
Scenario Analysis (🔄):
| Scenario | Probability | Target | Trigger |
|---|---|---|---|
| Bull | Not established by the available evidence. | Not established by the available evidence. | If Snowflake's earnings report shows robust AI demand and software resilience, the bearish software narrative could be challenged. |
| Base | Not established by the available evidence. | Not established by the available evidence. | If the momentum crash stabilizes and the software debate continues without decisive data, markets may remain in a mixed, rangebound state. |
| Bear | Not established by the available evidence. | Not established by the available evidence. | If the momentum crash persists or Snowflake earnings disappoint on AI signals, software sentiment and market momentum could deteriorate further. | -
Risk Factors (⚠️):
- No specific financial figures, prices, or levels are provided in the evidence — any quantitative inference is unsupported.
- Earnings results for Snowflake are not yet public, creating event-driven uncertainty.
- The 'momentum crash' is described qualitatively without defined metrics or duration.
- The 'software stocks are dead' debate is opinion-based, lacking fundamental verification. -
Actionable Trading/Allocation Plan (🎯):
- Monitor Snowflake's upcoming earnings report and any guidance regarding AI demand and software growth.
- Track the momentum crash indicators mentioned by the hosts for signs of continuation or reversal.
- Review the hosts' arguments on software stocks and Clear Secure for context, while seeking independent fundamental data.
- Verify Tim Cook's Apple performance metrics (e.g., market cap, product cycle) against the discussion's claims.
-
Creator Horizon Category (⏱️): Short-Term Technical — The video is explicitly a daily pre-market technical analysis session for futures and options traders, targeting same-session trading opportunities.
-
One-Line Thesis (💡): The creator claims that a global bond sell-off is driving a pre-market gap down and crushing markets, and the video provides pre-market technical analysis to prepare traders for that session.
-
Key Data Points (📊):
- Global bond SELL OFF — headline claim of the video title
- GAP DOWN — headline claim of the video title
- Crushing Markets — headline claim of the video title
- Live every trading day at 8:00 AM EST — stated schedule
- Pre-market technical analysis for futures and options traders — stated purpose
- Links to course, scripts, live squawk, and newsletter — offered resources
- Disclaimer: information for informational purposes only, not financial advice — creator's own disclosure -
Technical Levels & Setups OR Macro Drivers (📌):
- Global bond sell-off cited as the primary catalyst for the market gap down
- Pre-market technical analysis setup used to assess futures and options trading conditions -
Risk/Reward Framework (⚖️):
- Entry: Not established by the available evidence.
- Stop: Not established by the available evidence.
- Targets: Not established by the available evidence.
- Risk/Reward: Not established by the available evidence.
- Position Size: Not established by the available evidence.
- Probability: Not established by the available evidence. -
Scenario Analysis (🔄):
| Scenario | Probability | Target | Trigger |
|---|---|---|---|
| Unavailable | Not established by the available evidence. | Not established by the available evidence. | Verify source evidence. | -
Risk Factors (⚠️):
- The evidence is metadata-only; actual technical levels, invalidation points, and trade plans are not captured
- The disclaimer states the content is for informational purposes only and not financial or legal advice
- The bond sell-off claim is unverified and may be context-specific to the date of publication -
Actionable Trading/Allocation Plan (🎯):
- Watch the video to extract specific technical levels, entry/stop/target plans, and market sentiment indicators
- Monitor futures and options pre-market volatility on the stated date to assess the magnitude of the gap down

-
Creator Horizon Category (⏱️): Other — The video covers executive communication tactics, not market positioning, technicals, or macro themes.
-
One-Line Thesis (💡): No-oriented questions elicit more candid feedback and guidance from busy executives than yes-oriented questions, because saying no frees the respondent from feeling committed or trapped.
-
Key Data Points (📊):
- An intern was told never to ask a question after 2:00 p.m. because the speaker cannot answer with a no.
- Tom O'Keefe, head of DBS for the Americas, advised thriving as an executive by going to the boss, being willing to get shot down, taking feedback, and coming back with a smarter idea.
- Yes-oriented questions like 'Are you in favor of this?' discourage listing problems because people feel every point is a commitment or trap.
- Getting out of the yes business entirely is a really smart move. -
Technical Levels & Setups OR Macro Drivers (📌):
- Boss's limited time is a driver: a no-oriented question yields immediate guidance even when the answer is no.
- Psychological safety after saying no encourages the respondent to list problems without feeling obligated to agree. -
Risk/Reward Framework (⚖️):
- Entry: Not established by the available evidence.
- Stop: Not established by the available evidence.
- Targets: Not established by the available evidence.
- Risk/Reward: Not established by the available evidence.
- Position Size: Not established by the available evidence.
- Probability: Not established by the available evidence. -
Scenario Analysis (🔄):
| Scenario | Probability | Target | Trigger |
|---|---|---|---|
| Unavailable | Not established by the available evidence. | Not established by the available evidence. | Verify source evidence. | -
Risk Factors (⚠️):
- The evidence does not address contexts where no-oriented questions might backfire or where yes-oriented questions are more effective. -
Actionable Trading/Allocation Plan (🎯):
- Test the no-oriented question style in a real conversation and observe the quality of feedback received.
- Verify the claim by asking 'Are you against this?' instead of 'Are you in favor?' and compare the responses.

-
Creator Horizon Category (⏱️): Short-Term Technical — The evidence supports this horizon classification.
-
One-Line Thesis (💡): Creator opens a September 1 live trading stream questioning whether September will start like last month, stating 'A lot happened but a little changed' without outlining a specific direction or catalyst.
-
Key Data Points (📊):
- Title: 'THE FIRST OF THE MONTH - SEP 1 - Stock Market LIVE, Live Trading, Stock News'.
- Hashtags: #stockmarket #Investing #stocks #livetrading #Trading #fomc — FOMC flagged as a relevant macro topic.
- Creator trades on E*TRADE Pro (screen shown), ThinkOrSwim (long-term), and Fidelity (long-term).
- Reference to prior month: 'Does September start off like last month?' — but no specific August performance data given. -
Technical Levels & Setups OR Macro Drivers (📌):
- Seasonal first-of-month trading context — creator explicitly frames the session as a monthly turn.
- FOMC hashtag suggests Federal Reserve policy news or expectations are considered relevant for the session.
- No specific tickers, sectors, or macro events are named in the metadata. -
Risk/Reward Framework (⚖️):
- Entry: Not established by the available evidence.
- Stop: Not established by the available evidence.
- Targets: Not established by the available evidence.
- Risk/Reward: Not established by the available evidence.
- Position Size: Not established by the available evidence.
- Probability: Not established by the available evidence. -
Scenario Analysis (🔄):
| Scenario | Probability | Target | Trigger |
|---|---|---|---|
| Unavailable | Not established by the available evidence. | Not established by the available evidence. | Verify source evidence. | -
Risk Factors (⚠️):
- The metadata contains no concrete market view, ticker, price level, or trading plan; any actual claims require viewing the full stream.
- The creator's statement 'A lot happened but a little changed' is ambiguous and not tied to any measurable metric in the metadata.
- FOMC hashtag appears without a stated meeting date or policy expectation, so its relevance is unverified. -
Actionable Trading/Allocation Plan (🎯):
- Access the full video recording to extract any actual trading ideas, levels, or market commentary.
- Monitor the creator's main channel for the 'Nightly Watchlist' linked in the description for potential follow-up analysis.

-
Creator Horizon Category (⏱️): Long-Horizon Macro / Structural — The creator discusses a long-horizon, structural view of UAPs and nuclear weapons, not a near-term market event.
-
One-Line Thesis (💡): The All-In Podcast creator argues that UAPs are likely tied to nuclear detonations, using the North Sentinel Island analogy to frame humanity as an uncontacted civilization that has now signaled its advancement via nuclear weapons, implying an 'India'-like overseer civilization may be monitoring or responding.
-
Key Data Points (📊):
- 1945 nuclear detonation — cited as the moment UAP activity became tied to nukes
- Italy's quantum theory proficiency — mentioned as another potential signal of advanced capability
- North Sentinel Island analogy — uncontacted tribe unaware of India's protective watch
- Claim: nukes signal advancement enough that the next step is 'propulsion' and leaving the planet
- Claim: 'we are an uncontacted people' — humanity's status relative to potential advanced civilizations -
Technical Levels & Setups OR Macro Drivers (📌):
- Nuclear weapons detonations (historical) are the hypothesized trigger for UAP interest
- Humanity's technological leap (quantum theory, nuclear capability) as the catalyst for potential contact
- Paternalistic 'India' role — a larger civilization monitoring but not interfering unless certain signals are emitted -
Risk/Reward Framework (⚖️):
- Entry: Not established by the available evidence.
- Stop: Not established by the available evidence.
- Targets: Not established by the available evidence.
- Risk/Reward: Not established by the available evidence.
- Position Size: Not established by the available evidence.
- Probability: Not established by the available evidence. -
Scenario Analysis (🔄):
| Scenario | Probability | Target | Trigger |
|---|---|---|---|
| Bull | Not established by the available evidence. | Not established by the available evidence. | If UAPs are confirmed to respond to nuclear detonations, humanity may learn from a more advanced civilization. |
| Base | Not established by the available evidence. | Not established by the available evidence. | Continued observation without direct contact, as per the North Sentinel analogy. |
| Bear | Not established by the available evidence. | Not established by the available evidence. | If nuclear escalation leads to a 'North Sentinel' style intervention or destruction, given the lack of understanding of the overseer's intent. | -
Risk Factors (⚠️):
- The claim is speculative and not backed by verifiable evidence of UAP behavior
- No concrete data on nuclear-UAP correlation is provided
- The analogy may be logically flawed; 'India' may not exist or may have different motives
- Potential for misinterpretation of historical events (e.g., Italy quantum theory link is unexplained) -
Actionable Trading/Allocation Plan (🎯):
- Monitor declassified UAP reports for any correlation with nuclear test dates, especially post-1945
- Verify historical cases where UAPs were observed near nuclear facilities (e.g., Malmstrom AFB) — not referenced in evidence
- Compare the North Sentinel Island analogy with actual policy, but verify whether any official 'paternalistic' stance exists regarding UAPs
- Track public statements from governments on UAP origins and nuclear-related incidents

-
Creator Horizon Category (⏱️): Long-Horizon Macro — Creator frames the issue as a structural fiscal solvency risk affecting the long end of the curve.
-
One-Line Thesis (💡): Creator argues the Fed cannot meaningfully affect long-term yields because the US has a fundamental fiscal spending problem, with $10T of debt refinancing and a ~$2T deficit driving higher long-end borrowing costs.
-
Key Data Points (📊):
- $10 trillion of US federal debt refinancing due over the next 12 months
- $40 trillion of US federal government debt outstanding
- Average cost of federal debt at 3.4%
- 30-year Treasury yield at 5.2%
- Fiscal deficit ~$2 trillion for this year
- For every 1% change in interest rate, excess interest cost equals 1.25% of GDP per year -
Technical Levels & Setups OR Macro Drivers (📌):
- Persistent inflation from excess government spending on social programs
- Market pricing a higher risk of US fiscal insolvency
- Federal government's high borrowing cost rising due to debt refinancing -
Risk/Reward Framework (⚖️):
- Entry: Not established by the available evidence.
- Stop: Not established by the available evidence.
- Targets: Not established by the available evidence.
- Risk/Reward: Not established by the available evidence.
- Position Size: Not established by the available evidence.
- Probability: Not established by the available evidence. -
Scenario Analysis (🔄):
| Scenario | Probability | Target | Trigger |
|---|---|---|---|
| Base | Not established by the available evidence. | Not established by the available evidence. | US must refinance $10T debt at higher rates; 30-year at 5.2% |
| Bear | Not established by the available evidence. | Not established by the available evidence. | Aggressive federal spending cuts aimed at reducing deficit trigger recession and unemployment | -
Risk Factors (⚠️):
- Missing verification: no specific Fed policy actions discussed by creator
- Missing verification: no breakdown of fiscal deficit components
- Missing verification: no historical context on long-end yield reactions -
Actionable Trading/Allocation Plan (🎯):
- Monitor US 30-year Treasury yield for 5.2% level and any fiscal policy announcements
- Track federal deficit data to confirm ~$2 trillion figure
- Watch for Fed statements on long-end yield control or quantitative easing
-
Creator Horizon Category (⏱️): Short-Term Technical — The video is a live pre-market technical analysis session for futures and options traders, focused on the imminent trading day.
-
One-Line Thesis (💡): The creator claims the week is starting with an 'UGLY' market open and that overnight selling has been 'Supported So Far', indicating a bearish short-term bias for the session.
-
Key Data Points (📊):
- An UGLY Start To The Week — creator's characterization of the market's expected open.
- Overnight Selling Supported So Far — claim that selling pressure persisted through overnight trading.
- Pre market technical analysis for futures traders and options traders — stated focus of the live stream.
- Live every trading day at 8:00 AM EST — schedule of the broadcast. -
Technical Levels & Setups OR Macro Drivers (📌):
- Overnight selling as a stated driver for bearish sentiment.
- Technical analysis framework as the setup methodology for futures/options. -
Risk/Reward Framework (⚖️):
- Entry: Not established by the available evidence.
- Stop: Not established by the available evidence.
- Targets: Not established by the available evidence.
- Risk/Reward: Not established by the available evidence.
- Position Size: Not established by the available evidence.
- Probability: Not established by the available evidence. -
Scenario Analysis (🔄):
| Scenario | Probability | Target | Trigger |
|---|---|---|---|
| Unavailable | Not established by the available evidence. | Not established by the available evidence. | Verify source evidence. | -
Risk Factors (⚠️):
- Evidence is metadata-only; no specific levels, entry, stop, or targets are provided.
- The claim of 'overnight selling' is unverified without market data for the publication date.
- Disclaimer states information is for informational purposes only and not financial advice. -
Actionable Trading/Allocation Plan (🎯):
- Verify the claim of overnight selling by checking market futures data for the publication timestamp.
- Watch the full video to extract any specific technical levels, support/resistance, or trade setups.
- Review the creator's technical analysis course materials to understand the methodology used.
-
Creator Horizon Category (⏱️): Long-Horizon Macro — Topics include Treasury bond buybacks and real government debt risk, indicating a structural macro focus over a long horizon.
-
One-Line Thesis (💡): The video's headline claim is that the U.S. government has a new plan to push interest rates down via Treasury bond buybacks, with additional discussion of Druckenmiller's op-ed, government debt risk, Bitcoin, private market fraud, and housing/transportation costs.
-
Key Data Points (📊):
- The Government’s New Plan to Push Rates Down — headline claim of the episode
- Episode 479 — episode number
- Michael Batnick and Ben Carlson — hosts of The Compound
- Treasury bond buybacks — central topic described as the government's plan to push rates down
- Stanley Druckenmiller's op-ed — discussed topic
- Real government debt risk — discussed topic
- Most hated asset class in the world — discussed topic
- Why Bitcoin woke up — discussed topic
- End of the Go-Go years — discussed topic
- Finance bros are having a moment — discussed topic
- Private market fraud — discussed topic
- High cost of housing and transportation — discussed topic
- Jean-Claude Van Damme — mentioned in episode description -
Technical Levels & Setups OR Macro Drivers (📌):
- Treasury bond buybacks — presented as the government's mechanism to push rates down
- Druckenmiller's op-ed — discussed as a perspective on government debt risk
- Bitcoin's awakening — discussed as a market development
- Private market fraud — discussed as a risk topic
- Housing and transportation costs — discussed as economic stress factors -
Risk/Reward Framework (⚖️):
- Entry: Not established by the available evidence.
- Stop: Not established by the available evidence.
- Targets: Not established by the available evidence.
- Risk/Reward: Not established by the available evidence.
- Position Size: Not established by the available evidence.
- Probability: Not established by the available evidence. -
Scenario Analysis (🔄):
| Scenario | Probability | Target | Trigger |
|---|---|---|---|
| Unavailable | Not established by the available evidence. | Not established by the available evidence. | Verify source evidence. | -
Risk Factors (⚠️):
- Metadata-only evidence contains no specific numbers, policy details, or market levels; all claims are unverified.
- Actual video content not examined; title and description may not fully capture hosts' nuanced views.
- Treasury bond buybacks may not actually push rates down as implied; outcome depends on implementation and market response. -
Actionable Trading/Allocation Plan (🎯):
- Verify the specifics of the Treasury buyback plan from the episode or official Treasury/Fed announcements.
- Read Stanley Druckenmiller's op-ed to understand the debt risk argument.
- Monitor market reactions to any announced government bond buyback program.
- Review the video for context on Bitcoin's move and private market fraud cases.
-
Creator Horizon Category (⏱️): Long-Horizon Macro / Structural — Video presents a conceptual negotiation framework (theory of the pie) applicable to deal structures rather than a market timing signal.
-
One-Line Thesis (💡): Daylian Cain, via Nalebuff's theory of the pie, argues that a deal's true value is the unique synergy only both parties create together, and while market power shrinks that pie, it does not inherently award the stronger party a larger slice—so even the weaker side can claim half.
-
Key Data Points (📊):
- Theory of the pie: a deal's real value is the unique synergy two sides cannot create without each other
- Market power shrinks that pie, but doesn't hand the stronger party a bigger slice
- Even the smaller player can fight for half
- Framing for allocators negotiating fees, terms, or a co-investment with a larger counterpart -
Technical Levels & Setups OR Macro Drivers (📌):
- Framework for allocator negotiations with larger counterparties—fees, terms, co-investment
- Concept that synergy, not market power, defines the negotiable surplus -
Risk/Reward Framework (⚖️):
- Entry: Not established by the available evidence.
- Stop: Not established by the available evidence.
- Targets: Not established by the available evidence.
- Risk/Reward: Not established by the available evidence.
- Position Size: Not established by the available evidence.
- Probability: Not established by the available evidence. -
Scenario Analysis (🔄):
| Scenario | Probability | Target | Trigger |
|---|---|---|---|
| Bull | Not established by the available evidence. | Not established by the available evidence. | Evidence that a negotiator used the theory to achieve a half split against a more powerful counterpart. |
| Base | Not established by the available evidence. | Not established by the available evidence. | Full episode text confirms the theory's core premise that deal value is the unique synergy. |
| Bear | Not established by the available evidence. | Not established by the available evidence. | Evidence illustrating a case where market power reduced overall deal value, shrinking the pie for the smaller party. | -
Risk Factors (⚠️):
- No transcript provided; unverified exact quotes or nuances from the clip
- Framework may oversimplify negotiating dynamics absent full episode context -
Actionable Trading/Allocation Plan (🎯):
- Listen to the full episode to verify Cain's examples and practical applications
- Review Nalebuff's original theory of the pie for a deeper evidence base

-
Creator Horizon Category (⏱️): Long-Horizon Macro — The video examines the multi-year sustainability of the AI capex cycle and its macro implications.
-
One-Line Thesis (💡): The video presents the ultra-bear case for an AI boom collapse, questioning whether AI demand can justify the massive hyperscaler CapEx boom and the data center buildout.
-
Key Data Points (📊):
- Nvidia's explosive growth — cited as a core driver under scrutiny for sustainability.
- economics of OpenAI and Anthropic — discussed as potential weaknesses in AI business models.
- hyperscaler CapEx boom — questioned whether AI demand can justify it.
- data center buildout — identified as a major investment with potential for overcapacity.
- CoreWeave and the neoclouds — mentioned as key players in AI infrastructure debt financing.
- Oracle's AI bet — assessed as a high-stakes exposure.
- private credit and debt financing — flagged as a risk factor in the AI spending cycle.
- rot economy — term used to describe potential underlying economic weakness.
- AI improving corporate productivity — questioned as uncertain. -
Technical Levels & Setups OR Macro Drivers (📌):
- Massive hyperscaler CapEx boom — a setup for potential overinvestment.
- Data center buildout — a driver of AI infrastructure spending that could see a pullback.
- Private credit and debt financing — a setup for financial stress if defaults rise.
- Nvidia's explosive growth — a driver that may be unsustainable. -
Risk/Reward Framework (⚖️):
- Entry: Not established by the available evidence.
- Stop: Not established by the available evidence.
- Targets: Not established by the available evidence.
- Risk/Reward: Not established by the available evidence.
- Position Size: Not established by the available evidence.
- Probability: Not established by the available evidence. -
Scenario Analysis (🔄):
| Scenario | Probability | Target | Trigger |
|---|---|---|---|
| Bull | Not established by the available evidence. | Not established by the available evidence. | AI is actually improving corporate productivity. |
| Base | Not established by the available evidence. | Not established by the available evidence. | Assessment of whether AI demand can justify hyperscaler CapEx. |
| Bear | Not established by the available evidence. | Not established by the available evidence. | Warning signs that could finally break the AI spending cycle. | -
Risk Factors (⚠️):
- No quantitative data in evidence; all claims are qualitative and unverified.
- Potential conflicts: The Compound is affiliated with Ritholtz Wealth Management; hosts may hold positions in securities discussed.
- The description is metadata only; no actual financial figures, prices, or probabilities are provided. -
Actionable Trading/Allocation Plan (🎯):
- Monitor Nvidia's quarterly earnings and guidance for signs of growth deceleration.
- Track OpenAI and Anthropic revenue/cost disclosures or funding rounds for economic viability.
- Follow hyperscaler (Microsoft, Google, Amazon) CapEx announcements for changes in AI spending.
- Watch CoreWeave and other neoclouds' debt financing terms and default risk.
- Evaluate Oracle's AI-related earnings and forward guidance.

-
Creator Horizon Category (⏱️): Long-Horizon Macro / Structural — The creator asserts a product will become the best-selling of all time, implying a multi-year, transformative commercial trajectory.
-
One-Line Thesis (💡): The All-In Podcast claims, based on a private Optimus video shown by Elon Musk, that Optimus is making 'sick progress' and will become the best-selling product of all time, implying massive upside for Tesla's robotics franchise.
-
Key Data Points (📊):
- "Optimus will be the best-selling product of all time" — creator's headline product claim
- "It would win half of these things already" — creator's partial competitive assertion (context unspecified)
- "He's making sick progress" — creator's progress claim for Optimus
- "Is this CGI or is this real?" "This is real" — creator's authenticity confirmation from Elon
- "They just sent it to me this morning" — timing of the private video -
Technical Levels & Setups OR Macro Drivers (📌):
- Private Optimus video showing real, non-CGI progress as a catalyst for Tesla's robotics narrative
- Elon Musk's public non-disclosure of the video — scarcity drives speculative interest
- Creator's statement that Optimus would 'win half of these things' implies competitive dominance in an unspecified arena -
Risk/Reward Framework (⚖️):
- Entry: Not established by the available evidence.
- Stop: Not established by the available evidence.
- Targets: Not established by the available evidence.
- Risk/Reward: Not established by the available evidence.
- Position Size: Not established by the available evidence.
- Probability: Not established by the available evidence. -
Scenario Analysis (🔄):
| Scenario | Probability | Target | Trigger |
|---|---|---|---|
| Bull | Not established by the available evidence. | Not established by the available evidence. | Elon Musk or Tesla publicly releases the Optimus video, confirming the claimed real progress and generating widespread adoption signals. |
| Base | Not established by the available evidence. | Not established by the available evidence. | The private video remains private; speculative interest persists with no public confirmation or denial. |
| Bear | Not established by the available evidence. | Not established by the available evidence. | The video is later revealed to be CGI or materially exaggerated, discrediting the creator's and Elon's authenticity claims. | -
Risk Factors (⚠️):
- Unverified evidence: the video is private and only the creator's report is available — no independent confirmation
- Potential for CGI or staged footage, despite Elon's claim of 'real'
- Ambiguous statement 'it would win half of these things' lacks defined benchmark or context
- No financial data (revenue, pricing, volume) provided to substantiate the 'best-selling' claim -
Actionable Trading/Allocation Plan (🎯):
- Monitor Tesla's official channels and Elon Musk's social media for public release of the Optimus video described in the podcast
- Compare any publicly released video against the creator's description of 'sick progress' and 'real' authenticity
- Track Tesla's robotics-related presentations or earnings calls for formal productization timelines and sales projections


-
Creator Horizon Category (⏱️): Long-Horizon Macro / Structural — The video title implies a broad systemic critique of government spending, suggesting a structural viewpoint, but no time horizon is specified in the metadata.
-
One-Line Thesis (💡): The video's title claims that government spending ruins everything it touches, featuring David Friedberg, but the metadata provides no supporting data or analysis.
-
Key Data Points (📊):
- Title: 'David Friedberg: Government Spending Ruins Everything it Touches' — headline claim -
Technical Levels & Setups OR Macro Drivers (📌):
- Not established by the available evidence. -
Risk/Reward Framework (⚖️):
- Entry: Not established by the available evidence.
- Stop: Not established by the available evidence.
- Targets: Not established by the available evidence.
- Risk/Reward: Not established by the available evidence.
- Position Size: Not established by the available evidence.
- Probability: Not established by the available evidence. -
Scenario Analysis (🔄):
| Scenario | Probability | Target | Trigger |
|---|---|---|---|
| Unavailable | Not established by the available evidence. | Not established by the available evidence. | Verify source evidence. | -
Risk Factors (⚠️):
- No specific claims or data provided in metadata; video content unverified -
Actionable Trading/Allocation Plan (🎯):
- Access the source URL to review full video content
- Monitor the video transcript for specific claims about government spending

-
Creator Horizon Category (⏱️): Long-Horizon Macro / Structural — Video frames AI-driven compute scarcity and time compression as the dominant forces reshaping finance and debt, with long-horizon implications.
-
One-Line Thesis (💡): Jordi Visser argues that AI's compute scarcity and time compression, not inflation expectations, are driving the bid for capital and forcing finance onto programmable rails, making gold a laggard while Bitcoin and tokenized assets benefit.
-
Key Data Points (📊):
- Market cap to GDP at 240-250%, heading toward 300%
- Nominal GDP at 6.5% and climbing; ten-year yields arguably belong above 8%
- Hyperscaler issuance is 9% of all IG supply, doubled in a year
- Warsh's Jackson Hole comments moved hike odds from 35% to 60%
- Solana ran 46% month-to-date; tokenized index broke out
- Bitcoin's 200-day slope turned up after 100+ days pointing down; fourth such instance, prior lows held in every case
- Nvidia next-year growth guided to 70% vs 44% expectations; multiple compressing
- Breadth weak: 29% of stocks above 50-day
- Broadcom $70 billion deal; single-name CDS widening
- Dollar/yen weakens to 160
- Druckenmiller op-ed framed as attack on Bessent but really about decades of spending in old aging system
- OpenAI and Anthropic treated as having already won because highest margins buy most compute
- Japan and Korea moving on tokenization; Stripe buying toward it
- Tom Lee on agents needing smart contracts; Ethereum as settlement layer, Solana as 24/7 market speed, Bitcoin as protection against time debasement
- AI capex $11 trillion shock (Dylan Patel and Dwarkesh Patel framing) but Visser disagrees on debt destruction and startup scaling -
Technical Levels & Setups OR Macro Drivers (📌):
- Yield suppression pattern: yen intervention, refunding language changes, buyback framework, larger buybacks, possible TGA tapping
- Steno Larsen on repo and pushing debt to front end; basis trade and stablecoins as engineered demand for long-term Treasuries
- AI compresses scientific/technological time; assets become software via tokenization
- Compute scarcity prevents commoditization; OpenAI/Anthropic outbid for compute, reinforcing concentration
- Hyperscaler debt issuance crowds out Treasury demand
- Breadth weak even as Nvidia beats; index CDX not confirming single-name widening, reminiscent of equity vol vs index vol
- Warsh not raising in September despite hawkish stance; long end pressing and Treasury working other side
- Bitcoin 200-day slope turning up historically bullish signal
- Agentic tooling adoption and startups scaling without debt/headcount due to AI
- Gold questioned all week but Visser sees faster horses in crypto/AI -
Risk/Reward Framework (⚖️):
- Entry: Not established by the available evidence.
- Stop: Not established by the available evidence.
- Targets: Not established by the available evidence.
- Risk/Reward: Not established by the available evidence.
- Position Size: Not established by the available evidence.
- Probability: Not established by the available evidence. -
Scenario Analysis (🔄):
| Scenario | Probability | Target | Trigger |
|---|---|---|---|
| Bull | Not established by the available evidence. | Not established by the available evidence. | Bitcoin 200-day slope turns up (after 100+ days down, fourth instance) and prior lows held; tokenized index broke out; Solana up 46% M/TD; AI build-out continues with hyperscaler issuance and Nvidia guidance 70% |
| Base | Not established by the available evidence. | Not established by the available evidence. | Yield suppression continues via interventions (yen, buybacks, TGA) while long end stays elevated; AI capex grows but credit concentration remains unconfirmed by index CDX |
| Bear | Not established by the available evidence. | Not established by the available evidence. | Long end backs up further (ten-year yields toward 8%+) forcing policy error; Warsh unexpectedly raises in September; crowding out intensifies without AI revenues arriving in time; dollar/yen at 160 destabilizes markets | -
Risk Factors (⚠️):
- Creator claims scarce compute does not commoditize; open source is not discussed as competition, leaving a plausible contrarian risk
- AI debt destruction may be slower than claimed; $11 trillion capex shock could trigger systemic stress
- Yield suppression may not hold; ten-year at 8%+ could invalidate the constructive crypto thesis
- Credit concentration (Broadcom CDS widening) not confirmed by IG index, perhaps because index lags
- Breadth weak (29% above 50-day) suggests market fragility despite Nvidia strength
- Tokenization adoption (Japan/Korea, Stripe) is cited but not verified with specific transactions or dates -
Actionable Trading/Allocation Plan (🎯):
- Monitor Treasury yield curve and ten-year yields against 8% level; track Fed intervention tools (yen, TGA, buybacks)
- Watch hyperscaler IG issuance share weekly for continuation of 9% and doubling trend
- Track Bitcoin 200-day slope and prior low levels for confirmation of historical pattern
- Verify tokenization progress in Japan/Korea and Stripe acquisition details
- Follow Nvidia guidance and compute pricing to test the 'compute scarcity' thesis
- Check CDX versus single-name credit spreads for convergence or divergence
- Monitor Solana and tokenized index performance for breakout sustainability

-
Creator Horizon Category (⏱️): Long-Horizon Macro / Structural — The claim of a 'death spiral' implies a structural deterioration rather than a short-term trading setup; no timeframe is provided.
-
One-Line Thesis (💡): The video's title attributes to Chamath the claim that 'this' could be the beginning of a death spiral, but the metadata gives no subject, asset, or context to assess the claim.
-
Key Data Points (📊):
- 'This could be the beginning of a death spiral.' — Chamath (quoted in video title)
- Hashtags: #allin, #tech, #news — indicates focus on technology news -
Technical Levels & Setups OR Macro Drivers (📌):
- Not established by the available evidence. -
Risk/Reward Framework (⚖️):
- Entry: Not established by the available evidence.
- Stop: Not established by the available evidence.
- Targets: Not established by the available evidence.
- Risk/Reward: Not established by the available evidence.
- Position Size: Not established by the available evidence.
- Probability: Not established by the available evidence. -
Scenario Analysis (🔄):
| Scenario | Probability | Target | Trigger |
|---|---|---|---|
| Unavailable | Not established by the available evidence. | Not established by the available evidence. | Verify source evidence. | -
Risk Factors (⚠️):
- The specific subject of the 'death spiral' claim is unstated, making verification impossible.
- No supporting data, levels, or dates are provided in the available metadata. -
Actionable Trading/Allocation Plan (🎯):
- Watch the full video to identify the specific asset or sector referenced by Chamath.
- Cross-reference the video's claims with current market data on the named entity once identified.
-
Creator Horizon Category (⏱️): Short-Term Technical — The video's chapters focus on technical analysis of SPY, QQQ, IWM, and S&P sectors, with a headline question about a potential top after the Jackson Hole event.
-
One-Line Thesis (💡): The creator asks whether the Jackson Hole event marked a top in major equity indices, analyzing SPY, QQQ, IWM, S&P sectors, and a core list of stocks using fundamental and technical evidence.
-
Key Data Points (📊):
- Headline question: 'Did Jackson Hole Mark The Top?!'
- Indices analyzed: SPY (S&P 500), QQQ (NASDAQ 100), IWM (Russell 2000)
- S&P sector analysis included
- Core list tickers: NVDA, AAPL, MSFT, AMZN, GOOGL, AVGO, META, MU, TSLA, JPM, AMD, INTC
- Trade ideas: CRWD, NET, FIG, FROG
- Segments: Fundamental Evidence and Technical Evidence -
Technical Levels & Setups OR Macro Drivers (📌):
- Jackson Hole event as a potential market top catalyst
- Fundamental evidence section to gauge macro/earnings support
- Technical evidence section to identify price action signals
- S&P sector rotation analysis
- Trade ideas list for specific setups in CRWD, NET, FIG, FROG -
Risk/Reward Framework (⚖️):
- Entry: Not established by the available evidence.
- Stop: Not established by the available evidence.
- Targets: Not established by the available evidence.
- Risk/Reward: Not established by the available evidence.
- Position Size: Not established by the available evidence.
- Probability: Not established by the available evidence. -
Scenario Analysis (🔄):
| Scenario | Probability | Target | Trigger |
|---|---|---|---|
| Unavailable | Not established by the available evidence. | Not established by the available evidence. | Verify source evidence. | -
Risk Factors (⚠️):
- No specific price levels, stops, or targets are provided in the available metadata.
- Actual video content (including analysis and conclusions) is not accessible in the evidence.
- The headline question implies potential downside, but no invalidation conditions are stated. -
Actionable Trading/Allocation Plan (🎯):
- Review the video's Fundamental and Technical Evidence sections to understand the basis for the top question.
- Monitor the listed indices (SPY, QQQ, IWM) and core list tickers for confirmation or rejection of a top.
- Track the trade ideas (CRWD, NET, FIG, FROG) for any explicit entry, stop, or target signals in the video.
- Cross-reference the Jackson Hole event outcome with market response to verify the top hypothesis.

-
Creator Horizon Category (⏱️): Long-Horizon Macro / Structural — The video title frames a long-lasting comparative advantage in AI between China and America, not a short-term trade setup.
-
One-Line Thesis (💡): David Sacks claims China’s biggest AI advantage over America is optimism, implying a psychological or cultural edge rather than a purely technological/financial one.
-
Key Data Points (📊):
- "China’s Biggest AI Advantage Over America Is Optimism" — headline claim in video title
- Speaker: David Sacks, via All-In Podcast — attributed in title -
Technical Levels & Setups OR Macro Drivers (📌):
- Creator claim: China's AI advantage is driven by optimism — no further evidence, data, or context provided in metadata -
Risk/Reward Framework (⚖️):
- Entry: Not established by the available evidence.
- Stop: Not established by the available evidence.
- Targets: Not established by the available evidence.
- Risk/Reward: Not established by the available evidence.
- Position Size: Not established by the available evidence.
- Probability: Not established by the available evidence. -
Scenario Analysis (🔄):
| Scenario | Probability | Target | Trigger |
|---|---|---|---|
| Bull | Not established by the available evidence. | Not established by the available evidence. | No evidence-based trigger available in metadata — only title, no transcript |
| Base | Not established by the available evidence. | Not established by the available evidence. | No evidence-based trigger available in metadata — only title, no transcript |
| Bear | Not established by the available evidence. | Not established by the available evidence. | No evidence-based trigger available in metadata — only title, no transcript | -
Risk Factors (⚠️):
- No transcript or detailed claims in EVIDENCE — title alone may be clickbait or out of context
- Missing verification of what "optimism" means operationally (policy, funding, sentiment, etc.)
- No specific data, metrics, or comparisons provided to test the claim -
Actionable Trading/Allocation Plan (🎯):
- Locate the video transcript or timestamps to extract Sacks' full argument and any supporting data
- Compare this claim against known AI indicators (patents, funding, talent, policy) for China vs. US
- Monitor All-In Podcast subsequent episodes for follow-up quantification or rebuttals

-
Creator Horizon Category (⏱️): Short-Term Technical — Video focuses on immediate market reaction to NVDA earnings and Warsh rate-hike comments, with an 'indecision markets' framing.
-
One-Line Thesis (💡): The creator is 'Awaiting Market Conviction', driven by NVDA earnings reaction, Warsh comments that increase rate-hike probabilities, and a standout bull case in the software sector.
-
Key Data Points (📊):
- Title 'Awaiting Market Conviction' — central theme of indecision
- NVDA earnings reaction — cited as a key market catalyst
- Warsh comments increase rate hike probabilities — macro factor
- Software Sector Bulls Stand Out — sector-level strength -
Technical Levels & Setups OR Macro Drivers (📌):
- NVDA earnings reaction as immediate driver
- Warsh comments shifting rate-hike expectations
- Software sector bullish positioning amid overall market indecision
- Approach for trading indecision markets (methodology mention) -
Risk/Reward Framework (⚖️):
- Entry: Not established by the available evidence.
- Stop: Not established by the available evidence.
- Targets: Not established by the available evidence.
- Risk/Reward: Not established by the available evidence.
- Position Size: Not established by the available evidence.
- Probability: Not established by the available evidence. -
Scenario Analysis (🔄):
| Scenario | Probability | Target | Trigger |
|---|---|---|---|
| Bull | Not established by the available evidence. | Not established by the available evidence. | Software sector bulls stand out; continuation of that strength would support upside. |
| Base | Not established by the available evidence. | Not established by the available evidence. | Awaiting market conviction — indecision persists with no clear directional catalyst. |
| Bear | Not established by the available evidence. | Not established by the available evidence. | Warsh comments increase rate hike probabilities, implying a potential negative catalyst. | -
Risk Factors (⚠️):
- No specific price levels, stops, or targets are provided in the evidence.
- The creator's claims are qualitative; verification of NVDA earnings details and Warsh comments is needed.
- Rate-hike probability shift may be overstated or not materialize as expected. -
Actionable Trading/Allocation Plan (🎯):
- Monitor NVDA earnings reaction for market direction confirmation.
- Track Warsh commentary and its impact on Fed rate-hike probabilities.
- Observe software sector relative strength for bullish signal.
- Review the creator's methodology for navigating indecision markets as described in the video.

-
Creator Horizon Category (⏱️): Long-Horizon Macro — Video covers America's debt crisis and bond market intervention, which are long-horizon macro factors, alongside immediate earnings reactions.
-
One-Line Thesis (💡): All-In Podcast claims Nvidia's and Salesforce's strong earnings reversed the AI capex bubble and SaaSpocalypse narratives, while highlighting tensions between Treasury Secretary Bessent and investor Druckenmiller over bond market interference amid America's debt crisis.
-
Key Data Points (📊):
- Nvidia's Historic Quarter — headline claim
- SaaS Comeback — headline claim
- AI Capex Bubble and SaaSpocalypse narratives get reversed — claim from segment description
- Bessent gets called out by Druckenmiller for bond market interference — claim
- America's Debt Crisis — headline topic
- Moderna's mRNA cancer vaccine — science corner topic
- $1 trillion Treasury general account bond buybacks — from linked CNBC article title
- Polymarket event: largest company end of December 2026 — referenced
- Polymarket event: Russia x Ukraine ceasefire agreement by — referenced -
Technical Levels & Setups OR Macro Drivers (📌):
- Nvidia and Salesforce ripping after big earnings — from description
- AI Capex Bubble and SaaSpocalypse narratives reversed — from description
- Bessent's bond market interference and Druckenmiller's callout — from description
- America's debt crisis — from title
- Moderna's mRNA cancer vaccine development — from description -
Risk/Reward Framework (⚖️):
- Entry: Not established by the available evidence.
- Stop: Not established by the available evidence.
- Targets: Not established by the available evidence.
- Risk/Reward: Not established by the available evidence.
- Position Size: Not established by the available evidence.
- Probability: Not established by the available evidence. -
Scenario Analysis (🔄):
| Scenario | Probability | Target | Trigger |
|---|---|---|---|
| Bull | Not established by the available evidence. | Not established by the available evidence. | AI Capex Bubble and SaaSpocalypse narratives get reversed |
| Bear | Not established by the available evidence. | Not established by the available evidence. | Bessent gets called out by Druckenmiller for bond market interference | -
Risk Factors (⚠️):
- No specific financial figures provided in the evidence, limiting quantitative verification.
- Debt crisis severity is not quantified.
- Earnings details are only headline-level; underlying numbers are not in the description.
- Bond market intervention details are not fully explained. -
Actionable Trading/Allocation Plan (🎯):
- Monitor Nvidia and Salesforce price action following earnings to see if the rally holds.
- Verify Bessent's $1 trillion Treasury buyback details from the CNBC article.
- Follow US Treasury yields for bond market reaction to Bessent's policies.
- Track Polymarket events on largest company and Ukraine ceasefire for market expectations.
- Review Moderna's mRNA cancer vaccine development progress.

-
Creator Horizon Category (⏱️): Long-Horizon Macro / Structural — The discussion focuses on the structural economics of AI token pricing and customer treatment, not on short-term price action or long-horizon macro.
-
One-Line Thesis (💡): The creator argues Microsoft's decision to change GitHub Copilot pricing after 2 million customers is an 'insane way to run a business' because the economics of $5,000 of tokens for $40 are unsustainable and token costs have not decreased as Microsoft expected.
-
Key Data Points (📊):
- 2 million customers — GitHub Copilot customer count cited by creator
- June 1st — date Microsoft made the pricing change per creator
- $5,000 of tokens for $40 — creator's characterization of the pricing mismatch
- Cost of intelligence has come down but models spend more tokens — creator's explanation for the pricing pressure -
Technical Levels & Setups OR Macro Drivers (📌):
- Microsoft's pricing change for GitHub Copilot
- Token burn rates exceeding subscription price
- Creator's claim that token costs have never gotten cheaper -
Risk/Reward Framework (⚖️):
- Entry: Not established by the available evidence.
- Stop: Not established by the available evidence.
- Targets: Not established by the available evidence.
- Risk/Reward: Not established by the available evidence.
- Position Size: Not established by the available evidence.
- Probability: Not established by the available evidence. -
Scenario Analysis (🔄):
| Scenario | Probability | Target | Trigger |
|---|---|---|---|
| Unavailable | Not established by the available evidence. | Not established by the available evidence. | Verify source evidence. | -
Risk Factors (⚠️):
- Verification gap: the transcript does not specify the exact new pricing or customer options.
- Analyst risk: the creator's claim that 'nothing has got cheaper' is a broad assertion unsupported by data in the evidence. -
Actionable Trading/Allocation Plan (🎯):
- Monitor GitHub Copilot official pricing announcements and any follow-up changes.
- Check historical token pricing and usage metrics to verify the $5,000 vs $40 claim.
- Track customer and developer reactions to the June 1st change.

-
Creator Horizon Category (⏱️): Long-Horizon Macro / Structural — The video title 'The Bear Case for AI' indicates a fundamental, long-term critique of artificial intelligence as a market theme.
-
One-Line Thesis (💡): The Compound's TCAF episode 257 presents a bear case for artificial intelligence, per the video title 'The Bear Case for AI'.
-
Key Data Points (📊):
- Video title: 'The Bear Case for AI' — signals a bearish thesis on AI
- Episode number: TCAF EP 257 — identifies the podcast episode
- Channel: The Compound — publisher of the content
- Platform: YouTube — source of the evidence (URL provided) -
Technical Levels & Setups OR Macro Drivers (📌):
- Not established by the available evidence. -
Risk/Reward Framework (⚖️):
- Entry: Not established by the available evidence.
- Stop: Not established by the available evidence.
- Targets: Not established by the available evidence.
- Risk/Reward: Not established by the available evidence.
- Position Size: Not established by the available evidence.
- Probability: Not established by the available evidence. -
Scenario Analysis (🔄):
| Scenario | Probability | Target | Trigger |
|---|---|---|---|
| Unavailable | Not established by the available evidence. | Not established by the available evidence. | Verify source evidence. | -
Risk Factors (⚠️):
- The full video content is absent from the metadata, so the specific bear case arguments, data, and any invalidation conditions are unverifiable.
- The title alone does not provide any tickers, valuations, or price levels to assess.
- The video may rely on qualitative or speculative claims without quantitative support. -
Actionable Trading/Allocation Plan (🎯):
- Access the full video to extract the specific bear case arguments, any cited data, and mentioned companies or sectors.
- Cross-reference the episode with The Compound's subsequent content or show notes for additional context or rebuttals.
- Monitor AI-related market indices or leading AI-exposed equities for correlation with the video's release date.
-
Creator Horizon Category (⏱️): Short-Term Technical — Live pre-market technical analysis session focused on the Jackson Hole event and its immediate market impact.
-
One-Line Thesis (💡): The video headline frames Kevin Warsh's Jackson Hole speech as a binary catalyst that could either crash or save markets, presented as a live pre-market technical analysis prep for futures and options traders.
-
Key Data Points (📊):
- Jackson Hole symposium — named as the macro event of focus in the title
- Kevin Warsh — Fed official whose speech is posed as a market-crash-or-save trigger
- Pre-market prep — live format, scheduled 8:00 AM EST
- Technical analysis — stated intended method for futures and options traders
- Trade Brigade — creator channel, offers course, scripts, newsletter, Discord, and TradeZella discount -
Technical Levels & Setups OR Macro Drivers (📌):
- Jackson Hole economic symposium — scheduled macro catalyst
- Kevin Warsh's remarks — binary outcome (crash or save) proposed by the headline
- Pre-market live session — trading-day setup for futures and options -
Risk/Reward Framework (⚖️):
- Entry: Not established by the available evidence.
- Stop: Not established by the available evidence.
- Targets: Not established by the available evidence.
- Risk/Reward: Not established by the available evidence.
- Position Size: Not established by the available evidence.
- Probability: Not established by the available evidence. -
Scenario Analysis (🔄):
| Scenario | Probability | Target | Trigger |
|---|---|---|---|
| Bull | Not established by the available evidence. | Not established by the available evidence. | Creator's premise: Warsh's speech could 'save markets' — verify via the video's live discussion and market reaction to his comments. |
| Bear | Not established by the available evidence. | Not established by the available evidence. | Creator's premise: Warsh's speech could 'crash markets' — verify via the video's live discussion and market reaction to his comments. | -
Risk Factors (⚠️):
- Metadata-only evidence: no actual technical levels, price targets, or position parameters provided.
- The video's core claims are unverified without viewing the full live session.
- Headline uses a binary crash-or-save framing that may oversimplify market reactions.
- No explicit invalidation or risk-management details in the available metadata. -
Actionable Trading/Allocation Plan (🎯):
- Watch the full live session for Warsh's comments and any technical levels referenced.
- Verify the Jackson Hole schedule and Warsh's speaking time as a monitoring checkpoint.
- Review the video's linked technical analysis course and trading scripts for context on the creator's framework.
- Check the free Discord and X feed for real-time market commentary tied to the event.

-
Creator Horizon Category (⏱️): Long-Horizon Macro / Structural — The episode questions whether the massive hyperscaler and AI-infrastructure capex cycle is justified by underlying demand, a long-horizon structural question.
-
One-Line Thesis (💡): The Compound and guest Ed Zitron present the ultra-bear case for AI, arguing that Nvidia's explosive growth and the hyperscaler capex boom, including CoreWeave and Oracle, may be disconnected from real AI economics and corporate productivity gains.
-
Key Data Points (📊):
- Four Horsemen of the AI Apocalypse — title framing for the bear-case catalysts
- Ultra-bear case for AI — stated theme
- Nvidia's explosive growth — focus of first segment
- Economics of OpenAI and Anthropic — discussed as private-company viability test
- Massive hyperscaler CapEx boom — questioned for demand justification
- Data center buildout — part of the infrastructure spending thesis
- CoreWeave and the neoclouds — called out as key lenders/borrowers in the cycle
- Oracle's AI bet — discussed as a specific company exposure
- Private credit and debt financing — identified as fuel for the buildout
- Warning signs that could break the AI spending cycle — explicit risk list
- Rot economy — phrase used to describe potential systemic fragility
- Whether AI is actually improving corporate productivity — key question for validation
- Is there a positive outcome? — segment posing a potential bull path -
Technical Levels & Setups OR Macro Drivers (📌):
- Hyperscaler capex boom — magnitude of planned AI infrastructure spending
- Nvidia's growth — driven by demand for AI accelerators from neoclouds and hyperscalers
- Data center buildout — physical capacity expansion as a sentinel for spending
- CoreWeave and neoclouds — reliance on debt and private credit
- Oracle's AI bet — enterprise cloud/OCI exposure to AI workloads
- Private credit market — financing of AI infrastructure without traditional bank safeguards
- Ed Zitron's bear thesis — focus on potential economic irrationality of AI spending -
Risk/Reward Framework (⚖️):
- Entry: Not established by the available evidence.
- Stop: Not established by the available evidence.
- Targets: Not established by the available evidence.
- Risk/Reward: Not established by the available evidence.
- Position Size: Not established by the available evidence.
- Probability: Not established by the available evidence. -
Scenario Analysis (🔄):
| Scenario | Probability | Target | Trigger |
|---|---|---|---|
| Bear | Not established by the available evidence. | Not established by the available evidence. | Warning signs break the AI spending cycle (explicitly listed as a topic) |
| Base | Not established by the available evidence. | Not established by the available evidence. | Current AI spending and demand continue without clear productivity validation (implied by the questioning of the capex boom) |
| Bull | Not established by the available evidence. | Not established by the available evidence. | AI demand justifies the hyperscaler CapEx boom, and corporate productivity improvements are demonstrated (posed as the 'positive outcome' segment) | -
Risk Factors (⚠️):
- No specific quantitative data in the video metadata, so claims cannot be verified without the actual episode content
- Potential conflicts of interest: hosts are employees of Ritholtz Wealth Management and may hold positions in discussed securities
- The 'rot economy' and warning signs are discussed qualitatively, lacking specific triggers or thresholds
- No disclosure of Ed Zitron's positions or funding sources
- Availability of full transcript or source articles not provided in the metadata -
Actionable Trading/Allocation Plan (🎯):
- Verify Nvidia's revenue and guidance from public earnings releases against the 'explosive growth' narrative
- Monitor hyperscaler capex guidance from Microsoft, Google, Amazon, and Meta for changes or reallocation
- Track CoreWeave's debt issuance and financial health through its reporting and news
- Review Oracle's cloud segment earnings commentary for evidence of AI demand strength
- Investigate private credit participation in AI infrastructure lending (e.g., major funds, terms)
- Look for survey or case-study data on AI-driven corporate productivity changes to test the 'rot economy' hypothesis

-
Creator Horizon Category (⏱️): Short-Term Technical — The metadata describes a daily pre-market livestream focused on intraday sector analysis and trade setups.
-
One-Line Thesis (💡): TheChartGuys claim to provide a live pre-market analysis session that reviews various market sectors and key trade setups ahead of the Aug 31 market open, based on the video title and description.
-
Key Data Points (📊):
- Live Stock Market Analysis - Aug 31 — title indicates the stream targets the Aug 31 trading day.
- Various market sectors — description states the stream analyzes various market sectors.
- Key setups — description says they break down key setups.
- Prep for the trading day — description says they prep for the trading day.
- Public stream — the stream is public, with membership for daily access. -
Technical Levels & Setups OR Macro Drivers (📌):
- Sector analysis as a driver for trade selection — creator states they analyze various market sectors.
- Pre-market setup breakdown — creator claims to break down key setups before market open. -
Risk/Reward Framework (⚖️):
- Entry: Not established by the available evidence.
- Stop: Not established by the available evidence.
- Targets: Not established by the available evidence.
- Risk/Reward: Not established by the available evidence.
- Position Size: Not established by the available evidence.
- Probability: Not established by the available evidence. -
Scenario Analysis (🔄):
| Scenario | Probability | Target | Trigger |
|---|---|---|---|
| Unavailable | Not established by the available evidence. | Not established by the available evidence. | Verify source evidence. | -
Risk Factors (⚠️):
- The available evidence is metadata-only; the actual video content, including tickers, levels, and trade calls, is not verifiable.
- The publication date differs from the title's trading day; the stream may have been recorded live on Aug 31, but the metadata does not confirm. -
Actionable Trading/Allocation Plan (🎯):
- Review the full video to extract any specific sector calls or setups.
- Verify the date of the livestream and whether it corresponds to the Aug 31 market session.
- Check the creator's membership page for additional context on their daily preparation process.

-
Creator Horizon Category (⏱️): Long-Horizon Macro — Discussion of Treasury bond buybacks, government debt risk, and Bitcoin movements indicates a macro-level focus beyond short-term trading.
-
One-Line Thesis (💡): In episode 479 of The Compound, Michael Batnick and Ben Carlson discuss the Treasury bond buybacks, Stanley Druckenmiller's op-ed, real government debt risk, the most hated asset class, Bitcoin's recent move, the end of the Go-Go years, finance bros, private market fraud, housing and transportation costs, and a sponsored wedding theme, without offering specific trade recommendations.
-
Key Data Points (📊):
- Episode 479 of The Compound podcast — hosted by Michael Batnick and Ben Carlson
- Treasury bond buybacks — discussed as a topic
- Stanley Druckenmiller's op-ed — mentioned as a discussion item
- Real government debt risk — claimed as a key topic
- The most hated asset class in the world — discussed
- Bitcoin woke up — referenced to Bitcoin's recent price or sentiment move
- End of the Go-Go years — a market or cultural phase referenced
- Finance bros are having a moment — cultural observation
- Private market fraud — discussed as a risk theme
- High cost of housing and transportation — discussed as economic pressures
- Jean-Claude Van Damme — mentioned in the podcast context
- Title question: 'Would You Want a Sponsored Wedding?' — links to wedding sponsorship theme
- Disclosure: content is not personalized financial advice -
Technical Levels & Setups OR Macro Drivers (📌):
- Treasury bond buybacks — potential central bank or government action affecting rates
- Government debt risk — fiscal sustainability concerns as a macro driver
- Bitcoin's price movement — factor behind the 'woke up' phrasing
- Most hated asset class — sentiment reversal or contrarian opportunity
- Private market fraud — risk to private asset valuations
- Housing and transportation costs — inflation or consumer spending pressures
- End of Go-Go years — shift in market regime or investor behavior -
Risk/Reward Framework (⚖️):
- Entry: Not established by the available evidence.
- Stop: Not established by the available evidence.
- Targets: Not established by the available evidence.
- Risk/Reward: Not established by the available evidence.
- Position Size: Not established by the available evidence.
- Probability: Not established by the available evidence. -
Scenario Analysis (🔄):
| Scenario | Probability | Target | Trigger |
|---|---|---|---|
| Unavailable | Not established by the available evidence. | Not established by the available evidence. | Verify source evidence. | -
Risk Factors (⚠️):
- No specific market calls or trade parameters are stated in the evidence; any application is speculative
- The video description lacks data on Bitcoin direction, debt levels, or bond buyback details
- The Compound's content is informational; the disclaimer notes no personalized advice or solicitation
- Creator claims are unverified and may reflect editorial bias -
Actionable Trading/Allocation Plan (🎯):
- Monitor Treasury bond buyback announcements and their impact on yields
- Read Stanley Druckenmiller's op-ed referenced in the episode for fiscal risk arguments
- Track Bitcoin price and volume to assess the 'woke up' context
- Review government debt metrics and debt-service costs
- Watch for news on private market fraud cases or regulatory actions
- Follow housing and transportation cost indices as inflation inputs
- Verify the episode's full content by listening to the podcast for detailed statements
-
Creator Horizon Category (⏱️): Short-Term Technical — Video is a live pre-market technical analysis session for futures and options traders, focused on NVDA earnings reaction.
-
One-Line Thesis (💡): Creator claims NVDA earnings have saved markets and questions whether the rally will hold, while delivering pre-market technical analysis for futures and options traders.
-
Key Data Points (📊):
- NVDA EARNINGS SAVE MARKETS – headline claim in video title
- Will it hold!? – open question regarding sustainability of the rally
- Live pre-market technical analysis for futures traders and options traders – stated purpose
- Live every trading day at 8:00 AM EST – schedule claim
- 20% off TradeZella (Use 'TB') – promotional offer
- Free Discord and live squawk links – community/resources -
Technical Levels & Setups OR Macro Drivers (📌):
- NVDA earnings as the primary market catalyst
- Pre-market technical analysis for futures and options traders
- Live squawk coverage via tradebrigade.co/live-squawk -
Risk/Reward Framework (⚖️):
- Entry: Not established by the available evidence.
- Stop: Not established by the available evidence.
- Targets: Not established by the available evidence.
- Risk/Reward: Not established by the available evidence.
- Position Size: Not established by the available evidence.
- Probability: Not established by the available evidence. -
Scenario Analysis (🔄):
| Scenario | Probability | Target | Trigger |
|---|---|---|---|
| Unavailable | Not established by the available evidence. | Not established by the available evidence. | Verify source evidence. | -
Risk Factors (⚠️):
- Video content is not captured in metadata; all claims require verification from the actual broadcast.
- No specific price levels, stop losses, or targets are provided in the metadata.
- The 'save markets' claim is unverified and may be hyperbole or based on partial data. -
Actionable Trading/Allocation Plan (🎯):
- Watch the live video to extract NVDA earnings reaction and exact technical levels.
- Check Trade Brigade's live squawk for real-time market context.
- Monitor NVDA price action and index futures to test the 'save markets' claim.

-
Creator Horizon Category (⏱️): Short-Term Technical — The video is described as a midweek market update focused on technical analysis, key support/resistance levels, and options trading setups.
-
One-Line Thesis (💡): Trade Brigade's midweek update provides technical analysis on SPY, QQQ, IWM, S&P sectors, and a core list of major tech/cyclical names, then proposes trade ideas, with the headline claim that two assets rarely move together—but the specific assets, levels, and trade parameters are not stated in the metadata.
-
Key Data Points (📊):
- Title: 'These Two RARELY Move Together' — the identity of the two assets is not disclosed in the metadata.
- Segments: SPY (00:50), QQQ (11:00), IWM (20:30), S&P Sectors (24:30), Fundamental Evidence (34:00), Technical Evidence (41:00), Core List (43:30), Trade Ideas (51:30).
- Core List tickers: NVDA, AAPL, MSFT, AMZN, GOOGL, AVGO, META, TSLA, JPM, MU, AMD, INTC.
- Trade Ideas tickers: SMCI, AXON, TSEM, AAOI, NBIS, CRSP.
- Description links to live squawk, trading scripts, technical analysis course, TradeZella discount, and free Discord.
- Disclaimer: informational only, not financial advice, creator not a Registered Investment Advisor. -
Technical Levels & Setups OR Macro Drivers (📌):
- The video reviews 'key levels of support and resistance' for SPY, QQQ, IWM, and S&P sectors (claimed but not specified in metadata).
- The core list and trade ideas are presented as candidates for options trading (claimed).
- The headline suggests an unusual correlation/divergence between two unnamed assets (claimed). -
Risk/Reward Framework (⚖️):
- Entry: Not established by the available evidence.
- Stop: Not established by the available evidence.
- Targets: Not established by the available evidence.
- Risk/Reward: Not established by the available evidence.
- Position Size: Not established by the available evidence.
- Probability: Not established by the available evidence. -
Scenario Analysis (🔄):
| Scenario | Probability | Target | Trigger |
|---|---|---|---|
| Unavailable | Not established by the available evidence. | Not established by the available evidence. | Verify source evidence. | -
Risk Factors (⚠️):
- No transcript or price data in the metadata; all specific levels, targets, and setups are unverified.
- The 'two assets that rarely move together' are not named, making the core claim untestable from the evidence.
- Options trading is inherently speculative (per disclaimer); the creator is not a registered advisor.
- Ticker mentions do not imply direction or size; any inference would be analyst interpretation, not creator claim. -
Actionable Trading/Allocation Plan (🎯):
- Obtain the full video transcript to extract exact support/resistance levels for SPY, QQQ, IWM, and sector ETFs.
- Identify the two assets referenced in the title by reviewing the video content (likely within the SPY/QQQ or core list discussion).
- Verify any stated technical evidence and fundamental evidence for the core list tickers against current market data.
- Monitor the trade ideas (SMCI, AXON, TSEM, AAOI, NBIS, CRSP) for the creator's stated entry, stop, and target levels—none of which appear in the metadata.

-
Creator Horizon Category (⏱️): Long-Horizon Macro / Structural — Discussion of long-term structural issues in American science funding, peer review, and physics research, with implications for innovation and national competitiveness.
-
One-Line Thesis (💡): Eric Weinstein argues American science has stalled due to broken funding and peer review systems, proposing radical fixes (altering the Civil Rights Act, killing peer review, funding people not ideas) and claiming that stagnation in physics may have inadvertently saved humanity while UAPs and multi-temporal adversaries warrant investigation.
-
Key Data Points (📊):
- Cowboy science, Fauci, and the scientific precariat — Weinstein's characterization of current science culture
- Blow a hole in the Civil Rights Act, kill peer review, fund people not ideas — Weinstein's proposed fixes
- Ed Witten drove physics off a cliff — claim about theoretical physics trajectory
- Renaissance Technologies is a secret Los Alamos — speculation about the hedge fund
- Stagnant physics saved the human species — claim that physics slowdown prevented catastrophe
- UAPs, multi-temporal adversaries, and Einstein's prison — topics discussed
- China poaches our best scientists — concern about talent drain
- AI reads the trash can corpus — reference to AI analyzing neglected data -
Technical Levels & Setups OR Macro Drivers (📌):
- Weinstein's diagnosis of stalled American science as a driver for proposed policy changes
- Claim that peer review and funding models are obstacles to breakthroughs
- Speculation that Renaissance Technologies operates like a secret research lab as a setup for private-sector science
- China's poaching of scientists as a competitive threat to US innovation
- UAPs and multi-temporal adversaries as potential catalysts for paradigm shifts -
Risk/Reward Framework (⚖️):
- Entry: Not established by the available evidence.
- Stop: Not established by the available evidence.
- Targets: Not established by the available evidence.
- Risk/Reward: Not established by the available evidence.
- Position Size: Not established by the available evidence.
- Probability: Not established by the available evidence. -
Scenario Analysis (🔄):
| Scenario | Probability | Target | Trigger |
|---|---|---|---|
| Bull | Not established by the available evidence. | Not established by the available evidence. | If Weinstein's proposed fixes (e.g., ending peer review, funding individuals) gain traction and lead to scientific breakthroughs |
| Base | Not established by the available evidence. | Not established by the available evidence. | If current scientific funding and peer review systems persist without major reform, maintaining the status quo |
| Bear | Not established by the available evidence. | Not established by the available evidence. | If US science continues to stagnate, China poaches more top scientists, and no reforms are implemented | -
Risk Factors (⚠️):
- Claims are opinion-based and lack empirical verification
- Proposed changes to Civil Rights Act are highly controversial and unlikely to be enacted
- No numbers, financial data, or actionable investment parameters provided
- Discussion of UAPs and multi-temporal adversaries is speculative and unverifiable
- Potential misrepresentation of historical and scientific facts -
Actionable Trading/Allocation Plan (🎯):
- Monitor scientific funding policy debates and any legislative proposals related to peer review reform
- Follow Eric Weinstein's public statements and research for elaboration on claims
- Track US-China scientific talent flows and related policy responses
- Review publicly available information on Renaissance Technologies to assess the 'secret Los Alamos' claim
- Monitor UAP-related disclosures or government reports for relevance to national security
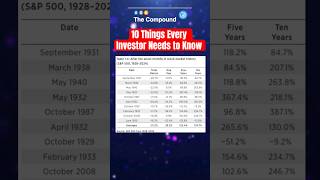
-
Creator Horizon Category (⏱️): Long-Horizon Macro — The video discusses long-term historical patterns of stock market returns, drawdowns, and trends, aimed at setting investor expectations for multi-year and multi-decade horizons.
-
One-Line Thesis (💡): The creator argues that stocks mostly go up but face frequent drawdowns and lumpy returns, yet historically even the worst 30-year return was positive, supporting optimism for long-term investors.
-
Key Data Points (📊):
- Since 1928, almost 95% of years have had a peak-to-trough drawdown of 5% or worse.
- There have been six months with a loss of 20% or more (more than down years).
- After the worst months, the average return five years out is over 120%.
- From the early 1940s, the stock market had nearly 13% annual returns for over two decades.
- A calendar year return of 8-10% happened only once in the last 100 years.
- Japan had terrible returns for over 30 years after two decades of very good returns.
- The worst 30-year annual return (starting 1929, after an 85% crash) was almost 8% per year, with total return over 800%.
- In the 1970s, cash beat both stocks and bonds.
- The longer you stay in the stock market, the higher your probability of a gain. -
Technical Levels & Setups OR Macro Drivers (📌):
- Historical drawdown frequency since 1928 provides a baseline for expected volatility.
- Long-lasting trends: the flat period from late 1920s to early 1940s followed by a two-decade bull run from the early 1940s.
- Japan's multi-decade poor returns serve as a major exception to long-term optimism.
- The rarity of 'average' returns (8-10%) highlights the lumpiness of market outcomes. -
Risk/Reward Framework (⚖️):
- Entry: Not established by the available evidence.
- Stop: Not established by the available evidence.
- Targets: Not established by the available evidence.
- Risk/Reward: Not established by the available evidence.
- Position Size: Not established by the available evidence.
- Probability: Not established by the available evidence. -
Scenario Analysis (🔄):
| Scenario | Probability | Target | Trigger |
|---|---|---|---|
| Bull | Not established by the available evidence. | Not established by the available evidence. | The creator notes that trends can last much longer than imagined, and people have been predicting the end of the current bull market for a long time without success. |
| Base | Not established by the available evidence. | Not established by the available evidence. | Verify the trigger against the source evidence. |
| Bear | Not established by the available evidence. | Not established by the available evidence. | The creator cites Japan's 30+ years of terrible returns after two decades of excellent returns, and the 1929-1940s flat period, as evidence that prolonged poor performance can occur. | -
Risk Factors (⚠️):
- Historical US stock market data since 1928 may not predict future performance or apply to other geographies.
- The Japan example shows that long-term optimism can fail in specific markets.
- The claim that bad times are followed by better times is a historical tendency, not a guarantee.
- Methodology (calendar years, rolling monthly returns, dividends included) may affect the figures and conclusions. -
Actionable Trading/Allocation Plan (🎯):
- Verify the drawdown and return statistics using reputable historical market data sources (e.g., Ibbotson, CRSP) before relying on them.
- Monitor current market drawdown severity and frequency against the historical baselines cited (5%, 10%, 15%, 20% thresholds).
- Consider the historical forward returns after major market bottoms to set recovery expectations for long-term portfolios.
- Review the Japan case to understand conditions where long-term equity returns can be persistently negative.

-
Creator Horizon Category (⏱️): Short-Term Technical — The creator evaluates market health and rotational scenarios, implying a short-term technical focus.
-
One-Line Thesis (💡): TheChartGuys' Joey checks NVDA-led market strength and evaluates the metals bull thesis using rotational scenarios to strategize forward.
-
Key Data Points (📊):
- NVDA lifts market — headline claim
- Metals bull thesis — under examination
- Rotational scenarios — used to evaluate market health -
Technical Levels & Setups OR Macro Drivers (📌):
- NVDA as a market-lifting driver
- Metals bull thesis as a focal point
- Rotation scenarios for strategic positioning -
Risk/Reward Framework (⚖️):
- Entry: Not established by the available evidence.
- Stop: Not established by the available evidence.
- Targets: Not established by the available evidence.
- Risk/Reward: Not established by the available evidence.
- Position Size: Not established by the available evidence.
- Probability: Not established by the available evidence. -
Scenario Analysis (🔄):
| Scenario | Probability | Target | Trigger |
|---|---|---|---|
| Bull | Not established by the available evidence. | Not established by the available evidence. | Not established by the available evidence. |
| Base | Not established by the available evidence. | Not established by the available evidence. | Not established by the available evidence. |
| Bear | Not established by the available evidence. | Not established by the available evidence. | Not established by the available evidence. | -
Risk Factors (⚠️):
- No specific price levels, stops, or targets provided in metadata
- Metals bull thesis lacks quantifiable invalidation criteria
- Rotation scenarios not defined with concrete conditions -
Actionable Trading/Allocation Plan (🎯):
- Watch the video for specific NVDA price levels and leadership confirmation
- Verify metals bull thesis against actual chart levels and invalidation points
- Monitor rotational scenarios as described in the video for market health signals
-
Creator Horizon Category (⏱️): Short-Term Technical — The video focuses on imminent catalysts such as Nvidia earnings and AI spending inflection points, which are near-term market events.
-
One-Line Thesis (💡): The video warns against relying on gut instinct when trading stocks, emphasizing AI spending trends, Nvidia earnings, and companies using AI to deliver earnings surprises, while also flagging a bullish materials setup.
-
Key Data Points (📊):
- Peak AI spending debate — whether the market is approaching peak AI spending.
- Nvidia earnings — as a catalyst for the next phase of the AI trade.
- Companies using AI to surprise investors with better-than-expected growth — identified as the biggest opportunity.
- Airbnb and Delta — named as emerging AI beneficiaries.
- Bullish setup in materials — sector-level claim.
- ETF Issuer of the Year — topic discussed without specific nominee or winner.
- LeBron James' massive $300 million loan — literal figure referenced.
- Netflix vs. Spotify — comparison discussed. -
Technical Levels & Setups OR Macro Drivers (📌):
- AI spending trajectory — whether peak is near drives AI trade direction.
- Nvidia earnings results — will inform AI trade's next phase.
- AI-driven earnings growth — companies like Airbnb and Delta that use AI to beat estimates.
- Materials sector — bullish setup claimed, but no specifics.
- Consumer/entertainment comparisons — Netflix vs. Spotify, LeBron loan as tangential market anecdotes. -
Risk/Reward Framework (⚖️):
- Entry: Not established by the available evidence.
- Stop: Not established by the available evidence.
- Targets: Not established by the available evidence.
- Risk/Reward: Not established by the available evidence.
- Position Size: Not established by the available evidence.
- Probability: Not established by the available evidence. -
Scenario Analysis (🔄):
| Scenario | Probability | Target | Trigger |
|---|---|---|---|
| Bull | Not established by the available evidence. | Not established by the available evidence. | Nvidia earnings confirm resilient AI demand and AI-driven growth surprises from companies like Airbnb and Delta. |
| Base | Not established by the available evidence. | Not established by the available evidence. | Nvidia earnings are mixed, leaving the peak AI spending question unresolved but without market-breaking news. |
| Bear | Not established by the available evidence. | Not established by the available evidence. | Nvidia earnings signal that AI spending is peaking, triggering de-rating in AI-related stocks and the broader trade. | -
Risk Factors (⚠️):
- No specific entry, stop, target, or position sizing provided, making the premise untradeable without further data.
- The warning against gut instinct implies behavioral risk, but no concrete method is offered to replace it.
- The 'bullish materials setup' is asserted without supporting fundamentals or technical levels.
- All claims are qualitative; no figures for AI spending, earnings estimates, or growth rates are cited. -
Actionable Trading/Allocation Plan (🎯):
- Monitor Nvidia earnings release and guidance for AI demand signals.
- Track AI spending indicators (e.g., capex guidance from major tech firms) to assess peak-AI claims.
- Evaluate Airbnb and Delta earnings calls for AI-driven cost savings or revenue growth surprises.
- Review materials sector price action and fundamentals to validate the claimed bullish setup.
- Verify the $300 million loan figure attributed to LeBron James and its context.

-
Creator Horizon Category (⏱️): Long-Horizon Macro / Structural — Video addresses long-term structural issues in American science, physics, and institutional incentives rather than short-term market moves.
-
One-Line Thesis (💡): Eric Weinstein claims American science has stalled, proposes radical fixes including altering the Civil Rights Act, eliminating peer review, and funding people over ideas, while alleging physics was driven off a cliff by Ed Witten and that Renaissance Technologies may operate as a secret Los Alamos.
-
Key Data Points (📊):
- American science stalled — claim made by Weinstein in video segment 03:09
- Cowboy science, Fauci, scientific precariat — topics cited as symptoms of stagnation
- Blow a hole in the Civil Rights Act — Weinstein's proposed fix (21:31)
- Kill peer review, fund people not ideas — Weinstein's proposed fix (21:31)
- Ed Witten drove physics off a cliff — Weinstein claim (41:36)
- Renaissance Technologies as a secret Los Alamos — Weinstein hypothesis (41:36)
- Stagnant physics saved human species — Weinstein speculation (52:49)
- UAPs, multi-temporal adversaries, Einstein's prison — segment on unidentified aerial phenomena (01:07:11)
- China poaches best scientists, AI reads trash can corpus — segment on talent migration and AI (01:16:12) -
Technical Levels & Setups OR Macro Drivers (📌):
- Alleged stagnation in American science as a driver for proposed policy changes
- Peer review identified as an institutional failure driving the scientific precariat
- Physics stagnation linked to potential existential risk reduction or cover-up
- Talent poaching by China as a competitive threat to U.S. innovation -
Risk/Reward Framework (⚖️):
- Entry: Not established by the available evidence.
- Stop: Not established by the available evidence.
- Targets: Not established by the available evidence.
- Risk/Reward: Not established by the available evidence.
- Position Size: Not established by the available evidence.
- Probability: Not established by the available evidence. -
Scenario Analysis (🔄):
| Scenario | Probability | Target | Trigger |
|---|---|---|---|
| Bull | Not established by the available evidence. | Not established by the available evidence. | If Weinstein's proposed reforms (e.g., funding people over ideas, altering peer review) gain traction in policy or institutional discourse. |
| Base | Not established by the available evidence. | Not established by the available evidence. | Continued public debate about science stagnation and reform without concrete policy change. |
| Bear | Not established by the available evidence. | Not established by the available evidence. | If evidence emerges contradicting claims of stagnation or if proposed fixes are rejected or lead to negative outcomes. | -
Risk Factors (⚠️):
- All claims are unverified opinions from a single creator; no supporting data provided in evidence.
- Proposed 'blow a hole in the Civil Rights Act' is highly controversial and legally infeasible as stated.
- Renaissance Technologies as 'secret Los Alamos' is speculative and lacks evidence.
- No financial market insight is derived from this content; relevance to investing is indirect. -
Actionable Trading/Allocation Plan (🎯):
- Verify claims of scientific stagnation using publication and R&D productivity data from official sources.
- Monitor policy proposals or statements from Weinstein or related figures for any concrete legislative or institutional follow-through.
- Cross-check the Renaissance Technologies hypothesis against public filings and historical records.
- Assess whether any discussion of UAPs or 'multi-temporal adversaries' has corroborated official declassified documents.

-
Creator Horizon Category (⏱️): Short-Term Technical — The video is centered on NVIDIA's Q2 earnings release and pre-market technical analysis for futures and options traders, indicating a short-term trading focus.
-
One-Line Thesis (💡): Trade Brigade's live stream covers NVIDIA Q2 earnings with technical analysis and the Jensen Huang conference call; the metadata discloses no specific trade levels, targets, or probabilities.
-
Key Data Points (📊):
- Technical analysis focus — description mentions 'pre market technical analysis for futures traders and options traders'
- Jensen Conference Call — explicitly referenced in title
- Livestream scheduled daily at 8:00 AM EST — from description
- Links to live squawk, technical analysis course, trading scripts, newsletter, TradeZella discount — from description
- Disclaimer: 'not financial or legal advice' and 'not a Registered Investment Advisor' -
Technical Levels & Setups OR Macro Drivers (📌):
- NVIDIA Q2 earnings release as the primary market catalyst
- Pre-market technical analysis setup for futures and options trading -
Risk/Reward Framework (⚖️):
- Entry: Not established by the available evidence.
- Stop: Not established by the available evidence.
- Targets: Not established by the available evidence.
- Risk/Reward: Not established by the available evidence.
- Position Size: Not established by the available evidence.
- Probability: Not established by the available evidence. -
Scenario Analysis (🔄):
| Scenario | Probability | Target | Trigger |
|---|---|---|---|
| Unavailable | Not established by the available evidence. | Not established by the available evidence. | Verify source evidence. | -
Risk Factors (⚠️):
- No specific price levels or trade parameters are disclosed in the metadata; any claims from the live video are unverified.
- The creator explicitly disclaims being a registered investment advisor, and content is for informational purposes only.
- Live stream content may include speculative or unverifiable statements about earnings and technicals. -
Actionable Trading/Allocation Plan (🎯):
- Watch the full video to extract any trade levels, targets, or risk parameters the creator actually states.
- Verify any mentioned NVIDIA price levels or earnings expectations against official market data after the broadcast.
- Review the linked 'live squawk' and other resources for additional context but treat all content as non-advice.

-
Creator Horizon Category (⏱️): Long-Horizon Macro — Description covers broad macro topics (Treasury buybacks, government debt, housing costs) with no short-term trading parameters.
-
One-Line Thesis (💡): The episode's headline topics—Treasury bond buybacks, Druckenmiller's op-ed, real government debt risk, Bitcoin's awakening, and private market fraud—frame a macro-oriented discussion without issuing specific market calls or price targets.
-
Key Data Points (📊):
- Episode 479 — episode number listed in title
- Michael Batnick and Ben Carlson — hosts named in description
- Treasury bond buybacks — listed as discussion topic
- Stanley Druckenmiller's op-ed — listed as discussion topic
- Real government debt risk — listed as discussion topic
- Most hated asset class in the world — listed as discussion topic
- Bitcoin woke up — creator claim that Bitcoin activity increased
- End of the Go-Go years — listed as discussion topic
- Finance bros are having a moment — listed as discussion topic
- Private market fraud — listed as discussion topic
- High cost of housing and transportation — listed as discussion topic
- Jean-Claude Van Damme — mentioned in description -
Technical Levels & Setups OR Macro Drivers (📌):
- Not established by the available evidence. -
Risk/Reward Framework (⚖️):
- Entry: Not established by the available evidence.
- Stop: Not established by the available evidence.
- Targets: Not established by the available evidence.
- Risk/Reward: Not established by the available evidence.
- Position Size: Not established by the available evidence.
- Probability: Not established by the available evidence. -
Scenario Analysis (🔄):
| Scenario | Probability | Target | Trigger |
|---|---|---|---|
| Unavailable | Not established by the available evidence. | Not established by the available evidence. | Verify source evidence. | -
Risk Factors (⚠️):
- No specific claims with quantitative detail to validate or invalidate from the metadata alone.
- References to op-ed and news topics require external verification of actual discussed content.
- The phrase 'Bitcoin woke up' is ambiguous and lacks magnitude or timeframe. -
Actionable Trading/Allocation Plan (🎯):
- Verify the episode audio to confirm discussion of Treasury bond buybacks.
- Locate and review the referenced Stanley Druckenmiller op-ed.
- Monitor Bitcoin price action to assess the 'woke up' claim context.
- Query government debt statistics to evaluate the debt risk discussion.

-
Creator Horizon Category (⏱️): Long-Horizon Macro / Structural — The video title frames open-source AI as a patriotic imperative, indicating a long-term strategic/policy discussion rather than a short-term technical setup.
-
One-Line Thesis (💡): Gavin Baker (via All-In Podcast) asserts that being a patriot should lead one to support open-source AI, positioning open-source AI as a national-interest priority.
-
Key Data Points (📊):
- Title claim: 'If you're a patriot, you should be pro-open source AI' — the sole substantive assertion
- Creator/channel: All-In Podcast — source of the claim -
Technical Levels & Setups OR Macro Drivers (📌):
- Patriotic/patriotic-duty framing as the stated driver for pro-open-source AI stance
- No additional catalysts, tickers, or setups establish from the evidence -
Risk/Reward Framework (⚖️):
- Entry: Not established by the available evidence.
- Stop: Not established by the available evidence.
- Targets: Not established by the available evidence.
- Risk/Reward: Not established by the available evidence.
- Position Size: Not established by the available evidence.
- Probability: Not established by the available evidence. -
Scenario Analysis (🔄):
| Scenario | Probability | Target | Trigger |
|---|---|---|---|
| Bull | Not established by the available evidence. | Not established by the available evidence. | No explicit bull trigger beyond the title's claim; verification would require evidence connecting open-source AI to patriotic outcomes. |
| Base | Not established by the available evidence. | Not established by the available evidence. | Status quo—the claim remains an opinion without quantitative or policy-specific backing in the provided evidence. |
| Bear | Not established by the available evidence. | Not established by the available evidence. | No explicit bear trigger; potential invalidation would arise from contradicting evidence on open-source AI's national-security or economic costs. | -
Risk Factors (⚠️):
- Evidence is metadata-only; no transcript, numbers, or specific policy proposals to verify
- Claim is normative and may reflect personal or political bias rather than verifiable data
- No tickers, valuations, or financial parameters are provided in the evidence -
Actionable Trading/Allocation Plan (🎯):
- Obtain the full episode transcript to extract any specific claims, examples, or data beyond the title
- Cross-reference Gavin Baker's public statements on open-source AI for consistency and additional context
- Monitor AI policy discussions and open-source licensing debates for evidence of the claimed patriotic link
-
Creator Horizon Category (⏱️): Short-Term Technical — The creator explicitly frames the video as pre-market technical analysis for futures and options traders around NVDA earnings, indicating an intraday or short-term trading horizon.
-
One-Line Thesis (💡): Trade Brigade's live pre-market prep session claims to deliver technical analysis focused on NVDA earnings, targeting futures and options traders ahead of the market open.
-
Key Data Points (📊):
- NVDA earnings — the central catalyst stated in the video title.
- Pre-market live broadcast — the video is a live session at 8:00 AM EST (from description).
- Technical analysis for futures and options traders — the stated purpose of the stream.
- Live Squawk, technical analysis course, trading scripts — promotional offers in description (not analytical claims). -
Technical Levels & Setups OR Macro Drivers (📌):
- NVDA earnings report as the primary event driving expected volatility.
- Pre-market technical analysis of market conditions to identify trading setups.
- Use of technical indicators and chart patterns implied by the 'technical analysis' label. -
Risk/Reward Framework (⚖️):
- Entry: Not established by the available evidence.
- Stop: Not established by the available evidence.
- Targets: Not established by the available evidence.
- Risk/Reward: Not established by the available evidence.
- Position Size: Not established by the available evidence.
- Probability: Not established by the available evidence. -
Scenario Analysis (🔄):
| Scenario | Probability | Target | Trigger |
|---|---|---|---|
| Unavailable | Not established by the available evidence. | Not established by the available evidence. | Verify source evidence. | -
Risk Factors (⚠️):
- The video content itself is not provided in this evidence; any specific levels, probabilities, or trade plans cannot be verified.
- Earnings outcomes are uncertain and market reactions may deviate from technical analysis.
- The creator's disclaimer notes that information is for informational purposes only and not financial advice, implying no guarantee of accuracy. -
Actionable Trading/Allocation Plan (🎯):
- Review the video to extract the creator's specific technical levels and trade plan for NVDA.
- Monitor NVDA earnings release and subsequent price action to assess the validity of the pre-market technical signals.
- Cross-check the creator's claims against official earnings data and live market data, given the lack of a verifiable paper trail in metadata.

-
Creator Horizon Category (⏱️): Long-Horizon Macro / Structural — The episode's topics (Treasury bond buybacks, government debt risk, private market fraud) suggest a structural macro analysis rather than a short-term technical setup.
-
One-Line Thesis (💡): In episode 479 of Animal Spirits, Michael Batnick and Ben Carlson examine whether free markets are dead by discussing Treasury bond buybacks, government debt risk, Bitcoin's resurgence, private market fraud, and the high cost of housing and transportation.
-
Key Data Points (📊):
- Are Free Markets Dead? — central question of the episode
- Treasury bond buybacks — discussed as a topic
- Stanley Druckenmiller's op-ed — discussed regarding government debt risk
- The real government debt risk — highlighted as a concern
- The most hated asset class in the world — discussed but not specified
- Why Bitcoin woke up — discussed as a recent price move
- The end of the Go-Go years — discussed as a regime change
- Finance bros are having a moment — discussed as a cultural/market phenomenon
- Private market fraud — discussed as a risk
- High cost of housing and transportation — discussed as a cost burden
- Jean-Claude Van Damme — mentioned in entertainment section -
Technical Levels & Setups OR Macro Drivers (📌):
- Treasury bond buybacks discussed as a potential market support mechanism
- Government debt risk presented as a macro driver
- Bitcoin's resurgence discussed as a catalyst for crypto attention
- Private market fraud discussed as a structural risk
- Housing and transportation costs discussed as economic drags -
Risk/Reward Framework (⚖️):
- Entry: Not established by the available evidence.
- Stop: Not established by the available evidence.
- Targets: Not established by the available evidence.
- Risk/Reward: Not established by the available evidence.
- Position Size: Not established by the available evidence.
- Probability: Not established by the available evidence. -
Scenario Analysis (🔄):
| Scenario | Probability | Target | Trigger |
|---|---|---|---|
| Unavailable | Not established by the available evidence. | Not established by the available evidence. | Verify source evidence. | -
Risk Factors (⚠️):
- Government debt risk as discussed by the creators
- Private market fraud as a potential systemic risk
- High cost of housing and transportation as a burden on consumers
- End of the Go-Go years could imply a market downturn -
Actionable Trading/Allocation Plan (🎯):
- Review the episode's full discussion to extract any specific figures or price levels on Treasury buybacks and government debt.
- Cross-check Druckenmiller's op-ed with the original source for its stance on government debt risk.
- Track subsequent Bitcoin price action to validate the 'woke up' narrative.
- Monitor private market fraud cases against public enforcement actions mentioned in the episode.
-
Creator Horizon Category (⏱️): Long-Horizon Macro — The video examines peak AI spending, Nvidia's earnings as a phase indicator, and long-term AI beneficiaries, indicating a macro/structural investment horizon.
-
One-Line Thesis (💡): The Compound's Josh Brown and Michael Batnick discuss whether AI spending is peaking, how Nvidia's earnings may signal the next phase of the AI trade, and identify Airbnb, Delta, and materials as emerging AI beneficiaries or bullish setups.
-
Key Data Points (📊):
- Question of approaching peak AI spending — key theme discussed
- Nvidia's earnings could tell us about the next phase of the AI trade — discussed
- Biggest opportunity may be companies using AI to surprise investors with better-than-expected growth — discussed
- Airbnb and Delta as emerging AI beneficiaries — discussed
- Bullish setup in materials — discussed
- LeBron James' massive $300 million loan — mentioned
- Netflix vs. Spotify comparison — mentioned
- ETF Issuer of the Year — topic discussed -
Technical Levels & Setups OR Macro Drivers (📌):
- AI spending trajectory as potential market driver — discussed as a question
- Nvidia earnings as a catalyst for AI trade direction — discussed
- Companies using AI to beat earnings expectations — positioned as an opportunity
- Airbnb (ABNB) and Delta (DAL) cited as emerging AI beneficiaries — discussed
- Materials sector described as having a bullish setup — discussed -
Risk/Reward Framework (⚖️):
- Entry: Not established by the available evidence.
- Stop: Not established by the available evidence.
- Targets: Not established by the available evidence.
- Risk/Reward: Not established by the available evidence.
- Position Size: Not established by the available evidence.
- Probability: Not established by the available evidence. -
Scenario Analysis (🔄):
| Scenario | Probability | Target | Trigger |
|---|---|---|---|
| Bull | Not established by the available evidence. | Not established by the available evidence. | Nvidia earnings confirm sustained AI demand and companies using AI report better-than-expected growth — topics raised in the video |
| Base | Not established by the available evidence. | Not established by the available evidence. | Mixed signals on AI spending and earnings lead to sector rotation across the discussed beneficiaries — implied by the breadth of topics |
| Bear | Not established by the available evidence. | Not established by the available evidence. | Evidence of approaching peak AI spending — the central question posed in the video — would challenge the AI trade | -
Risk Factors (⚠️):
- No specific numbers, price levels, or valuation data provided in the evidence; all claims are topical and lack quantitative support
- Potential invalidation of the AI trade if peak spending is confirmed — a key uncertainty explicitly raised
- Bullish materials setup is asserted but not substantiated with data in the evidence
- Airbnb and Delta as AI beneficiaries are claims without supporting metrics in the available evidence -
Actionable Trading/Allocation Plan (🎯):
- Monitor Nvidia's upcoming earnings report and management commentary for signals on AI infrastructure spending growth
- Track quarterly reports from Airbnb and Delta for evidence of AI-driven cost savings or revenue surprises
- Evaluate the materials sector for technical or fundamental confirmation of the described bullish setup
- Review the debate on peak AI spending vs. continued investment to assess the sustainability of the AI trade

-
Creator Horizon Category (⏱️): Other — The evidence discusses public trust in science and COVID-era policy, with no direct market or financial implications.
-
One-Line Thesis (💡): The creator argues that Fauci's contradictory COVID guidance (masking students, permitting protests but not hospital visits) undermined public trust in science, and advocates returning to 'gold standard science' as a corrective.
-
Key Data Points (📊):
- Fauci represented a disservice to science in modern history — creator claim
- Advocated students masked in schools — cited as contradictory
- Pediatric societies allowed collective protest but not visiting dying grandmother — cited as contradictory
- Approach to return to 'gold standard science' — creator's proposed remedy -
Technical Levels & Setups OR Macro Drivers (📌):
- Contradictory public health guidance as driver of science distrust
- Call for 'gold standard science' as a post-COVID corrective -
Risk/Reward Framework (⚖️):
- Entry: Not established by the available evidence.
- Stop: Not established by the available evidence.
- Targets: Not established by the available evidence.
- Risk/Reward: Not established by the available evidence.
- Position Size: Not established by the available evidence.
- Probability: Not established by the available evidence. -
Scenario Analysis (🔄):
| Scenario | Probability | Target | Trigger |
|---|---|---|---|
| Unavailable | Not established by the available evidence. | Not established by the available evidence. | Verify source evidence. | -
Risk Factors (⚠️):
- Creator's characterization of Fauci and pediatric societies is unverified and disputed
- No specific sources or data provided to substantiate the claims
- Evidence lacks any market or investment relevance -
Actionable Trading/Allocation Plan (🎯):
- Verify Fauci's specific statements on masking and visitations from primary sources
- Check pediatric society letters referenced in the video for authenticity and context
- Monitor public health policy communications for consistency with scientific evidence

-
Creator Horizon Category (⏱️): Long-Horizon Macro / Structural — The video title frames a regulatory policy outcome that would determine Anthropic's viability.
-
One-Line Thesis (💡): According to the video title, David Sacks argues that if Dario Amodei's preferred AI regulations were implemented, it would destroy Anthropic, implying a severe negative impact on the company under those policies.
-
Key Data Points (📊):
- David Sacks: If Dario Got His Way on AI Regulation, It Would Destroy Anthropic — title claim
- Source: YouTube video ID J0QFTXCabGQ — metadata
- Hashtags: #allin #tech #news — topic tags -
Technical Levels & Setups OR Macro Drivers (📌):
- Creator David Sacks asserts that Dario Amodei's AI regulation preferences would destroy Anthropic — a policy-driven risk setup
- The episode likely discusses AI regulation and its potential impact on AI companies like Anthropic -
Risk/Reward Framework (⚖️):
- Entry: Not established by the available evidence.
- Stop: Not established by the available evidence.
- Targets: Not established by the available evidence.
- Risk/Reward: Not established by the available evidence.
- Position Size: Not established by the available evidence.
- Probability: Not established by the available evidence. -
Scenario Analysis (🔄):
| Scenario | Probability | Target | Trigger |
|---|---|---|---|
| Bull | Not established by the available evidence. | Not established by the available evidence. | Dario Amodei's AI regulation preferences are not adopted, avoiding the destruction scenario claimed by Sacks. |
| Bear | Not established by the available evidence. | Not established by the available evidence. | Dario Amodei's AI regulation preferences are enacted, leading to the claimed destruction of Anthropic. | -
Risk Factors (⚠️):
- Available evidence is limited to the video title; the actual arguments, data, and context are unverified.
- Potential misrepresentation of Dario Amodei's position or the regulatory impact as presented in the title. -
Actionable Trading/Allocation Plan (🎯):
- Review the full episode to extract Dario Amodei's specific AI regulation proposals and Sacks' supporting evidence.
- Monitor AI policy developments that align with Dario Amodei's stated preferences.
- Cross-check Anthropic's public statements on regulation and its potential vulnerability.

-
Creator Horizon Category (⏱️): Short-Term Technical — The description focuses on immediate follow-through from bond news and entry without FOMO, indicating a short-term technical trading horizon.
-
One-Line Thesis (💡): Crypto bulls make a statement as bond news drives follow-through, breaking crypto equilibriums to the upside, with focus on altcoins and managing FOMO entries.
-
Key Data Points (📊):
- "Crypto Bulls Make a Statement" — video title
- "Bond news leads to big time follow through" — claimed catalyst
- "crypto equilibriums breaking bull" — claimed market condition
- "Which Alts Coins are we focusing on" — altcoin focus
- "how should one enter without giving in to FOMO" — entry discipline emphasis -
Technical Levels & Setups OR Macro Drivers (📌):
- Bond news as macro catalyst for crypto follow-through
- Breaking of crypto equilibriums to the upside as a technical setup
- Focus on altcoins for potential entries
- FOMO-avoidance as a setup consideration -
Risk/Reward Framework (⚖️):
- Entry: Not established by the available evidence.
- Stop: Not established by the available evidence.
- Targets: Not established by the available evidence.
- Risk/Reward: Not established by the available evidence.
- Position Size: Not established by the available evidence.
- Probability: Not established by the available evidence. -
Scenario Analysis (🔄):
| Scenario | Probability | Target | Trigger |
|---|---|---|---|
| Unavailable | Not established by the available evidence. | Not established by the available evidence. | Verify source evidence. | -
Risk Factors (⚠️):
- Missing specific invalidation levels from evidence
- Lack of ticker-specific data prevents verification of altcoin claims -
Actionable Trading/Allocation Plan (🎯):
- Watch for continued bond market news and its effect on crypto equilibriums
- Review TheChartGuys free resources for details on altcoin focus
- Seek additional evidence on specific entry levels to avoid FOMO

-
Creator Horizon Category (⏱️): Long-Horizon Macro / Structural — Discusses long-term product/regulatory dynamics of surveillance technology in law enforcement, with no short-term market catalyst.
-
One-Line Thesis (💡): In an All-In Podcast excerpt, the creator describes Flock's surveillance camera abuse detection: under a dozen abuses over 8 years, now requiring a mandatory feature to identify and remove bad cops; no financial or investment claims are made.
-
Key Data Points (📊):
- under a dozen abuses over the last 8 years — detected by Flock
- mandatory feature — required to be turned on for abuse detection
- abuse example: repeated searches for a specific plate without adding to hot list — flagged as potential stalking
- we've caught a lot of bad cops — creator's claim
- it's a ton for us too — creator's comment on abuse volume -
Technical Levels & Setups OR Macro Drivers (📌):
- Mandatory abuse-detection feature could reduce misuse and improve law enforcement accountability, but no financial catalyst stated.
- Creator's statement that the feature is now mandatory suggests a product/process change, but no ticker, valuation, or revenue impact mentioned. -
Risk/Reward Framework (⚖️):
- Entry: Not established by the available evidence.
- Stop: Not established by the available evidence.
- Targets: Not established by the available evidence.
- Risk/Reward: Not established by the available evidence.
- Position Size: Not established by the available evidence.
- Probability: Not established by the available evidence. -
Scenario Analysis (🔄):
| Scenario | Probability | Target | Trigger |
|---|---|---|---|
| Bull | Not established by the available evidence. | Not established by the available evidence. | Creator states mandatory feature is now required to find and remove bad cops, implying stronger accountability. |
| Base | Not established by the available evidence. | Not established by the available evidence. | Creator reports under a dozen abuses over 8 years and now mandates the detection feature; operations continue as described. |
| Bear | Not established by the available evidence. | Not established by the available evidence. | Creator notes 'it's a ton for us too,' indicating abuse volume exceeded expectations, which could signal broader systemic issues. | -
Risk Factors (⚠️):
- No financial metrics (ticker, valuation, revenue, margins) are provided in the evidence — cannot assess investment implications.
- Creator claims are anecdotal and self-reported; no independent verification of abuse statistics or feature effectiveness.
- Privacy and civil-liberty concerns about surveillance cameras are not addressed in the excerpt, but may affect regulatory or public perception. -
Actionable Trading/Allocation Plan (🎯):
- Verify Flock's public disclosures or press releases about the mandatory abuse-detection feature and any stated abuse statistics.
- Monitor independent audits or news reports on police usage of Flock cameras and abuse detection outcomes.
- Track regulatory or legal developments involving automated license plate reader (ALPR) surveillance and privacy rules.

-
Creator Horizon Category (⏱️): Other — Metadata provides no market horizon; episode is a general Q&A with no stated timeframe.
-
One-Line Thesis (💡): According to the episode description, the video (ATC 237) features Ben Carlson and Duncan Hill discussing personal finance, stocks, and investing topics, but no specific investment thesis is stated in the available metadata.
-
Key Data Points (📊):
- Episode 237 of Ask The Compound
- Hosts: Ben Carlson and Duncan Hill (employees of Ritholtz Wealth Management)
- Topics mentioned: #personalfinance, #stocks, #investing101, #wealth
- Description includes disclaimer: 'informational purposes only and should not be regarded as personalized investment advice'
- Description includes affiliate disclosure: The Compound Media may receive payment from advertisers -
Technical Levels & Setups OR Macro Drivers (📌):
- Not established by the available evidence. -
Risk/Reward Framework (⚖️):
- Entry: Not established by the available evidence.
- Stop: Not established by the available evidence.
- Targets: Not established by the available evidence.
- Risk/Reward: Not established by the available evidence.
- Position Size: Not established by the available evidence.
- Probability: Not established by the available evidence. -
Scenario Analysis (🔄):
| Scenario | Probability | Target | Trigger |
|---|---|---|---|
| Unavailable | Not established by the available evidence. | Not established by the available evidence. | Verify source evidence. | -
Risk Factors (⚠️):
- No transcript or content summary is available in the evidence; specific claims cannot be verified.
- The video is explicitly labeled as informational only, not personalized advice.
- Hosts may maintain positions in securities discussed, but no specific positions are disclosed in the metadata. -
Actionable Trading/Allocation Plan (🎯):
- Watch the full video to extract any specific market claims, targets, or portfolio implications.
- Review the official disclosures at ritholtzwealth.com/podcast-youtube-disclosures/ for potential conflicts of interest.
- Check the Ask The Compound podcast feed for additional show notes that may contain topic specifics.
-
Creator Horizon Category (⏱️): Long-Horizon Macro — The creator sets a specific 2027 timeline for a bubble burst, indicating a multi-year macro thesis.
-
One-Line Thesis (💡): The Compound's Josh Brown and Michael Batnick claim there are five reasons a bubble will burst in 2027, including that current AI spending is at its peak.
-
Key Data Points (📊):
- Five reasons for a bubble burst in 2027 — stated in the video title
- "This is peak AI spend" — segment label in the description
- Sponsored by F/m Investments and SGVA (F/m Accumulator Ultrashort Treasury ETF) — from description -
Technical Levels & Setups OR Macro Drivers (📌):
- Claim of peak AI spend as a setup for a potential bubble burst
- Video includes segments titled "One of the Cleanest Setups," "ETF Issuer of the Year," "Make The Case," and "Mystery Chart" — no specific content available from metadata -
Risk/Reward Framework (⚖️):
- Entry: Not established by the available evidence.
- Stop: Not established by the available evidence.
- Targets: Not established by the available evidence.
- Risk/Reward: Not established by the available evidence.
- Position Size: Not established by the available evidence.
- Probability: Not established by the available evidence. -
Scenario Analysis (🔄):
| Scenario | Probability | Target | Trigger |
|---|---|---|---|
| Bear | Not established by the available evidence. | Not established by the available evidence. | Creator's stated thesis of five reasons for a bubble burst in 2027 | -
Risk Factors (⚠️):
- No transcript or content details available to verify the five reasons or any quantitative evidence
- Title may be hyperbolic or clickbait; actual claims could differ from the headline
- No specific tickers, levels, or valuation data provided in the evidence -
Actionable Trading/Allocation Plan (🎯):
- Watch the video to extract the five specific reasons and any supporting data
- Check if the video contains verifiable market metrics (e.g., AI capex, valuation multiples) tied to the 2027 timeline
- Note any disclaimers about the sponsor SGVA, as it is an ultrashort Treasury ETF, possibly implying a defensive positioning theme
-
Creator Horizon Category (⏱️): Short-Term Technical — The video is a live pre-market technical analysis session for futures and options traders, focused on the immediate trading day and NVDA earnings scheduled for tomorrow.
-
One-Line Thesis (💡): Trade Brigade's pre-market prep highlights a potential market bounce and questions whether to fade it, with NVDA earnings as the key imminent catalyst.
-
Key Data Points (📊):
- NVDA earnings tomorrow — per video title
- Live pre-market technical analysis every trading day at 8:00 AM EST — from video description
- Target audience: futures traders and options traders — from video description -
Technical Levels & Setups OR Macro Drivers (📌):
- NVDA earnings as imminent catalyst
- Pre-market technical analysis of a potential bounce — creator questions whether to fade it -
Risk/Reward Framework (⚖️):
- Entry: Not established by the available evidence.
- Stop: Not established by the available evidence.
- Targets: Not established by the available evidence.
- Risk/Reward: Not established by the available evidence.
- Position Size: Not established by the available evidence.
- Probability: Not established by the available evidence. -
Scenario Analysis (🔄):
| Scenario | Probability | Target | Trigger |
|---|---|---|---|
| Unavailable | Not established by the available evidence. | Not established by the available evidence. | Verify source evidence. | -
Risk Factors (⚠️):
- No specific price levels, entries, stops, or targets are provided in the available metadata; analysis cannot be verified.
- NVDA earnings outcome is unknown and could invalidate any pre-market technical read.
- Creator's stance is framed as a question ('FADE it?!'), leaving directional bias unspecified. -
Actionable Trading/Allocation Plan (🎯):
- Verify NVDA earnings date and time from official sources.
- Watch the video for actual price levels, entry/stop/target figures, and underlying technical claims.
- Cross-check Trade Brigade's linked resources and social media for any supplementary data or disclaimers.

-
Creator Horizon Category (⏱️): Other — The evidence discusses business communication and storytelling, not financial or market horizons.
-
One-Line Thesis (💡): The creator argues that business stories should begin with the words to be spoken or written, not with slides, and that slide decks often become de facto teleprompters that undermine narrative coherence.
-
Key Data Points (📊):
- PowerPoint — creator cites companies opening a blank first slide and asking where to start, which he critiques.
- Slide deck — creator claims needing a deck means the presenter is 'not telling a story' and is a 'slide monkey'.
- Die Hard / Burger King — creator uses analogy of inserting a Burger King scene into Die Hard to illustrate arbitrary slide additions destroying stories. -
Technical Levels & Setups OR Macro Drivers (📌):
- Creator's recommended process: start at the end (final message to customers), then define the beginning as the opposite of the end, and build the narrative in between.
- Creator's claim: if a competitor needs slides and power is cut, he can present without the deck and 'kill him every time'.
- Creator's dismissal of slide-shuffling by vice presidents as non-storytelling behavior. -
Risk/Reward Framework (⚖️):
- Entry: Not established by the available evidence.
- Stop: Not established by the available evidence.
- Targets: Not established by the available evidence.
- Risk/Reward: Not established by the available evidence.
- Position Size: Not established by the available evidence.
- Probability: Not established by the available evidence. -
Scenario Analysis (🔄):
| Scenario | Probability | Target | Trigger |
|---|---|---|---|
| Unavailable | Not established by the available evidence. | Not established by the available evidence. | Verify source evidence. | -
Risk Factors (⚠️):
- No financial, price, valuation, or market data is present in the evidence; any investment-related risk cannot be assessed.
- The evidence is a single anecdotal quote with no supporting data or verification; its generalizability is unproven. -
Actionable Trading/Allocation Plan (🎯):
- Verify whether the full video contains any specific financial examples, tickers, or quantitative claims beyond the storytelling thesis.
- Monitor for follow-up content from the same channel that bridges communication style to actual investment or business outcomes.
-
Creator Horizon Category (⏱️): Long-Horizon Macro — Creator frames the market's current state as an implicit 5-year no-recession assumption tied to hyperscaler capex and low aggregate volatility.
-
One-Line Thesis (💡): The Compound's speaker argues that the current market regime — low VIX, low correlations, and sector rotation into healthcare, financials, and tech — rests on an implicit consensus that no recession will occur for the next five years, with hyperscalers' heavy AI investment and leverage as proof of that belief.
-
Key Data Points (📊):
- No recession for next 5 years — explicit 'period. Full stop.' claim about the market's implicit assumption
- Low VIX — creator notes aggregate volatility is 'very low'
- Low correlations — 'correlations can be low because investors can pick and choose' across sectors
- Sector mentions: healthcare, financials, tech — cited as parts of the rotation
- Hyperscalers leveraging balance sheets for AI — presented as evidence that recession is not expected
- Last 15 years — tech founders/CEOs concluded the risk is 'not a vanilla business cycle correction' -
Technical Levels & Setups OR Macro Drivers (📌):
- Hyperscaler capital spending and balance-sheet leverage serving as a signal of no recession
- Sector-selective positioning (healthcare, financials, tech) enabled by low correlations
- Low VIX reflecting muted aggregate market concern despite sector-level divergence -
Risk/Reward Framework (⚖️):
- Entry: Not established by the available evidence.
- Stop: Not established by the available evidence.
- Targets: Not established by the available evidence.
- Risk/Reward: Not established by the available evidence.
- Position Size: Not established by the available evidence.
- Probability: Not established by the available evidence. -
Scenario Analysis (🔄):
| Scenario | Probability | Target | Trigger |
|---|---|---|---|
| Bull | Not established by the available evidence. | Not established by the available evidence. | No recession materializes over the next five years; hyperscalers continue investing, correlations stay low, and sector rotation persists. |
| Bear | Not established by the available evidence. | Not established by the available evidence. | A recession emerges (or fear of one rises), invalidating the implicit assumption; correlations and VIX would likely rise, breaking the current regime. | -
Risk Factors (⚠️):
- The entire thesis rests on the absence of recession; any macro data signaling downturn contradicts the creator's claim.
- Creator provides no quantitative evidence for 'low VIX' or 'low correlations' — verification requires market data.
- The assumption that hyperscaler capex proves no recession is an inference; capex could continue even with recession risk if strategic motives dominate.
- The 'last 15 years' reference is unverified and lacks specific data on historical cycle corrections. -
Actionable Trading/Allocation Plan (🎯):
- Monitor VIX level and correlation indices (e.g., average pairwise correlation) to validate 'very low' claims.
- Track hyperscaler quarterly capex spend and balance-sheet leverage as ongoing signals of recession expectations.
- Watch leading economic indicators (yield curve, unemployment claims, PMI) for any sign of recession that would invalidate the 5-year no-recession view.
- Review historical market behavior over the past 15 years to test the claim that non-business-cycle risks are more prominent.

-
Creator Horizon Category (⏱️): Long-Horizon Macro / Structural — The episode addresses long-term US science policy, funding allocation, and competition with China, not short-term technicals.
-
One-Line Thesis (💡): All-In Podcast claims the Trump administration is not anti-science but is redirecting federal science funds away from DEI and climate 'narrative' research toward bold bets (quantum by 2028, fusion by 2035, moon boots in '28), while arguing US science has stagnated (Eroom's Law, aging NIH researchers, foreign STEM PhD dominance) and China is gaining ground.
-
Key Data Points (📊):
- $8B down the drain — cited as waste from DEI grants
- RCP 8.5 pulled — climate scenario removed from consideration
- $47B at NIH — budget figure referenced in context of stagnation
- Golden tickets — NIH funding mechanism mentioned
- Genesis Mission — one of the 'big bold bets' proposed
- Quantum by 2028 — stated goal
- Fusion by 2035 — stated goal
- Boots on the moon in '28 — stated goal
- $33B to $670B — claimed escalation in China-R&D spending comparison
- 7 out of 10 STEM PhDs aren't American — claimed statistic
- Fauci did more damage to science than anyone in modern history — claim
- NIH's median researcher is 71 — claimed statistic -
Technical Levels & Setups OR Macro Drivers (📌):
- Anti-science narrative countered by Nature poll critique and DEI grant waste claims
- Climate emergency narrative collapse via RCP 8.5 removal
- American science stagnation argued via Eroom's Law and NIH age/foreign PhD statistics
- US-China technology race framed by spending differential and STEM talent gap -
Risk/Reward Framework (⚖️):
- Entry: Not established by the available evidence.
- Stop: Not established by the available evidence.
- Targets: Not established by the available evidence.
- Risk/Reward: Not established by the available evidence.
- Position Size: Not established by the available evidence.
- Probability: Not established by the available evidence. -
Scenario Analysis (🔄):
| Scenario | Probability | Target | Trigger |
|---|---|---|---|
| Bull | Not established by the available evidence. | Not established by the available evidence. | Creation of Genesis Mission, quantum by 2028, fusion by 2035, and boots on the moon in '28 proceed as stated and yield breakthroughs. |
| Base | Not established by the available evidence. | Not established by the available evidence. | Funding redirect persists at $47B NIH baseline and Eroom's Law continues without major productivity gains. |
| Bear | Not established by the available evidence. | Not established by the available evidence. | Anti-science perception accelerates US STEM talent outflow (with 7 out of 10 STEM PhDs already foreign) and China's $33B-to-$670B spending gap widens. | -
Risk Factors (⚠️):
- All figures and claims are unverified; no primary sources provided for $8B, $47B, $33B-to-$670B, 7-of-10 foreign PhDs, or NIH median age.
- Anti-science characterization is contested; Nature poll details not shown.
- Future-dated targets (2028, 2035) are speculative and lack baseline metrics.
- Potential omission of countervailing evidence on NIH productivity or China's innovation quality. -
Actionable Trading/Allocation Plan (🎯):
- Cross-check NIH budget and DEI grant figures against official OMB and NIH award databases.
- Verify RCP 8.5 removal via climate modeling agency announcements.
- Monitor China R&D spending via NSF Science & Engineering Indicators and OECD data.
- Track progress on quantum, fusion, and lunar missions through NASA and DOE published milestones.
- Contrast the 'Fauci damage' claim against public health statistics and peer-reviewed evaluations.

-
Creator Horizon Category (⏱️): Long-Horizon Macro — The episode focuses on long-term Treasury yields and S&P 500 valuations, indicating a macro-oriented horizon.
-
One-Line Thesis (💡): Josh Brown and Nick Colas argue that rising long-term Treasury yields—driven by real yields, not inflation—are the key macro variable for stocks, and they discuss S&P 500 valuations, earnings revisions, and three paths to new highs based on DataTrek research.
-
Key Data Points (📊):
- Long-term Treasury yields just keep moving higher — video title and description
- Real yields, not inflation, are driving the move — description
- Higher rates could impact stocks — description
- S&P 500 valuations discussed — description
- Earnings revisions powering this year's gains — description
- Three paths to new highs — description
- DataTrek publishes an S&P 500 fair value grid every 2-3 weeks — chapter marker -
Technical Levels & Setups OR Macro Drivers (📌):
- Rising long-term Treasury yields — from video title and description
- Real yields as the driver of the move, not inflation — from description
- Potential impact of higher rates on stocks — from description
- S&P 500 earnings revisions powering gains — from description
- Three paths to new highs — from description -
Risk/Reward Framework (⚖️):
- Entry: Not established by the available evidence.
- Stop: Not established by the available evidence.
- Targets: Not established by the available evidence.
- Risk/Reward: Not established by the available evidence.
- Position Size: Not established by the available evidence.
- Probability: Not established by the available evidence. -
Scenario Analysis (🔄):
| Scenario | Probability | Target | Trigger |
|---|---|---|---|
| Unavailable | Not established by the available evidence. | Not established by the available evidence. | Verify source evidence. | -
Risk Factors (⚠️):
- Rising long-term Treasury yields could negatively affect stocks — from description
- No specific yield levels, valuation figures, or invalidation thresholds are provided in the metadata — verification gap -
Actionable Trading/Allocation Plan (🎯):
- Monitor DataTrek's S&P 500 fair value grid, published every 2-3 weeks per the chapter marker, for updated valuations
- Watch for the three paths to new highs discussed in the episode to identify specific catalysts
- Track real yields versus inflation expectations to verify the claim that real yields are driving the Treasury move

-
Creator Horizon Category (⏱️): Long-Horizon Macro / Structural — Creator describes a multi-step regulatory-capture process that would structurally favor closed AI models over open-source models.
-
One-Line Thesis (💡): The All-In Podcast creator claims an 'open source ban' is coming via a regulatory-capture process that imposes closed-model safety standards on open models, which cannot comply, and will gradually shut them out.
-
Key Data Points (📊):
- Open source ban is coming — creator asserts regulators will apply same standards to open as closed models
- Trojan horse of a FINRA for AI — self-regulating body, not FDA, as initial step
- Pre-release model testing — standard-setting organization creates this requirement
- Pressure to codify in law — standards eventually become legal mandates
- Open models cannot comply — because they can't be rolled back or monitored on user hardware
- Dario says open models dangerous — creator quotes Dario's rationale
- Dario and OpenAI fund and coordinate — they contribute compute and work with government officials -
Technical Levels & Setups OR Macro Drivers (📌):
- Step-by-step regulatory capture: create self-regulatory body, set standards, codify in law, apply equally to open and closed models
- Technological difference between open and closed models (irreversibility, lack of monitoring) makes compliance impossible for open models
- Government's lack of technical expertise leads them to rely on Dario/OpenAI for standard-setting -
Risk/Reward Framework (⚖️):
- Entry: Not established by the available evidence.
- Stop: Not established by the available evidence.
- Targets: Not established by the available evidence.
- Risk/Reward: Not established by the available evidence.
- Position Size: Not established by the available evidence.
- Probability: Not established by the available evidence. -
Scenario Analysis (🔄):
| Scenario | Probability | Target | Trigger |
|---|---|---|---|
| Bear | Not established by the available evidence. | Not established by the available evidence. | If the standard-setting body sets AI safety standards that cannot be met by open models, and these standards are codified and applied equally, open models will be shut out as predicted. | -
Risk Factors (⚠️):
- Creator's claim is speculative and lacks specific legislative bills or existing regulatory bodies to verify
- No evidence that Dario/OpenAI will actually fund the standard-setting body
- Open models might find technical or legal workarounds to comply — not addressed in evidence
- The 'open source ban' might be resisted by open-source communities or policymakers — not considered in evidence -
Actionable Trading/Allocation Plan (🎯):
- Monitor for formation of any 'FINRA for AI' self-regulatory organization or AI standard-setting body
- Track legislative proposals that apply safety standards equally to open and closed AI models
- Watch public statements from Dario Amodei and OpenAI regarding open-model regulation and funding of safety standards
- Compare compliance requirements in any proposed AI safety regulations between open and closed model architectures

-
Creator Horizon Category (⏱️): Long-Horizon Macro — The episode discusses macro themes such as interest rates, U.S. debt, valuations, AI capex, and decades of market history, indicating a long-term structural focus.
-
One-Line Thesis (💡): The Compound episode 256 claims the stock market's surprising strength is driven by powerful corporate earnings and AI-related tech capex, while bearish skeptics keep moving the goalposts.
-
Key Data Points (📊):
- "surprising strength of the stock market" — headline topic
- "what's keeping the bull market alive" — central question
- "interest rates and the growing U.S. debt load" — macro risks discussed
- "why corporate earnings remain so powerful" — key driver claim
- "whether today's valuations can keep climbing" — valuation debate
- "AI spending and the return on massive tech capex" — catalyst claim
- "market breadth and rotation" — market structure factor
- "the rise of retail investors" — participation trend
- "options-income ETFs" — product trend
- "why bears keep moving the goalposts" — skepticism critique
- "decades of market history" — historical context
- "Sandisk boom" — title claim of an unanticipated rally -
Technical Levels & Setups OR Macro Drivers (📌):
- Corporate earnings strength — cited as a powerful market support
- AI spending and tech capex — discussed as a potential return driver
- Market breadth and rotation — presented as a broadening setup
- Retail investor participation and options-income ETFs — structural demand factors
- Bears moving goalposts — framed as a setup for continued bullishness -
Risk/Reward Framework (⚖️):
- Entry: Not established by the available evidence.
- Stop: Not established by the available evidence.
- Targets: Not established by the available evidence.
- Risk/Reward: Not established by the available evidence.
- Position Size: Not established by the available evidence.
- Probability: Not established by the available evidence. -
Scenario Analysis (🔄):
| Scenario | Probability | Target | Trigger |
|---|---|---|---|
| Bull | Not established by the available evidence. | Not established by the available evidence. | If corporate earnings remain powerful and AI capex delivers returns, as discussed. |
| Base | Not established by the available evidence. | Not established by the available evidence. | If market breadth and rotation continue, as described in the episode. |
| Bear | Not established by the available evidence. | Not established by the available evidence. | If valuations fail to climb or the U.S. debt load becomes a serious burden, per the episode's discussion. | -
Risk Factors (⚠️):
- Interest rates and the growing U.S. debt load could pressure equities.
- Current valuation levels may not persist if earnings growth slows.
- AI spending may not generate the expected returns on tech capex.
- The Sandisk boom is a specific claim that lacks contextual detail in the metadata.
- No quantitative data or verifiable figures are provided in the evidence, limiting independent verification. -
Actionable Trading/Allocation Plan (🎯):
- Monitor quarterly corporate earnings releases to assess the 'powerful earnings' claim.
- Track tech company capex and AI-related investment reports for evidence of return on investment.
- Follow market breadth and rotation indicators (e.g., participation rates, sector returns) to test the episode's claims.
- Review interest rate and U.S. debt load data for potential macro headwinds.
- Investigate the Sandisk boom by checking historical price data and relevant news around the episode's date.
-
Creator Horizon Category (⏱️): Short-Term Technical — The video is a live pre-market technical analysis session for futures and options traders, indicating a short-term trading horizon.
-
One-Line Thesis (💡): The creator claims an 'UGLY open at CRITICAL support' in pre-market technical analysis, but the available metadata provides no specific tickers, levels, or plan.
-
Key Data Points (📊):
- Title claim: 'It's now or never... UGLY open at CRITICAL support' — creator asserts a critical support level and adverse market open.
- Live every trading day at 8:00 AM EST — stated schedule in description.
- Target audience: futures traders and options traders — stated in description.
- Description links to live squawk, technical analysis course, trading scripts, newsletter, Discord, and social media — additional resources offered. -
Technical Levels & Setups OR Macro Drivers (📌):
- No specific drivers or setups are provided in the metadata; the only claim is an 'ugly open' at 'critical support' without specifying asset or level. -
Risk/Reward Framework (⚖️):
- Entry: Not established by the available evidence.
- Stop: Not established by the available evidence.
- Targets: Not established by the available evidence.
- Risk/Reward: Not established by the available evidence.
- Position Size: Not established by the available evidence.
- Probability: Not established by the available evidence. -
Scenario Analysis (🔄):
| Scenario | Probability | Target | Trigger |
|---|---|---|---|
| Unavailable | Not established by the available evidence. | Not established by the available evidence. | Verify source evidence. | -
Risk Factors (⚠️):
- The 'critical support' level is not defined in the metadata; without a specific number, the claim cannot be verified or invalidated.
- The video is live and may include real-time updates or context not captured in the metadata-only evidence. -
Actionable Trading/Allocation Plan (🎯):
- Access the video content to extract the specific ticker, support level, and trading plan mentioned by the creator.
- Check the video description for the live squawk link and technical analysis course to supplement any claims with additional context.

-
Creator Horizon Category (⏱️): Other — The video presents a marketing-message thesis with a single case study, not market timing or macro data.
-
One-Line Thesis (💡): The creator argues that clear, simple messaging ('Kids love aquariums') drives outsized sales growth, citing a test-market 99% increase and projected $100M extra revenue, and that 'don't make people think' is the core principle for business growth.
-
Key Data Points (📊):
- 99% increase in sales — test-market result for the 'Kids love aquariums' message on aquarium products
- Spectrum Brands — private-label parent (per creator) with Remington shavers and a fish-food/aquarium brand
- Alvin Community College, home of the Fighting Dolphins — the creator's own credential used as a humorous contrast to Oxford/Ivy executives
- Three words: 'Kids love aquariums' — the entire message tested -
Technical Levels & Setups OR Macro Drivers (📌):
- Clarity over cleverness: people buy when words quickly solve a perceived problem
- Test in one market before scaling — the creator's recommendation to the client
- Organizational resistance to simple ideas (smart executives ignored the hypothesis)
- The 'don't make people think' mantra as a design filter for all customer-facing communication -
Risk/Reward Framework (⚖️):
- Entry: Not established by the available evidence.
- Stop: Not established by the available evidence.
- Targets: Not established by the available evidence.
- Risk/Reward: Not established by the available evidence.
- Position Size: Not established by the available evidence.
- Probability: Not established by the available evidence. -
Scenario Analysis (🔄):
| Scenario | Probability | Target | Trigger |
|---|---|---|---|
| Bull | Not established by the available evidence. | Not established by the available evidence. | If any consumer brand tests a single clear message and reports a sales increase comparable to the '99%' figure cited in the podcast. |
| Base | Not established by the available evidence. | Not established by the available evidence. | If no independent sales data is published; the claim remains an anecdotal case study. |
| Bear | Not established by the available evidence. | Not established by the available evidence. | If Spectrum Brands or its aquarium division reports no such revenue increase in later filings, contradicting the $100M projection. | -
Risk Factors (⚠️):
- Evidence is a single anecdote from a podcast guest, not audited data
- No company name, ticker, or precise time period given for the test-market results
- Generalization risk: what worked for aquariums may not apply to other product categories or business models
- The $100M figure is an 'at the end of distribution' projection, not a confirmed realized revenue
- No verification exists that the '99% increase' is net of costs or seasonally adjusted -
Actionable Trading/Allocation Plan (🎯):
- Verify the claimed test-market results by checking Spectrum Brands' quarterly/annual revenue disclosures for the aquarium segment (if identifiable)
- Search for any public case study or marketing literature citing 'Kids love aquariums' and the 99% lift
- Monitor the podcast or the creator's website for follow-up evidence or a named company and testing methodology
- Compare the 'three words' approach against standard A/B testing literature to assess plausibility

-
Creator Horizon Category (⏱️): Long-Horizon Macro / Structural — Evidence indicates a discussion of AI and data center contradictions without a defined trading horizon, implying a longer-term structural theme.
-
One-Line Thesis (💡): David Sacks alleges contradictions in Dario's positions on AI and data centers, per the video title.
-
Key Data Points (📊):
- David Sacks calls out Dario's contradictions on AI & data centers — from video title
- All-In Podcast is the creator — from metadata
- Hashtags: #allin #tech #news — from description -
Technical Levels & Setups OR Macro Drivers (📌):
- Public debate over AI infrastructure and data center expansion — implied by title
- Alleged contradictions by Dario (likely Dario Amodei) — as per title -
Risk/Reward Framework (⚖️):
- Entry: Not established by the available evidence.
- Stop: Not established by the available evidence.
- Targets: Not established by the available evidence.
- Risk/Reward: Not established by the available evidence.
- Position Size: Not established by the available evidence.
- Probability: Not established by the available evidence. -
Scenario Analysis (🔄):
| Scenario | Probability | Target | Trigger |
|---|---|---|---|
| Unavailable | Not established by the available evidence. | Not established by the available evidence. | Verify source evidence. | -
Risk Factors (⚠️):
- No transcript or content provided; claims cannot be verified from metadata alone
- Identity of 'Dario' not explicitly confirmed in metadata -
Actionable Trading/Allocation Plan (🎯):
- Watch the full video to extract specific claims and any data points
- Cross-reference with published statements by Dario on AI and data centers

-
Creator Horizon Category (⏱️): Other — Evidence provides no market timeframe; it is an educational resource.
-
One-Line Thesis (💡): The video promotes a free technical analysis education roadmap to simplify a trader's learning journey, with no market-specific claims or data.
-
Key Data Points (📊):
- Free TA education roadmap — https://www.chartguys.com/trading-education-roadmap
- Hashtags: #trading #learntotrade #tradingstrategy -
Technical Levels & Setups OR Macro Drivers (📌):
- Not established by the available evidence. -
Risk/Reward Framework (⚖️):
- Entry: Not established by the available evidence.
- Stop: Not established by the available evidence.
- Targets: Not established by the available evidence.
- Risk/Reward: Not established by the available evidence.
- Position Size: Not established by the available evidence.
- Probability: Not established by the available evidence. -
Scenario Analysis (🔄):
| Scenario | Probability | Target | Trigger |
|---|---|---|---|
| Unavailable | Not established by the available evidence. | Not established by the available evidence. | Verify source evidence. | -
Risk Factors (⚠️):
- No verifiable market claims or parameters provided in the evidence; any trading application is unsubstantiated. -
Actionable Trading/Allocation Plan (🎯):
- Verify the free TA education roadmap at the provided URL for content and applicability.
- Monitor TheChartGuys channel for actual market analysis with specific data.
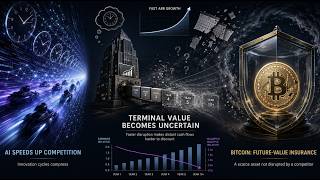
-
Creator Horizon Category (⏱️): Long-Horizon Macro — Creator frames a multi-year structural thesis on Bitcoin as the purest AI trade due to AI-driven terminal value decay, with short-term tape confirmation.
-
One-Line Thesis (💡): The AI Crypto Macro Nexus Point: Bitcoin enters its third-wave adoption phase mirroring AI infrastructure a year ago, because AI agents compress innovation cycles and decay terminal value, making Bitcoin the one asset not disrupted by AI and thus the purest AI trade; a 0% position implies a 0% probability of this thesis.
-
Key Data Points (📊):
- Bitcoin put in three large candles through the 200-day; Ethereum's 200-day turned up; gold and silver joined
- Crypto is a ~$3 trillion odd lot, roughly the size of the Russell 2000
- Stripe acquiring OpenRouter signals guardrails for crypto rails for AI agents
- Micron and IBM 90-day vol spiking while S&P doesn't move has never happened before
- Moderna doubles on mRNA melanoma cancer vaccine; Eli Lilly at new all-time highs
- Bessent is intervening across the yen, changing quarterly refunding language, and publicly quoting Satoshi; Warsh has five task forces built around supply-side deflation
- White House crypto event, pressure on the Clarity Act, and Treasury's Genius Act rulemaking all landed in the same window -
Technical Levels & Setups OR Macro Drivers (📌):
- AI agents compress innovation cycles, decaying terminal value across every public company; DCFs stop working
- Bitcoin as the one asset not disrupted by AI; 0% position implies 0% chance of the thesis
- Endgame bias: Fed hikes, long-rate breakout, oil to 200, AI bubble — all noise; 10-year range-bound means betting on breakout means fighting the government
- Treasury increased nominal liquidity support and yen/BOJ signal were the most important news of the week
- Fed regime change: Besset's Nikkei comments on next chair; Warsh's testimony that supply-side effects on potential output are considerably bigger than near-term capex inflation
- Crypto framed as US financial dominance, not speculation — sovereign debt system permits repeated spending of future time, which Satoshi built Bitcoin to eliminate
- Market structure: tech momentum out of the ICU but won't be healthy for months; Micron/IBM vol spike unprecedented
- Financial rails: Stripe's OpenRouter acquisition creates agent-economy stack — money, compute, tokens, intelligence, revenue; tokens are the new dollar -
Risk/Reward Framework (⚖️):
- Entry: Not established by the available evidence.
- Stop: Not established by the available evidence.
- Targets: Not established by the available evidence.
- Risk/Reward: Not established by the available evidence.
- Position Size: Not established by the available evidence.
- Probability: Not established by the available evidence. -
Scenario Analysis (🔄):
| Scenario | Probability | Target | Trigger |
|---|---|---|---|
| Bull | Not established by the available evidence. | Not established by the available evidence. | Bitcoin's three candles through the 200-day and seven-sigma weekly move match the only two comparable prints in the last decade (April 2019, January 2023) which roughly doubled within two months; Ethereum's 200-day turned up and gold/silver joined. |
| Base | Not established by the available evidence. | Not established by the available evidence. | Bitcoin holds above the 200-day, Ethereum beta leads, but tech momentum remains unhealthy; macro regime supports without explosive upside. |
| Bear | Not established by the available evidence. | Not established by the available evidence. | Endgame bias proves correct: 10-year breaks out of the 4-4.70 range, Fed hikes, oil to 200, AI bubble burst; the tape reverses and invalidates the third-wave adoption thesis. | -
Risk Factors (⚠️):
- 10-year yield breaks out of the 3-year range, invalidating the 'fighting the government' framework
- Bitcoin fails to hold above the 200-day or the seven-sigma move reverses
- Fed/Bessent/Warsh actions diverge from creator's characterization (e.g., no rate cuts, no liquidity support)
- AI bubble narrative dominates and tech momentum deterioration spreads to crypto
- Stripe-OpenRouter integration or White House crypto policy fails to materialize as described -
Actionable Trading/Allocation Plan (🎯):
- Follow Bessent's Treasury refunding language changes, buyback announcements, and any yen intervention
- Watch Warsh's five task forces and testimony on supply-side deflation; monitor Fed nomination signals
- Verify Stripe-OpenRouter acquisition and agent-economy stack developments (money, compute, tokens, intelligence, revenue)
- Assess healthcare/pharma re-rating with Moderna mRNA melanoma vaccine and Eli Lilly as potential index leaders

-
Creator Horizon Category (⏱️): Long-Horizon Macro / Structural — The claim concerns a broad societal and political backlash against AI, indicating a structural shift rather than a short-term market move.
-
One-Line Thesis (💡): Jason Calacanis claims that America is experiencing a backlash against AI, metaphorically described as 'sharpening the guillotines,' implying a severe societal or political reaction.
-
Key Data Points (📊):
- Jason Calacanis — 'They're Sharpening the Guillotines' (from video title)
- America's AI backlash (headline topic)
- Source: All-In Podcast YouTube video (JXnLFsOg-vk) -
Technical Levels & Setups OR Macro Drivers (📌):
- Not established by the available evidence. -
Risk/Reward Framework (⚖️):
- Entry: Not established by the available evidence.
- Stop: Not established by the available evidence.
- Targets: Not established by the available evidence.
- Risk/Reward: Not established by the available evidence.
- Position Size: Not established by the available evidence.
- Probability: Not established by the available evidence. -
Scenario Analysis (🔄):
| Scenario | Probability | Target | Trigger |
|---|---|---|---|
| Unavailable | Not established by the available evidence. | Not established by the available evidence. | Verify source evidence. | -
Risk Factors (⚠️):
- Claim is unverified; no specific data, numbers, or sources provided in the metadata.
- Video content beyond the title is unknown; full context and evidence absent. -
Actionable Trading/Allocation Plan (🎯):
- Retrieve full video transcript or notes to extract specific claims, data, and any referenced tickers or policies.
- Cross-reference with other credible sources on AI backlash to verify the claim and assess its basis.

-
Creator Horizon Category (⏱️): Short-Term Technical — Description references intra-day voice chat, options trading, and technical analysis, indicating a short-term trading focus.
-
One-Line Thesis (💡): Trade Brigade's video 'it's now or never...' claims an urgent trading opportunity, covering technical and fundamental evidence for major indices and a core list of stocks including NVDA, AAPL, MSFT, AMZN, GOOGL, AVGO, META, MU, TSLA, JPM, AMD, and INTC, with additional trade ideas for PLTR, ORCL, NET, and others.
-
Key Data Points (📊):
- Title: 'it's now or never...' — signals urgency
- Segments: S&P 500 (SPY) at 00:50, NASDAQ 100 (QQQ) at 13:15, Russell 2000 (IWM) at 24:30, S&P Sectors at 29:45
- Fundamental Evidence section at 43:50, Technical Evidence section at 48:00
- Core List includes NVDA, AAPL, MSFT, AMZN, GOOGL, AVGO, META, MU, TSLA, JPM, AMD, INTC
- Trade Ideas include PLTR, ORCL, NET, TWLO, FROG, MDB, RBRK, CRWD, PANW, TEAM, SPCX, MRVL, NBIS
- Description includes links to live squawk, trading scripts, technical analysis course, TradeZella discount, Discord, and X (Twitter) -
Technical Levels & Setups OR Macro Drivers (📌):
- Technical analysis of SPY, QQQ, IWM, and S&P sectors (timestamps 00:50–29:45)
- Fundamental evidence section (43:50) and technical evidence section (48:00)
- Core list tickers provide potential setups for established large-cap and tech names
- Trade ideas list offers speculative/technical setups in growth and software names -
Risk/Reward Framework (⚖️):
- Entry: Not established by the available evidence.
- Stop: Not established by the available evidence.
- Targets: Not established by the available evidence.
- Risk/Reward: Not established by the available evidence.
- Position Size: Not established by the available evidence.
- Probability: Not established by the available evidence. -
Scenario Analysis (🔄):
| Scenario | Probability | Target | Trigger |
|---|---|---|---|
| Unavailable | Not established by the available evidence. | Not established by the available evidence. | Verify source evidence. | -
Risk Factors (⚠️):
- No specific price levels, stops, targets, or probabilities provided in available evidence
- Video disclaimer states information is for informational purposes only and not financial advice; creator is not a registered investment advisor
- Actual video content not included in metadata; all claims remain unverified -
Actionable Trading/Allocation Plan (🎯):
- Watch the video's S&P 500 (SPY) analysis at 00:50 and NASDAQ 100 (QQQ) at 13:15 for specific index claims
- Review fundamental evidence section at 43:50 and technical evidence section at 48:00 to extract verifiable claims
- Monitor core list tickers (NVDA, AAPL, MSFT, AMZN, GOOGL, AVGO, META, MU, TSLA, JPM, AMD, INTC) for any mentioned levels or setups
- Check trade ideas (PLTR, ORCL, NET, TWLO, FROG, MDB, RBRK, CRWD, PANW, TEAM, SPCX, MRVL, NBIS) for potential technical patterns

-
Creator Horizon Category (⏱️): Short-Term Technical — The video addresses immediate market reactions to a bond news event and weekly consolidation, indicating a short-term technical focus.
-
One-Line Thesis (💡): Surprise bond news from Bessent triggered rips in metals and crypto, while cancer vaccine news introduced biotech volatility and many markets consolidated weekly.
-
Key Data Points (📊):
- Surprise Bonds news from Bessent — claimed catalyst for market shake-up
- Metals and Crypto rip — claimed response to bond news
- Cancer vaccine news brings Biotech Volatility — claimed sector driver
- Weekly consolidation in many places elsewhere — noted market state
- Title: Bonds Move Shakes Up Markets — headline claim -
Technical Levels & Setups OR Macro Drivers (📌):
- Bessent bond news as macro driver
- Cancer vaccine news as sector-specific catalyst
- Weekly consolidation as prevailing setup in most markets
- Metals and crypto strength as a market response -
Risk/Reward Framework (⚖️):
- Entry: Not established by the available evidence.
- Stop: Not established by the available evidence.
- Targets: Not established by the available evidence.
- Risk/Reward: Not established by the available evidence.
- Position Size: Not established by the available evidence.
- Probability: Not established by the available evidence. -
Scenario Analysis (🔄):
| Scenario | Probability | Target | Trigger |
|---|---|---|---|
| Base | Not established by the available evidence. | Not established by the available evidence. | Weekly consolidation in many places elsewhere | -
Risk Factors (⚠️):
- Specific details of the Bessent bond news are unverified — direction or magnitude of the move is unknown
- No tickers, prices, or levels provided for metals, crypto, or biotech
- Cancer vaccine news is vague and biotech volatility could be in either direction
- Evidence is metadata-only, lacking substantive market data -
Actionable Trading/Allocation Plan (🎯):
- Verify the specific Bessent bond news and its market impact
- Monitor metals and crypto price action for confirmation of the claimed rip
- Track biotech sector volatility following the cancer vaccine news
- Check broader market consolidation patterns across indices

-
Creator Horizon Category (⏱️): Short-Term Technical — The video focuses on S&P 500 range behavior around a major options expiration after a week of Treasury market stress, indicating a short-term trading horizon.
-
One-Line Thesis (💡): The video claims that after a week of historic Treasury action and bond vigilantes, the S&P 500 falls back into the top end of the range that traders were excited about at the beginning of the month, coinciding with a big expiration.
-
Key Data Points (📊):
- Historic Treasury action — cited as the backdrop for the week's market moves
- Bond vigilantes — described as a key macro driver pressuring markets
- S&P 500 falls back into the top end of the range — the index's key technical behavior
- Traders were excited about the range at the beginning of the month — context for market sentiment -
Technical Levels & Setups OR Macro Drivers (📌):
- Historic Treasury action and bond vigilantes — macro pressure on equities
- Big options expiration — likely amplifying volatility and range-bound price action
- S&P 500 re-entering the top end of a previously identified range — technical setup for traders -
Risk/Reward Framework (⚖️):
- Entry: Not established by the available evidence.
- Stop: Not established by the available evidence.
- Targets: Not established by the available evidence.
- Risk/Reward: Not established by the available evidence.
- Position Size: Not established by the available evidence.
- Probability: Not established by the available evidence. -
Scenario Analysis (🔄):
| Scenario | Probability | Target | Trigger |
|---|---|---|---|
| Bull | Not established by the available evidence. | Not established by the available evidence. | S&P 500 breaks and holds above the top end of the range mentioned in the video. |
| Base | Not established by the available evidence. | Not established by the available evidence. | S&P 500 continues to trade within the established range, with the top end acting as resistance as described. |
| Bear | Not established by the available evidence. | Not established by the available evidence. | Continued bond vigilante pressure pushes S&P 500 below the lower end of the range implied by the video's 'top end' reference. | -
Risk Factors (⚠️):
- Continued bond vigilante selling in Treasuries may pressure equities further.
- Options expiration can cause unpredictable volatility and price swings.
- No specific price levels, invalidation points, or stop levels are provided in the evidence, limiting verifiability. -
Actionable Trading/Allocation Plan (🎯):
- Monitor S&P 500 price action relative to the top end of the range cited in the video.
- Watch Treasury yields and bond market moves for signs of ongoing bond vigilante pressure.
- Track the expiration-driven volatility around the August 21 session to assess its impact on range behavior.

-
Creator Horizon Category (⏱️): Long-Horizon Macro — Title and description focus on broad market themes such as bull markets, valuations, recession timing, and structural shifts like money markets and AI, indicating a macro/structural lens.
-
One-Line Thesis (💡): The episode covers a wide set of macro and market topics — including one of the greatest bull markets, falling valuations, young people gambling, financial nihilism, the next recession, $3 trillion in money markets, bond yields competing with stocks, AI outcomes, NHL ETFs, renting vs. buying, rich sports owners in trouble, and blackjack — with the title question framing a comedic comparison to Olive Garden.
-
Key Data Points (📊):
- $3 trillion in money markets — cited as a topic of discussion in the episode description
- One of the greatest bull markets of all time — discussed as a claim in the episode
- Falling valuations — discussed as a topic
- Next recession — discussed as a topic
- Bond yields compete with stocks — discussed as a topic
- AI outcomes — debated as a topic
- NHL ETFs — discussed as a topic
- Renting vs. buying — discussed as a topic
- Rich sports owners in trouble — discussed as a topic
- Breaking even at the blackjack table — discussed as a topic -
Technical Levels & Setups OR Macro Drivers (📌):
- Money market assets at $3 trillion may signal cash on sidelines or competition with equities.
- Falling valuations suggest possible market correction or normalization after a strong bull run.
- Bond yields competing with stocks implies a shift in risk/reward dynamics.
- Young people gambling and financial nihilism point to sentiment and behavior shifts that could affect market participation.
- Debate on AI outcomes introduces uncertainty around productivity and earnings.
- NHL ETFs and sports team financial distress are niche structural topics.
- Renting vs. buying debate ties to housing market conditions and consumer balance sheets. -
Risk/Reward Framework (⚖️):
- Entry: Not established by the available evidence.
- Stop: Not established by the available evidence.
- Targets: Not established by the available evidence.
- Risk/Reward: Not established by the available evidence.
- Position Size: Not established by the available evidence.
- Probability: Not established by the available evidence. -
Scenario Analysis (🔄):
| Scenario | Probability | Target | Trigger |
|---|---|---|---|
| Bull | Not established by the available evidence. | Not established by the available evidence. | If the 'greatest bull markets of all time' narrative continues and money markets rotate into equities, valuations may persist or expand. |
| Base | Not established by the available evidence. | Not established by the available evidence. | Market continues with mixed signals — falling valuations, bond competition, and AI uncertainty offset each other. |
| Bear | Not established by the available evidence. | Not established by the available evidence. | A recession occurs, exacerbated by financial nihilism and young people's gambling behavior, leading to further valuation decline. | -
Risk Factors (⚠️):
- Lack of transcript means all specific claims, figures, and recommendations are unverified beyond the description and title.
- The $3 trillion money market figure is cited without source or date context.
- No tickers, levels, or portfolio implications are provided in the metadata.
- The comedic title may not reflect literal analytical content.
- No disclosure of positions or specific investment theses beyond topic list. -
Actionable Trading/Allocation Plan (🎯):
- Watch the full episode to extract specific data points on money markets, valuations, and AI.
- Verify the $3 trillion money market figure against official sources (e.g., Fed, ICI).
- Monitor bond yields relative to equity dividend yields for the 'compete with stocks' discussion.
- Track recession indicators discussed in the episode for forward validation.
- Review any NHL ETF or sports-team commentary for specific tickers or structural details.

-
Creator Horizon Category (⏱️): Long-Horizon Macro — The video analyzes the global bond selloff, yield curve dynamics, Big Tech AI capex, and enterprise SaaS bottoming — all macro/structural themes, not short-term trades.
-
One-Line Thesis (💡): The Compound's Josh Brown and Michael Batnick examine an unusually resilient bull market amid a global bond selloff where pressure has shifted to long-term rates, Big Tech's off-balance-sheet AI commitments, a potential enterprise SaaS bottom (via Workday takeover reports), and Bill Ackman's move toward permanent capital.
-
Key Data Points (📊):
- Global bond selloff — pressure shifted from front end of yield curve to long-term rates
- Big Tech — 'massive off-balance-sheet AI commitments' — not quantified
- Enterprise SaaS — 'whether the bottom is finally in' following Workday takeover reports
- Market — 'a market that keeps going all the way up'
- Pershing Square — Bill Ackman's 'evolving' empire and 'search for permanent capital' -
Technical Levels & Setups OR Macro Drivers (📌):
- Pressure shift in yield curve from front end to long-term rates is a stated driver of the bond selloff
- Big Tech's off-balance-sheet AI commitments are presented as a potential risk/structural shift
- Workday takeover reports are the catalyst for the enterprise SaaS bottom debate
- Pershing Square's permanent capital search is framed as a structural evolution -
Risk/Reward Framework (⚖️):
- Entry: Not established by the available evidence.
- Stop: Not established by the available evidence.
- Targets: Not established by the available evidence.
- Risk/Reward: Not established by the available evidence.
- Position Size: Not established by the available evidence.
- Probability: Not established by the available evidence. -
Scenario Analysis (🔄):
| Scenario | Probability | Target | Trigger |
|---|---|---|---|
| Bull | Not established by the available evidence. | Not established by the available evidence. | Workday takeover reports confirm bottom in enterprise SaaS |
| Base | Not established by the available evidence. | Not established by the available evidence. | Market keeps going all the way up despite bond selloff |
| Bear | Not established by the available evidence. | Not established by the available evidence. | Global bond selloff intensifies, pressure on long-term rates | -
Risk Factors (⚠️):
- Long-term rate pressure could destabilize equity valuations
- Big Tech off-balance-sheet AI commitments may create hidden leverage
- Workday takeover reports may be unconfirmed or fail to close
- Pershing Square's permanent capital shift could introduce new structural risks -
Actionable Trading/Allocation Plan (🎯):
- Monitor long-term U.S. Treasury yields for sustained upward pressure
- Review Big Tech quarterly filings for AI capex and off-balance-sheet disclosures
- Track Workday acquisition news flow to assess enterprise SaaS sentiment
- Watch Pershing Square capital structure announcements for permanent capital moves
-
Creator Horizon Category (⏱️): Other — Metadata provides no temporal horizon for the discussion.
-
One-Line Thesis (💡): Michael Santoli's TCAF Episode 256, titled 'How to Play the Money Game', is a podcast discussion, but the metadata contains no specific investment thesis, tickers, or market views.
-
Key Data Points (📊):
- Michael Santoli is the featured guest on TCAF Episode 256
- The episode is titled 'How to Play the Money Game' -
Technical Levels & Setups OR Macro Drivers (📌):
- Not established by the available evidence. -
Risk/Reward Framework (⚖️):
- Entry: Not established by the available evidence.
- Stop: Not established by the available evidence.
- Targets: Not established by the available evidence.
- Risk/Reward: Not established by the available evidence.
- Position Size: Not established by the available evidence.
- Probability: Not established by the available evidence. -
Scenario Analysis (🔄):
| Scenario | Probability | Target | Trigger |
|---|---|---|---|
| Unavailable | Not established by the available evidence. | Not established by the available evidence. | Verify source evidence. | -
Risk Factors (⚠️):
- No content beyond metadata; specific market risks and invalidation triggers are unverifiable. -
Actionable Trading/Allocation Plan (🎯):
- Obtain the full episode transcript or summary to extract specific claims.
- Review The Compound's disclaimers for context on non-personalized advice.

-
Creator Horizon Category (⏱️): Long-Horizon Macro — Discusses AI regulatory capture, data center backlash, open source ban risk, and midterm election dynamics, all structural/macro themes.
-
One-Line Thesis (💡): The All-In Podcast covers Dario's two-part essay on regulatory capture and doomerism, AI self-regulatory organization (SRO) models (FINRA vs MPAA), potential open source bans, a DOJ investigation of a16z, and midterm polling/socialism surge narratives.
-
Key Data Points (📊):
- Dario's two-part essay: regulatory capture, doomerism, and data center backlash — at 00:13
- FINRA for AI vs MPAA for AI: SROs, thinking tokens, and the 'DMV for AI' — at 10:25
- Is an open source ban coming? Harnesses, FDI, jobs, and recursive self-improvement — at 30:12
- a16z under DOJ investigation over 'interlocking directorates' — at 56:33
- Midterms: broken polls, the socialism surge, and CATO's DSA price tag — at 1:01:15
- All-In Summit | September 13-15 — event promotion -
Technical Levels & Setups OR Macro Drivers (📌):
- AI regulatory capture and data center backlash as central themes (00:13)
- SRO (FINRA/MPAA) analogies for AI governance and 'thinking tokens' concept (10:25)
- Potential open source AI ban risk with FDI, jobs, and recursive self-improvement angles (30:12)
- DOJ investigation of a16z for interlocking directorates (56:33)
- Midterm election dynamics: broken polls, socialism surge, and CATO's DSA price tag (1:01:15) -
Risk/Reward Framework (⚖️):
- Entry: Not established by the available evidence.
- Stop: Not established by the available evidence.
- Targets: Not established by the available evidence.
- Risk/Reward: Not established by the available evidence.
- Position Size: Not established by the available evidence.
- Probability: Not established by the available evidence. -
Scenario Analysis (🔄):
| Scenario | Probability | Target | Trigger |
|---|---|---|---|
| Unavailable | Not established by the available evidence. | Not established by the available evidence. | Verify source evidence. | -
Risk Factors (⚠️):
- Metadata-only evidence lacks substantive claims; all topics require full video transcript for verification.
- No specific data, prices, or probabilities provided in metadata.
- Creator claims may be unverified or contested; independent fact-checking needed for each segment. -
Actionable Trading/Allocation Plan (🎯):
- Review the video segment on FINRA vs MPAA for AI (10:25) to extract specific SRO proposals and 'thinking tokens' mechanism.
- Monitor a16z DOJ investigation coverage (56:33) for legal filings or official statements.
- Track midterm polling data and CATO's DSA price tag (1:01:15) against public sources.
- Seek the transcript of the Dario essay segment (00:13) to evaluate regulatory capture and data center backlash arguments.
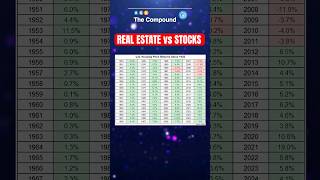
-
Creator Horizon Category (⏱️): Long-Horizon Macro — The episode addresses long-term investing topics such as market crashes, longevity risk, stocks vs real estate, and inflation's impact on sustainable spending rates, indicating a macro/long-horizon perspective.
-
One-Line Thesis (💡): Ben Carlson and Duncan Hill discuss whether market crashes are a thing of the past, how to plan for longevity risk, the relative merits of stocks versus real estate, communicating about finances with aging parents, and the effect of inflation on sustainable spending rates.
-
Key Data Points (📊):
- Episode 236 of Ask The Compound — featuring Ben Carlson and Duncan Hill
- Topics: market crashes, longevity risk, stocks vs. real estate, talking finances with aging parents, inflation impacts on sustainable spending rates
- Video title: 'Real Estate vs Stocks' — indicates a comparison between the two asset classes -
Technical Levels & Setups OR Macro Drivers (📌):
- Discussion of whether market crashes are a thing of the past — likely context for improving market resilience and investor behavior
- Planning for longevity risk — may involve asset allocation and withdrawal strategies
- Stocks vs. real estate comparison — likely covers returns, volatility, liquidity, and diversification -
Risk/Reward Framework (⚖️):
- Entry: Not established by the available evidence.
- Stop: Not established by the available evidence.
- Targets: Not established by the available evidence.
- Risk/Reward: Not established by the available evidence.
- Position Size: Not established by the available evidence.
- Probability: Not established by the available evidence. -
Scenario Analysis (🔄):
| Scenario | Probability | Target | Trigger |
|---|---|---|---|
| Unavailable | Not established by the available evidence. | Not established by the available evidence. | Verify source evidence. | -
Risk Factors (⚠️):
- No specific market or portfolio risks are stated in the available metadata-only evidence.
- All claims and discussions are unverified without full transcript or audio content. -
Actionable Trading/Allocation Plan (🎯):
- Watch or listen to the full episode to extract any specific data points, backtested numbers, or personal finance recommendations.
- Verify the official disclaimers and disclosures linked in the video description to understand the context and limitations of the discussion.
- Cross-check any claims about stock vs real estate returns, inflation, or spending rates against independent historical data sources.

-
Creator Horizon Category (⏱️): Other — The evidence concerns an investment decision-making process (pre-mortem analysis) rather than a market horizon, making it structural/process-oriented.
-
One-Line Thesis (💡): Paul Johnson describes how a pre-mortem exercise before a project launch revealed that a team leader who believed he had considered everything had anticipated only one of the five path-critical risks, demonstrating the value of cognitive diversity in risk identification.
-
Key Data Points (📊):
- Paul Johnson is a former investor, longtime finance professor at Columbia Business School, and co-author of Pitch the Perfect Investment.
- Full episode: EP.109 with Gary Klein, Paul Johnson & Paul Sonkin on Conducting Pre-Mortem Analysis. -
Technical Levels & Setups OR Macro Drivers (📌):
- Pre-mortem analysis as a structured tool to surface risks before project launch.
- Cognitive diversity: multiple participants contribute independent risk perspectives.
- Team leader overconfidence as a baseline failure mode that pre-mortem mitigates. -
Risk/Reward Framework (⚖️):
- Entry: Not established by the available evidence.
- Stop: Not established by the available evidence.
- Targets: Not established by the available evidence.
- Risk/Reward: Not established by the available evidence.
- Position Size: Not established by the available evidence.
- Probability: Not established by the available evidence. -
Scenario Analysis (🔄):
| Scenario | Probability | Target | Trigger |
|---|---|---|---|
| Bull | Not established by the available evidence. | Not established by the available evidence. | If pre-mortem systematically surfaces path-critical risks that a leader would otherwise miss, decision quality improves. |
| Base | Not established by the available evidence. | Not established by the available evidence. | Pre-mortem yields a mix of trivial and critical risks; the process is useful but not a panacea. |
| Bear | Not established by the available evidence. | Not established by the available evidence. | If pre-mortem participants anchor to known risks or cascade, the exercise may fail to surface truly novel path-critical risks. | -
Risk Factors (⚠️):
- Evidence is metadata-only; no full transcript or quantitative investment data is provided.
- No specific market, security, or financial metrics are mentioned in the evidence.
- The anecdote is a single case study and may not generalize to all project or investment contexts.
- Verification requires accessing the full Capital Allocators episode or transcript. -
Actionable Trading/Allocation Plan (🎯):
- Listen to the full episode EP.109 (Best of Pre-Mortem Analysis) on Capital Allocators to capture additional context and methodology.
- Review the pre-mortem process described by Johnson, Klein, and Sonkin to understand implementation steps.
- Cross-reference the book Pitch the Perfect Investment for any formal frameworks related to pre-mortem analysis.
- Monitor Capital Allocators transcripts for any quantitative follow-up data on pre-mortem effectiveness.

-
Creator Horizon Category (⏱️): Long-Horizon Macro — The episode discusses structural themes such as U.S. debt, interest rates, AI spending, and long-term market history, indicating a multi-year macro outlook.
-
One-Line Thesis (💡): The bull market remains supported by powerful corporate earnings and AI-driven tech spending despite concerns over interest rates, growing U.S. debt, and elevated valuations.
-
Key Data Points (📊):
- Surprising strength of the stock market — discussed as a key theme
- Growing U.S. debt load — cited as a macro concern
- Corporate earnings remain powerful — cited as a bull-market driver
- AI spending and massive tech capex — discussed regarding return on investment
- Market breadth and rotation — discussed as important market dynamics
- Rise of retail investors — discussed
- Options-income ETFs — discussed
- Bears keep moving goalposts — critique of bear-case logic
- Decades of market history — used to teach adaptation when old rules stop working
- Interest rates — discussed as a factor affecting valuations and debt -
Technical Levels & Setups OR Macro Drivers (📌):
- Strong corporate earnings
- AI spending and massive tech capex
- Market breadth and rotation
- Retail investor participation
- Managed futures ETF (DBMF) as a diversification tool
- Historical market patterns -
Risk/Reward Framework (⚖️):
- Entry: Not established by the available evidence.
- Stop: Not established by the available evidence.
- Targets: Not established by the available evidence.
- Risk/Reward: Not established by the available evidence.
- Position Size: Not established by the available evidence.
- Probability: Not established by the available evidence. -
Scenario Analysis (🔄):
| Scenario | Probability | Target | Trigger |
|---|---|---|---|
| Bull | Not established by the available evidence. | Not established by the available evidence. | If corporate earnings continue to grow and AI spending delivers sufficient returns, valuations may keep climbing. |
| Base | Not established by the available evidence. | Not established by the available evidence. | If interest rates remain steady and debt concerns do not escalate, the market may continue with rotation and broadening breadth. |
| Bear | Not established by the available evidence. | Not established by the available evidence. | If growing U.S. debt or elevated interest rates undermine earnings, or if AI capital expenditures fail to generate returns, valuations may compress. | -
Risk Factors (⚠️):
- U.S. debt load growth
- Interest rate changes
- AI spending without adequate return on investment
- Market breadth deterioration
- Bear case shifting goalposts (i.e., new bear arguments) -
Actionable Trading/Allocation Plan (🎯):
- Monitor quarterly earnings reports for corporate profit growth
- Track Federal Reserve interest rate decisions
- Assess tech company AI capex announcements and any disclosed return metrics
- Watch market breadth indicators for evidence of rotation and participation
- Review U.S. Treasury debt issuance and interest expense data
- Evaluate performance of options-income ETFs and managed futures ETF (DBMF) as potential portfolio diversifiers

-
Creator Horizon Category (⏱️): Short-Term Technical — Video is a Midweek Market Update focused on technical analysis of indices (SPY, QQQ, IWM) and stocks for options trading.
-
One-Line Thesis (💡): The video's headline claim is 'The AI Trade Is FAILING', with the creator reviewing indices, sectors, fundamental/technical evidence, a core list (NVDA, AAPL, MSFT, AMZN, GOOGL, AVGO, META, TSLA, JPM, MU, AMD, INTC) and trade ideas (MDB, RBRK, SMCI, LUNR, ORCL, DAVE) to provide an actionable game plan.
-
Key Data Points (📊):
- Headline claim: 'The AI Trade Is FAILING' — creator's assertion, untested
- Core list tickers: NVDA, AAPL, MSFT, AMZN, GOOGL, AVGO, META, TSLA, JPM, MU, AMD, INTC
- Trade ideas tickers: MDB, RBRK, SMCI, LUNR, ORCL, DAVE
- Market review chapters: SPY (01:00), QQQ (12:00), IWM (19:15), S&P Sectors (22:30), Fundamental Evidence (37:45), Technical Evidence (39:30)
- Focus: 'best stocks for options trading' and 'key levels of support and resistance'
- Offers: live chat, trading scripts, technical analysis course, 20% off TradeZella (code 'TB') -
Technical Levels & Setups OR Macro Drivers (📌):
- Creator reviews key support and resistance levels for SPY, QQQ, IWM
- Creator presents S&P sector analysis
- Creator separates Fundamental Evidence and Technical Evidence sections
- Creator provides a core list and trade ideas for options trading
- Video positions as a 'Midweek Market Update' with an actionable plan -
Risk/Reward Framework (⚖️):
- Entry: Not established by the available evidence.
- Stop: Not established by the available evidence.
- Targets: Not established by the available evidence.
- Risk/Reward: Not established by the available evidence.
- Position Size: Not established by the available evidence.
- Probability: Not established by the available evidence. -
Scenario Analysis (🔄):
| Scenario | Probability | Target | Trigger |
|---|---|---|---|
| Unavailable | Not established by the available evidence. | Not established by the available evidence. | Verify source evidence. | -
Risk Factors (⚠️):
- Claim 'AI trade is failing' is unsupported without watching the video; no specific levels or analysis in metadata
- No entries, stops, targets, or probabilities provided in metadata
- Video includes explicit disclaimer: information is for informational purposes only and not financial advice
- Creator is not a Registered Investment Advisor -
Actionable Trading/Allocation Plan (🎯):
- Watch the video's Fundamental Evidence and Technical Evidence sections to verify the 'AI trade failing' claim
- Review SPY, QQQ, and IWM chapters for stated support/resistance levels
- Check the core list and trade ideas for any explicit entry/exit parameters
- Verify the affiliate links and disclaimers before treating any content as advice

-
Creator Horizon Category (⏱️): Short-Term Technical — Description indicates evaluation of market rotational scenarios and metals bull thesis, focusing on near-term market health.
-
One-Line Thesis (💡): The creator claims to evaluate the metals bull thesis and market rotational scenarios, with the video title asserting a potential crypto explosion and a cancer cure breakthrough.
-
Key Data Points (📊):
- Title claim: 'Cancer Cured? Crypto Explodes!' — sensational headline for the video
- Metals bull thesis — stated as being checked by Joey
- Different rotational scenarios — described as pinned down to evaluate market health
- Joey Twitter handle @junglefunk_ — cited in description -
Technical Levels & Setups OR Macro Drivers (📌):
- Metals bull thesis — primary macro driver examined by Joey
- Rotational scenarios — used to evaluate market health and strategize -
Risk/Reward Framework (⚖️):
- Entry: Not established by the available evidence.
- Stop: Not established by the available evidence.
- Targets: Not established by the available evidence.
- Risk/Reward: Not established by the available evidence.
- Position Size: Not established by the available evidence.
- Probability: Not established by the available evidence. -
Scenario Analysis (🔄):
| Scenario | Probability | Target | Trigger |
|---|---|---|---|
| Unavailable | Not established by the available evidence. | Not established by the available evidence. | Verify source evidence. | -
Risk Factors (⚠️):
- No specific tickers, levels, or numeric data are present in the metadata, limiting verification
- Title's claims of a cancer cure and crypto explosion are unverified and likely sensational -
Actionable Trading/Allocation Plan (🎯):
- Review the full video to extract any stated tickers, price levels, or risk parameters
- Monitor TheChartGuys channel for subsequent analysis building on the described rotational scenarios

-
Creator Horizon Category (⏱️): Long-Horizon Macro — The episode addresses long-horizon macro topics such as bull markets, valuations, recession risk, and bond yields, with no short-term technical setup.
-
One-Line Thesis (💡): In episode 478, Michael Batnick and Ben Carlson discuss the current bull market, falling valuations, young investor gambling and financial nihilism, the next recession, $3 trillion in money markets, bond yields competing with stocks, AI outcomes, NHL ETFs, renting vs. buying, and sports owners' finances.
-
Key Data Points (📊):
- $3 trillion in money markets — cited as a discussion topic
- Episode 478 — podcast episode identifier
- One of the greatest bull markets of all time — stated as discussion theme
- Falling valuations — discussed as market condition
- Bond yields compete with stocks — discussed as market dynamic -
Technical Levels & Setups OR Macro Drivers (📌):
- Youth gambling and financial nihilism as behavioral market drivers
- Potential next recession as macro risk factor
- AI outcomes as debated market catalyst
- Renting vs. buying as real estate decision context
- NHL ETFs as niche product discussion -
Risk/Reward Framework (⚖️):
- Entry: Not established by the available evidence.
- Stop: Not established by the available evidence.
- Targets: Not established by the available evidence.
- Risk/Reward: Not established by the available evidence.
- Position Size: Not established by the available evidence.
- Probability: Not established by the available evidence. -
Scenario Analysis (🔄):
| Scenario | Probability | Target | Trigger |
|---|---|---|---|
| Bull | Not established by the available evidence. | Not established by the available evidence. | Creator describes the current period as 'one of the greatest bull markets of all time'. |
| Base | Not established by the available evidence. | Not established by the available evidence. | Creator discusses both falling valuations and money market cash alongside bond yield competition. |
| Bear | Not established by the available evidence. | Not established by the available evidence. | Creator discusses 'the next recession' and 'financial nihilism'. | -
Risk Factors (⚠️):
- Specific quantitative claims are not available from metadata; need full episode transcript.
- No ticker, level, or valuation figures are stated in the available evidence.
- The $3 trillion money market figure must be verified against current Federal Reserve or ICI data. -
Actionable Trading/Allocation Plan (🎯):
- Obtain full episode transcript to extract specific numbers and claims.
- Verify the $3 trillion money market figure against current data.
- Monitor subsequent market valuations and recession indicators discussed in the episode.

-
Creator Horizon Category (⏱️): Short-Term Technical — Video is a live trading stream focused on imminent earnings (TJX, TGT) and current options sentiment (put mania), indicating a short-term technical trading horizon.
-
One-Line Thesis (💡): The creator claims TJX and TGT earnings will define staples and the consumer, while noting markets are not expecting a big move despite rising put mania; the video title also headline-catalyzes a Moderna (MRNA) breakthrough and a 'Bessent pump'.
-
Key Data Points (📊):
- 'MRNA BREAKTHROUGH' — headline claim in video title, no details provided in description
- 'BESSENT PUMP' — headline claim in video title, no details provided in description
- TJX & TGT earnings will define staples and the consumer — from description
- Markets aren't expecting a big move despite put mania on the rise again — from description
- Stream is educational, not financial advice — from description/disclaimer -
Technical Levels & Setups OR Macro Drivers (📌):
- TJX and TGT earnings as sector-defining catalysts for staples and consumer outlook
- Rising put mania as a sentiment indicator without a predicted market move
- MRNA breakthrough as a potential catalyst (specifics not given)
- Bessent pump as a potential catalyst (specifics not given) -
Risk/Reward Framework (⚖️):
- Entry: Not established by the available evidence.
- Stop: Not established by the available evidence.
- Targets: Not established by the available evidence.
- Risk/Reward: Not established by the available evidence.
- Position Size: Not established by the available evidence.
- Probability: Not established by the available evidence. -
Scenario Analysis (🔄):
| Scenario | Probability | Target | Trigger |
|---|---|---|---|
| Unavailable | Not established by the available evidence. | Not established by the available evidence. | Verify source evidence. | -
Risk Factors (⚠️):
- Creator's headline claims (MRNA breakthrough, Bessent pump) lack supporting data in the description, leaving them unverified
- No concrete market levels, entry points, or risk parameters are provided in the evidence
- Put mania may indicate elevated downside risk, but no probabilistic assessment is given -
Actionable Trading/Allocation Plan (🎯):
- Monitor TJX and TGT earnings reports for actual results vs. market expectations
- Verify rising put mania by checking options flow or put/call data
- Search for official statements on MRNA breakthrough and Bessent pump to substantiate the video's headline claims

-
Creator Horizon Category (⏱️): Long-Horizon Macro — The video discusses structural questions about market crashes, longevity risk, and long-term spending rates, implying a long-term macro investment horizon.
-
One-Line Thesis (💡): The video, hosted by Ben Carlson and Duncan Hill, explores whether stock market crashes are a thing of the past and addresses longevity risk planning, stocks vs. real estate comparisons, financial conversations with aging parents, and inflation's impact on sustainable spending rates.
-
Key Data Points (📊):
- Market crashes may be a thing of the past — video title
- Longevity risk planning — topic from description
- Stocks vs. real estate — topic from description
- Financial conversations with aging parents — topic from description
- Inflation impact on sustainable spending rates — topic from description -
Technical Levels & Setups OR Macro Drivers (📌):
- The hosts discuss whether structural changes make crash recurrence less likely — topic, not specific trigger
- Inflation is examined as a factor affecting sustainable spending rules — topic -
Risk/Reward Framework (⚖️):
- Entry: Not established by the available evidence.
- Stop: Not established by the available evidence.
- Targets: Not established by the available evidence.
- Risk/Reward: Not established by the available evidence.
- Position Size: Not established by the available evidence.
- Probability: Not established by the available evidence. -
Scenario Analysis (🔄):
| Scenario | Probability | Target | Trigger |
|---|---|---|---|
| Unavailable | Not established by the available evidence. | Not established by the available evidence. | Verify source evidence. | -
Risk Factors (⚠️):
- Evidence is metadata-only; the description provides no quantitative claims or specific historical data, limiting verifiability.
- The video is sponsored by Betterment Advisor Solutions, which may be an unstated conflict of interest.
- The hosts are employees of Ritholtz Wealth Management and may hold positions, as disclosed, but their specific views are not available from metadata. -
Actionable Trading/Allocation Plan (🎯):
- Access the full video transcript to extract actual historical crash statistics, spending-rate data, and any portfolio recommendations.
- Verify the hosts' claims about inflation and sustainable withdrawal rates against independent research.
- Monitor the discussion for any specific tickers, price levels, or probability estimates, which are absent from the metadata.

-
Creator Horizon Category (⏱️): Other — Evidence is metadata-only with no substantive financial content; horizon cannot be determined.
-
One-Line Thesis (💡): The video title claims a 'Massive Advantage of Unmanned Warships' but the provided evidence is metadata-only and contains no financial thesis, catalysts, or analysis.
-
Key Data Points (📊):
- Video title: 'Saronic CTO: The Massive Advantage of Unmanned Warships' — topic claim without supporting data in evidence
- Sponsors: Creative Planning, Northwest Registered Agent — advertising presence, no investment relevance -
Technical Levels & Setups OR Macro Drivers (📌):
- Not established by the available evidence. -
Risk/Reward Framework (⚖️):
- Entry: Not established by the available evidence.
- Stop: Not established by the available evidence.
- Targets: Not established by the available evidence.
- Risk/Reward: Not established by the available evidence.
- Position Size: Not established by the available evidence.
- Probability: Not established by the available evidence. -
Scenario Analysis (🔄):
| Scenario | Probability | Target | Trigger |
|---|---|---|---|
| Unavailable | Not established by the available evidence. | Not established by the available evidence. | Verify source evidence. | -
Risk Factors (⚠️):
- Evidence lacks transcript or substantive creator claims, making any verification of the 'massive advantage' thesis impossible
- No tickers, levels, valuations, or macro references are present in the provided metadata -
Actionable Trading/Allocation Plan (🎯):
- Obtain full transcript or watch the video to extract actual claims about unmanned warships and any financial implications
- Cross-reference with Saronic Technologies (private company) disclosures or defense industry reports to validate any stated advantages
- Monitor All-In Podcast subsequent content for follow-up on unmanned warship investment themes

-
Creator Horizon Category (⏱️): Long-Horizon Macro / Structural — The evidence concerns a decision-making and risk-assessment technique with long-term organizational applicability, not market timing or price action.
-
One-Line Thesis (💡): Gary Klein and Paul Sonkin claim that a true pre-mortem reframes the question from 'what might go wrong' to an imagined crystal-ball failure, leveraging prospective hindsight, and that most teams miss this subtle shift, draining the method's power.
-
Key Data Points (📊):
- Pre-mortem method pioneered by cognitive psychologist Gary Klein — reframing risk assessment
- Crystal-ball framing: imagine the plan has already failed — grounded in prospective hindsight research
- Paul Sonkin: the small framing change is what most teams get wrong — quietly draining method power
- Co-authored paper by Klein and Sonkin on misuse of pre-mortem on Wall Street — context for the technique's failure modes
- Full episode: 'Gary Klein, Paul Johnson & Paul Sonkin: Conducting Pre-Mortem Analysis (EP.109)' — source of the clip -
Technical Levels & Setups OR Macro Drivers (📌):
- The reframing itself is the core driver: asking 'what will go wrong' vs. 'it has failed — why?'
- Prospective hindsight research underpins the claimed effectiveness of the pre-mortem framing
- Wall Street misuse (as described by Sonkin) is a setup for why teams underutilize the method -
Risk/Reward Framework (⚖️):
- Entry: Not established by the available evidence.
- Stop: Not established by the available evidence.
- Targets: Not established by the available evidence.
- Risk/Reward: Not established by the available evidence.
- Position Size: Not established by the available evidence.
- Probability: Not established by the available evidence. -
Scenario Analysis (🔄):
| Scenario | Probability | Target | Trigger |
|---|---|---|---|
| Unavailable | Not established by the available evidence. | Not established by the available evidence. | Verify source evidence. | -
Risk Factors (⚠️):
- Evidence is metadata-only; no empirical validation of the pre-mortem's effectiveness is provided in the clip description
- The claim relies on the credibility of Klein and Sonkin; no independent verification of 'prospective hindsight' research is cited
- The reframing may be oversimplified in the short clip; full context requires the original episode -
Actionable Trading/Allocation Plan (🎯):
- Listen to the full Capital Allocators episode (EP.109) to capture the complete pre-mortem discussion
- Read the co-authored paper by Klein and Sonkin on Wall Street misuse to verify the claims
- Test the crystal-ball reframing in a team decision context to observe whether it changes the quality of risk identification

-
Creator Horizon Category (⏱️): Long-Horizon Macro / Structural — The episode headline and section focus on debating long-term AI outcomes and market structure (money markets, bond yields vs. stocks), indicating a structural rather than short-term technical horizon.
-
One-Line Thesis (💡): The video presents 'the best bear case on AI' amid broader macro topics including falling valuations, $3 trillion in money markets, bond yields competing with stocks, and financial nihilism among young people.
-
Key Data Points (📊):
- $3 trillion in money markets — cited as a current market figure
- 'One of the greatest bull markets of all time' — claim made about current market environment
- 'Falling valuations' — discussed without specific numbers
- 'Bond yields compete with stocks' — presented as a macro theme
- 'Debating AI outcomes' — explicit debate topic
- 'NHL ETFs' — mentioned but no specific fund or ticker
- 'Renting vs. buying' — real estate discussion
- 'Rich sports owners in trouble' — noted in storytime segment -
Technical Levels & Setups OR Macro Drivers (📌):
- Bear case on AI driven by potential valuation compression and competition from bond yields
- High money market balances ($3T) as potential dry powder or signal of investor caution
- Young people gambling and financial nihilism — behavioral/demographic driver
- Next recession discussion — cyclical risk overhang -
Risk/Reward Framework (⚖️):
- Entry: Not established by the available evidence.
- Stop: Not established by the available evidence.
- Targets: Not established by the available evidence.
- Risk/Reward: Not established by the available evidence.
- Position Size: Not established by the available evidence.
- Probability: Not established by the available evidence. -
Scenario Analysis (🔄):
| Scenario | Probability | Target | Trigger |
|---|---|---|---|
| Bull | Not established by the available evidence. | Not established by the available evidence. | Creator says 'debating AI outcomes' — bull scenario would require AI productivity gains to outpace bearish concerns; specifics not in evidence. |
| Base | Not established by the available evidence. | Not established by the available evidence. | Current market conditions discussed (bull market, falling valuations, $3T money markets) persist; no explicit base-case trigger given. |
| Bear | Not established by the available evidence. | Not established by the available evidence. | The episode title and content focus on the best bear case on AI; specific bear triggers (e.g., valuation compression, bond yield competition) are mentioned qualitatively but lack numerical thresholds. | -
Risk Factors (⚠️):
- All market claims are qualitative — no specific valuations, levels, or thresholds are provided
- No tickers or position details are disclosed
- The '$3 trillion in money markets' figure lacks a date or source context
- The episode is a podcast discussion, not a formal analysis; statements are opinions of the hosts
- The sponsor (YCharts) relationship may introduce promotional bias -
Actionable Trading/Allocation Plan (🎯):
- Watch the full episode to extract specific bear-case arguments on AI and any quantitative claims (e.g., valuation metrics, yield thresholds)
- Verify the '$3 trillion in money markets' figure against current Federal Reserve or industry data
- Monitor the debate on bond yields vs. stock earnings yields for potential inflection points
- Check NHL ETF mentions for any specific tickers or product names in the full transcript
- Review the hosts' disclosures to identify any positions in discussed securities
- Summarize the 'young people gamble / financial nihilism' discussion as a behavioral risk indicator for retail flows

-
Creator Horizon Category (⏱️): Short-Term Technical — The creator focuses on a technical tightening pattern in BTC ahead of a scheduled crypto White House meeting the following day.
-
One-Line Thesis (💡): The creator claims BTC strength is building into a crypto White House meeting, with a tightening 3D equilibrium on BTC while simultaneously checking the NASDAQ and alt coin positioning.
-
Key Data Points (📊):
- BTC 3D equilibrium tightens — technical setup noted
- Crypto White House meeting scheduled for the day after publication — event catalyst
- NASDAQ and alt coins referenced as part of broader market check
- BTC strength claimed in title — directional bias -
Technical Levels & Setups OR Macro Drivers (📌):
- Technical setup: tightening 3D equilibrium on BTC suggests an impending directional move
- Market scope: NASDAQ and alt coins are included in the analysis, indicating cross-market context -
Risk/Reward Framework (⚖️):
- Entry: Not established by the available evidence.
- Stop: Not established by the available evidence.
- Targets: Not established by the available evidence.
- Risk/Reward: Not established by the available evidence.
- Position Size: Not established by the available evidence.
- Probability: Not established by the available evidence. -
Scenario Analysis (🔄):
| Scenario | Probability | Target | Trigger |
|---|---|---|---|
| Unavailable | Not established by the available evidence. | Not established by the available evidence. | Verify source evidence. | -
Risk Factors (⚠️):
- Missing verification: No specific entry, stop, or target levels are provided in the available evidence.
- Event risk: The crypto White House meeting outcome is unknown and could move BTC in either direction.
- Technical invalidation: If BTC 3D equilibrium resolves to the downside, the discussed strength could fail. -
Actionable Trading/Allocation Plan (🎯):
- Monitor BTC price action relative to the 3D equilibrium range ahead of the White House meeting.
- Track NASDAQ and alt coins as referenced in the description.
- Verify the exact meeting time and outcome from official sources.
-
Creator Horizon Category (⏱️): Long-Horizon Macro — The video discusses long-term rates, bond selloff, and structural shifts in media and tech, but no specific trading horizon is given; the content spans macro and company-specific structural questions.
-
One-Line Thesis (💡): The Compound's video asks whether Spotify will be the first media company to hit 1 billion subscribers, while also covering the global bond selloff, long-term rate pressure, Big Tech off-balance-sheet AI commitments, the potential bottom in enterprise SaaS after Workday takeover reports, an ongoing market rally, and Bill Ackman's search for permanent capital at Pershing Square.
-
Key Data Points (📊):
- Spotify as potential first media company to 1 billion subscribers — headline question
- Global bond selloff with pressure shifting from front end to long-term rates — claimed by hosts
- Big Tech massive off-balance-sheet AI commitments — claimed by hosts
- Enterprise SaaS bottom possibly after Workday takeover reports — hosts discuss
- Market that keeps going all the way up — hosts' characterization
- Bill Ackman's Pershing Square evolving and searching for permanent capital — hosts discuss -
Technical Levels & Setups OR Macro Drivers (📌):
- Bond selloff: hosts break down what's driving it and shift to long-term rates
- AI commitments: Big Tech's off-balance-sheet commitments as potential driver
- SaaS bottom: Workday takeover reports as possible signal for a bottom
- Market rally: persistence of an upward market
- Pershing Square: evolution and permanent capital search -
Risk/Reward Framework (⚖️):
- Entry: Not established by the available evidence.
- Stop: Not established by the available evidence.
- Targets: Not established by the available evidence.
- Risk/Reward: Not established by the available evidence.
- Position Size: Not established by the available evidence.
- Probability: Not established by the available evidence. -
Scenario Analysis (🔄):
| Scenario | Probability | Target | Trigger |
|---|---|---|---|
| Unavailable | Not established by the available evidence. | Not established by the available evidence. | Verify source evidence. | -
Risk Factors (⚠️):
- No specific data, prices, or targets are provided in the evidence; all claims are qualitative.
- The video does not provide verifiable numbers for subscriber counts, yields, or AI commitments.
- The hosts may hold positions in discussed securities, per disclaimer. -
Actionable Trading/Allocation Plan (🎯):
- Verify Spotify's subscriber counts from its quarterly earnings reports.
- Track Big Tech earnings or filings for off-balance-sheet AI commitments.
- Follow Workday takeover news to assess SaaS sector bottom.
- Review Pershing Square's capital structure for permanent capital moves.
-
Creator Horizon Category (⏱️): Long-Horizon Macro — Video discusses a 19-year high in Treasury yields, global bond selloff, and structural shifts in long-term rates, AI commitments, and permanent capital.
-
One-Line Thesis (💡): Josh Brown and Michael Batnick break down the global bond selloff that broke a 19-year high in long-term Treasury yields, shifting pressure from the front end to long-term rates, alongside Big Tech's off-balance-sheet AI commitments, Workday takeover reports, and Bill Ackman's search for permanent capital.
-
Key Data Points (📊):
- Treasury Bond Yields Break a 19-Year High — title claim
- Long-term bond yields are climbing around the world — description
- Pressure has shifted from the front end of the yield curve to long-term rates — description
- Big Tech's massive off-balance-sheet AI commitments — segment title
- Workday takeover reports — segment title
- Bill Ackman's evolving Pershing Square empire and his search for permanent capital — segment title
- The market keeps going all the way up — segment title -
Technical Levels & Setups OR Macro Drivers (📌):
- Global bond selloff zeroing in on countries with the most debt and political dysfunction — description
- Pressure shift from front-end to long-term rates — description
- Big Tech off-balance-sheet AI commitments — segment title
- Enterprise SaaS bottom after Workday takeover reports — description
- Ackman seeking permanent capital — segment title -
Risk/Reward Framework (⚖️):
- Entry: Not established by the available evidence.
- Stop: Not established by the available evidence.
- Targets: Not established by the available evidence.
- Risk/Reward: Not established by the available evidence.
- Position Size: Not established by the available evidence.
- Probability: Not established by the available evidence. -
Scenario Analysis (🔄):
| Scenario | Probability | Target | Trigger |
|---|---|---|---|
| Unavailable | Not established by the available evidence. | Not established by the available evidence. | Verify source evidence. | -
Risk Factors (⚠️):
- Exact yield levels and market data are not provided in the metadata; only thematic claims.
- No specific tickers or company names are listed in the description, limiting verification.
- No entry, stop, or target levels are disclosed; risk/reward is not quantified. -
Actionable Trading/Allocation Plan (🎯):
- Watch the video segments to extract the specific yield breakdown and 19-year high level.
- Verify the off-balance-sheet AI commitments by identifying the Big Tech companies mentioned in the 'Off-Balance Sheet Insanity' segment.
- Follow up on the Workday takeover reports to confirm the acquirer and terms.
- Research Bill Ackman's permanent capital structure as discussed in the 'How to invest with Bill Ackman' segment.

-
Creator Horizon Category (⏱️): Other — The evidence is metadata-only; no investment horizon is stated.
-
One-Line Thesis (💡): The video is a flashback featuring Josh Brown, with no stated financial thesis, catalyst, ticker, or valuation in the available evidence.
-
Key Data Points (📊):
- Not established by the available evidence. -
Technical Levels & Setups OR Macro Drivers (📌):
- Not established by the available evidence. -
Risk/Reward Framework (⚖️):
- Entry: Not established by the available evidence.
- Stop: Not established by the available evidence.
- Targets: Not established by the available evidence.
- Risk/Reward: Not established by the available evidence.
- Position Size: Not established by the available evidence.
- Probability: Not established by the available evidence. -
Scenario Analysis (🔄):
| Scenario | Probability | Target | Trigger |
|---|---|---|---|
| Unavailable | Not established by the available evidence. | Not established by the available evidence. | Verify source evidence. | -
Risk Factors (⚠️):
- Not established by the available evidence. -
Actionable Trading/Allocation Plan (🎯):
- Verify whether the video content contains financial discussion or disclosures absent from the metadata.

-
Creator Horizon Category (⏱️): Long-Horizon Macro / Structural — Evidence covers Flock's data retention policy, police misuse audits, and city-level re-adoption, indicating long-term business and regulatory dynamics.
-
One-Line Thesis (💡): Flock CEO Garret Langley claims a 7-day license plate data retention solves 90% of crimes, that an internal audit tool exposed misuse leading to 9 Georgia officers fired, and that despite a PR crisis with morale and churn, 20 cities are re-adopting cameras.
-
Key Data Points (📊):
- 7 days — license plate data retention solves 90% of crimes
- 9 Georgia officers — fired after Flock's audit tool exposed misuse
- 20 cities — turning Flock cameras back on
- 90% — of crimes solved with 7-day retention per Flock CEO
- Flock's PR crisis — internal morale, churn, and city backlash -
Technical Levels & Setups OR Macro Drivers (📌):
- License plate data retention policy as core operational lever
- Flock's audit tool as trust/reputation mechanism for police accountability
- 20 cities re-adopting cameras — potential positive inflection signal
- PR crisis and churn — key risk factor to monitor
- Avoidance of predictive policing and facial recognition — regulatory positioning -
Risk/Reward Framework (⚖️):
- Entry: Not established by the available evidence.
- Stop: Not established by the available evidence.
- Targets: Not established by the available evidence.
- Risk/Reward: Not established by the available evidence.
- Position Size: Not established by the available evidence.
- Probability: Not established by the available evidence. -
Scenario Analysis (🔄):
| Scenario | Probability | Target | Trigger |
|---|---|---|---|
| Bull | Not established by the available evidence. | Not established by the available evidence. | 20 cities turning cameras back on and continued adoption growth |
| Base | Not established by the available evidence. | Not established by the available evidence. | 7-day retention policy remains and crime-solving rate persists |
| Bear | Not established by the available evidence. | Not established by the available evidence. | Internal morale and churn persist or privacy backlash expands | -
Risk Factors (⚠️):
- Privacy backlash could lead to more cities banning or restricting Flock cameras
- Police misuse incidents may recur despite audit tool, causing reputational damage
- Regulatory changes on facial recognition or predictive policing could constrain product scope
- Data retention policy claims (7 days/90% crimes) lack independent verification in evidence -
Actionable Trading/Allocation Plan (🎯):
- Verify Flock's public statements on retention and crime-solving rates against independent data
- Track city-level adoption and revocation decisions for Flock cameras
- Monitor news on police misconduct audits and officer firings linked to Flock tools
- Follow Flock's PR statements on internal morale, churn, and city re-adoption

-
Creator Horizon Category (⏱️): Short-Term Technical — The stream focuses on imminent retail earnings and same-week 13F digestion, indicating a short-term trading horizon.
-
One-Line Thesis (💡): The creator states that markets are preparing for a slew of retail earnings from names like TJX and HD, while digesting weekend 13F filings to identify top themes and losers.
-
Key Data Points (📊):
- Slew of retail earnings from names like TJX, HD & many more — described as upcoming catalyst
- 13F's over the weekend are being digested — top themes and losers emerging
- Live trading stream on E*TRADE, ThinkOrSwim, Fidelity — used by creator
- Disclaimer: Option trading is risky, potential loss of most or all initial investment
- Hashtags: #stockmarket #Investing #stocks #livetrading #Trading #fomc -
Technical Levels & Setups OR Macro Drivers (📌):
- Retail earnings reports (TJX, HD, and others) as near-term stock-specific catalysts
- 13F filings from institutional investors as broader market theme and positioning signals
- Live trading session with real-time commentary and viewer Q&A -
Risk/Reward Framework (⚖️):
- Entry: Not established by the available evidence.
- Stop: Not established by the available evidence.
- Targets: Not established by the available evidence.
- Risk/Reward: Not established by the available evidence.
- Position Size: Not established by the available evidence.
- Probability: Not established by the available evidence. -
Scenario Analysis (🔄):
| Scenario | Probability | Target | Trigger |
|---|---|---|---|
| Unavailable | Not established by the available evidence. | Not established by the available evidence. | Verify source evidence. | -
Risk Factors (⚠️):
- Creator's disclaimer warns options trading is risky and may result in loss of most or all of initial investment
- No specific earnings expectations, 13F holdings, or price levels provided in metadata — verification requires later data
- 13F filings are backward-looking and may not reflect current positions -
Actionable Trading/Allocation Plan (🎯):
- Monitor upcoming earnings announcements from TJX and HD for actual results versus expectations
- Review recent 13F filings from major institutional investors to identify top themes and losers
- Watch the stream for live trading setups and further commentary on retail earnings and 13F impacts

-
Creator Horizon Category (⏱️): Other — Content concerns decision-making methodology under uncertainty, not a market horizon.
-
One-Line Thesis (💡): Gary Klein recounts a pre-mortem exercise that surfaced a critical observation from the most junior participant, forcing abandonment of a flawed Air Force software plan and enabling salvage of the project.
-
Key Data Points (📊):
- Four decades studying expert decision-making under uncertainty — attributed to Gary Klein
- Pioneered naturalistic decision making and the pre-mortem method of risk assessment — attributed to Gary Klein
- Air Force software project was heading toward failure — anecdote
- Most junior person (an IT officer who had not spoken) raised the one observation in the pre-mortem that forced scrapping of a flawed plan and salvaged the effort — anecdote
- Full episode: Gary Klein, Paul Johnson & Paul Sonkin: Conducting Pre-Mortem Analysis (EP.109) — podcast reference -
Technical Levels & Setups OR Macro Drivers (📌):
- Pre-mortem method as a structured risk-identification technique
- Junior participant's unique observation as the catalyst for plan revision -
Risk/Reward Framework (⚖️):
- Entry: Not established by the available evidence.
- Stop: Not established by the available evidence.
- Targets: Not established by the available evidence.
- Risk/Reward: Not established by the available evidence.
- Position Size: Not established by the available evidence.
- Probability: Not established by the available evidence. -
Scenario Analysis (🔄):
| Scenario | Probability | Target | Trigger |
|---|---|---|---|
| Unavailable | Not established by the available evidence. | Not established by the available evidence. | Verify source evidence. | -
Risk Factors (⚠️):
- Anecdotal, retrospective account without independent verification
- No quantitative or market-specific data provided
- Claims about effectiveness of pre-mortem are not supported with empirical metrics in this excerpt -
Actionable Trading/Allocation Plan (🎯):
- Verify pre-mortem methodology against Klein's published academic work
- Listen to the full episode EP.109 for additional context and possible case specifics
- Cross-check the Air Force project anecdote with any available public record or case study

-
Creator Horizon Category (⏱️): Long-Horizon Macro / Structural — The video addresses long-term structural questions (AI-driven career preparation, homeownership affordability, early retirement) rather than market timing or technical setups.
-
One-Line Thesis (💡): Episode 234 of Ask The Compound covers five wealth-management themes: advice to younger selves, renting vs buying in expensive markets, AI-readiness for young professionals, dangers of leverage/margin, and ultra-frugal early retirement—each framed as a planning question without specific market calls.
-
Key Data Points (📊):
- Episode 234 of Ask The Compound — hosts Ben Carlson, Duncan Hill, Jack Raines
- Financial advice to younger selves — discussed as a core topic
- Renting vs buying in a high-cost housing market — no specific market figures given
- AI-driven future preparation for students/young professionals — structural career advice
- Margin investing and leverage — described as 'more dangerous than they appear'
- Ultra-frugal living + off-grid compounding as a path to financial independence — viability questioned -
Technical Levels & Setups OR Macro Drivers (📌):
- Housing affordability pressure as a generational planning issue
- AI disruption as a labor-market and career-planning catalyst
- Behavioral risks of leverage and margin in retail portfolios
- Frugality and compounding as a possible early-retirement mechanism -
Risk/Reward Framework (⚖️):
- Entry: Not established by the available evidence.
- Stop: Not established by the available evidence.
- Targets: Not established by the available evidence.
- Risk/Reward: Not established by the available evidence.
- Position Size: Not established by the available evidence.
- Probability: Not established by the available evidence. -
Scenario Analysis (🔄):
| Scenario | Probability | Target | Trigger |
|---|---|---|---|
| Unavailable | Not established by the available evidence. | Not established by the available evidence. | Verify source evidence. | -
Risk Factors (⚠️):
- No specific securities, prices, or probabilities are given, so any quantitative risk/reward is unverifiable from this metadata
- Creator claims are limited to topic descriptions; specific advice depends on the full video content not provided here
- General discussion of margin and AI may be misread as actionable without watching the full episode -
Actionable Trading/Allocation Plan (🎯):
- Verify the episode's actual discussion by watching or reading the transcript for specific statements on housing, AI, margin, and frugality
- Monitor The Compound's podcast feeds for the full episode to extract any concrete data points or case studies
- Cross-check the hosts' prior public commentary on leverage and homeownership to assess consistency

-
Creator Horizon Category (⏱️): Long-Horizon Macro / Structural — Video covers AI-driven market leadership, emerging market valuations, and long-term behavioral investing topics rather than short-term technical setups.
-
One-Line Thesis (💡): The Compound's Michael Batnick and Ben Carlson discuss the market at all-time highs driven by AI as the dominant investment theme, with side topics on cheap emerging markets, historical crash comparisons, and behavioral finance issues.
-
Key Data Points (📊):
- New all-time highs in the stock market — discussed as current market state
- AI is the only thing that matters — framed as the central market narrative
- Emerging markets are cheap — valuation claim without specific metrics
- 1987 crash calls — historical crash comparisons brought up
- Day trading is hard — behavioral observation
- How often you should check your portfolio — portfolio management topic
- Early retirement — long-term planning topic
- Housing market recessions — macro/real estate topic
- Things rich people and poor people have in common — wealth behavior topic -
Technical Levels & Setups OR Macro Drivers (📌):
- AI as the primary market driver — context is all-time highs in stock indices
- Emerging markets positioned as cheap relative to developed markets — no specific valuation multiples given
- Historical 1987 crash references suggest concern about possible market correction
- Behavioral topics (day trading difficulty, portfolio check frequency) imply retail risk awareness -
Risk/Reward Framework (⚖️):
- Entry: Not established by the available evidence.
- Stop: Not established by the available evidence.
- Targets: Not established by the available evidence.
- Risk/Reward: Not established by the available evidence.
- Position Size: Not established by the available evidence.
- Probability: Not established by the available evidence. -
Scenario Analysis (🔄):
| Scenario | Probability | Target | Trigger |
|---|---|---|---|
| Bull | Not established by the available evidence. | Not established by the available evidence. | Creator discusses new all-time highs in the stock market as a current condition, implying ongoing bull momentum. |
| Base | Not established by the available evidence. | Not established by the available evidence. | Creator discusses emerging markets being cheap, suggesting potential rotation or value opportunity without a definitive market call. |
| Bear | Not established by the available evidence. | Not established by the available evidence. | Creator discusses 1987 crash calls, referencing historical market crashes as a plausible risk scenario. | -
Risk Factors (⚠️):
- Metadata only — no specific price levels, dates, or valuation figures provided to verify claims
- AI dominance could reverse if earnings or sentiment shift, but no invalidation level given
- Emerging market cheapness may persist due to structural risks not covered in metadata
- Crash calls might be hypothetical or contrarian, lacking explicit probability or trigger
- Behavioral topics are general, not actionable for specific portfolio changes -
Actionable Trading/Allocation Plan (🎯):
- Monitor major stock indices for continuation of all-time highs and any breach of prior support
- Track AI-related sector performance and concentration metrics to assess the 'AI is the only thing that matters' thesis
- Review emerging market valuation ratios (e.g., P/E, P/B) against developed markets to verify the 'cheap' claim
- Identify whether the 1987 crash references are tied to any current market indicator or are merely historical context
- Assess portfolio check frequency and day trading difficulty claims against behavioral finance literature for validity
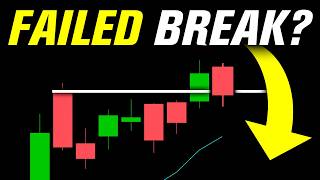
-
Creator Horizon Category (⏱️): Short-Term Technical — The video is a live intra-day voice chat focused on technical analysis of indices and stocks, implying a short-term technical horizon.
-
One-Line Thesis (💡): The video headlines a potential failed all-time high breakout and segments analysis across SPY, QQQ, IWM, S&P sectors, and a core list of tech/growth stocks, alongside fundamental and technical evidence sections.
-
Key Data Points (📊):
- Failed All Time High Breakout? — headline question
- SPY, QQQ, IWM — index ETFs covered in separate segments
- Core list: NVDA, AAPL, MSFT, AMZN, GOOGL, AVGO, META, MU, TSLA, JPM, AMD, INTC
- Trade ideas: ANET, GWRE, TXG, RDDT, TER, CRDO, STX, FPS
- Sections for Fundamental Evidence and Technical Evidence
- Options trading and technical analysis as explicit topics -
Technical Levels & Setups OR Macro Drivers (📌):
- Potential failed breakout at all-time highs as the central setup
- Index analysis (SPY, QQQ, IWM) and S&P sector rotations
- Core list of individual stocks and trade ideas as specific focus names -
Risk/Reward Framework (⚖️):
- Entry: Not established by the available evidence.
- Stop: Not established by the available evidence.
- Targets: Not established by the available evidence.
- Risk/Reward: Not established by the available evidence.
- Position Size: Not established by the available evidence.
- Probability: Not established by the available evidence. -
Scenario Analysis (🔄):
| Scenario | Probability | Target | Trigger |
|---|---|---|---|
| Unavailable | Not established by the available evidence. | Not established by the available evidence. | Verify source evidence. | -
Risk Factors (⚠️):
- No specific price levels, stop-losses, targets, or probabilities are provided in the metadata-only evidence; external price data is required to verify the failed breakout claim.
- The video's actual analysis content is not captured in the evidence, limiting verification of any stated catalysts or setups. -
Actionable Trading/Allocation Plan (🎯):
- Monitor the video's timestamped sections for the creator's specific technical levels and analysis.
- Verify whether the indices mentioned have indeed failed to break their all-time highs using current price charts.
- Review the fundamental and technical evidence sections for any quantifiable support or invalidation of the breakout-failure premise.

-
Creator Horizon Category (⏱️): Long-Horizon Macro / Structural — AI's compression of time and insatiable compute demand are presented as multi-year structural forces that break traditional year-over-year frameworks.
-
One-Line Thesis (💡): The creator argues that compute demand is structurally insatiable because AI agents never sleep, compressing time and breaking traditional year-over-year frameworks, with global earnings breaking out (earnings +51%, sales +15%, global EPS +47%) despite zero hiring, making AI a cross-sector productivity wave rather than a sector bubble.
-
Key Data Points (📊):
- S&P +40bps, IWM and Qs +1%, AI thematic portfolio +3% for the week; most major global indices at new all-time highs — weekly recap
- Earnings growth 51%, sales +15% y/y, global EPS +47% — 'not an isolated U.S. tech bubble'
- Aggregate weekly payrolls weakest six-month rate of change since 2012; participation keeps sliding — creator claims productivity boom over hiring
- Compute step function: chatbots need base level; coding agents need 10-100x more; enterprise/consumer agents, autonomous driving, world models, humanoids need another step up
- Apollo, BlackRock, Blackstone, Brookfield, Goldman, KKR building $500B+ financing platforms; Morgan Stanley has $1.5T initiative
- CoreWeave: A100s from 2020 contracted through 2029 and sold out; useful life expectations shifted from 2-3 years to 6-9 years
- Google may become 'OPEC of compute' with capex at documented 30% ROIC — creator's regime-change thesis
- SpaceX may add 6-8 GW of incremental data centers in 2027, possibly above 10, much for space-based capacity
- YTD: Nasdaq +20%, 100-name AI portfolio +46%, 25-name +74%, 10-name +94%; average forward PEG near 0.8
- Figure's consumer loan marketplace volume $4.3B, up 132% y/y, with tokenized on-chain marketplace nearing 70% of volume; stablecoin card spending rose another 16%
- China added 20 tons of gold in July (largest since Oct 2023); Korea resumed buying after 13 years; dollar at new lows, gold/silver moved, Bitcoin has not
- Creator's positioning: 'Structurally bullish compute, tactically cautious into the parabolic exhaustion, constructive near capitulation' -
Technical Levels & Setups OR Macro Drivers (📌):
- AI compressing time: agents don't sleep or stop working, making 'year-over-year' a human measurement applied to a non-human workforce
- Earnings compound at 30%+ while hiring is roughly zero; prior bubbles had over-hiring, this one has productivity
- Compute demand is structural, like food demand; billions of agents coming online need tokens; 2027 becomes the year of consumer agents
- Capital flooding into AI infrastructure via $500B+ platforms and $1.5T initiative; memory remains the real bottleneck
- Physical compute now has scarcity value — A100s contracted through 2029, useful life extended
- Google's shift from frontier-model prestige to infrastructure economics (30% ROIC) could make it the OPEC of compute
- SpaceX adding orbital compute capacity (6-8 GW+ in 2027)
- AI is not a sector; it cuts across industrials, materials, chemicals, energy, power, semis
- Crypto rails (payment, settlement, stablecoins, tokenization) become bigger as consumer agents need financial infrastructure
- Labor data: aggregate weekly payrolls weakest since 2012; job creation concentrated in healthcare and leisure; PCE core inflation outlier — academics anchored to old frameworks -
Risk/Reward Framework (⚖️):
- Entry: Not established by the available evidence.
- Stop: Not established by the available evidence.
- Targets: Not established by the available evidence.
- Risk/Reward: Not established by the available evidence.
- Position Size: Not established by the available evidence.
- Probability: Not established by the available evidence. -
Scenario Analysis (🔄):
| Scenario | Probability | Target | Trigger |
|---|---|---|---|
| Bull | Not established by the available evidence. | Not established by the available evidence. | Compute demand remains insatiable; 2027 becomes the year of consumer agents; global earnings breakout continues at 30%+ compounding with zero hiring; AI infrastructure investment ($500B+ platforms, $1.5T initiative) delivers on ROIC. |
| Base | Not established by the available evidence. | Not established by the available evidence. | Creator's stated tactical stance: 'tactically cautious into the parabolic exhaustion, constructive near capitulation' — implying a pullback/correction in AI-themed names before further advance. |
| Bear | Not established by the available evidence. | Not established by the available evidence. | Aggregate weekly payrolls weakest six-month rate of change since 2012 and sliding participation persist; academic Fed stays anchored to old frameworks, misreading AI-driven productivity and potentially over-tightening; financial constraints emerge as compute demand outstrips capital; memory bottleneck or physical limits trigger a supply shock. | -
Risk Factors (⚠️):
- Memory bottleneck remains the real constraint on compute scaling
- Financial limits could become the next binding constraint (payment rails, settlement, stablecoins, tokenization) — not purely physical
- Academic Fed anchored to old frameworks may misinterpret AI's productivity and labor effects, leading to policy errors
- Aggregate weekly payrolls weakest since 2012 and sliding participation — consumer spending and earnings may weaken if wages stagnate
- Parabolic exhaustion in AI-themed portfolios (10-name +94% YTD) could lead to sharp tactical drawdowns
- SpaceX's orbital data center buildout (6-8 GW+ in 2027) may face technical or regulatory delays
- Google's capex shift to infrastructure economics (30% ROIC) is unverified — high-variance model development could disrupt that thesis -
Actionable Trading/Allocation Plan (🎯):
- Monitor CoreWeave's A100 contract durations and utilization rates to verify scarcity value claims
- Track aggregate weekly payrolls and participation rate for continued weakness or inflection
- Watch Google's quarterly capex disclosures and ROIC commentary to validate the 'OPEC of compute' shift
- Follow SpaceX data center announcements and launch cadence for 2027 capacity buildout
- Track stablecoin card spending growth and Figure's tokenized marketplace volume as proxy for AI-agent payment rail adoption
- Review weekly AI portfolio performance (100-name +46%, 25-name +74%, 10-name +94%) vs. Nasdaq for momentum exhaustion signals
- Verify China's gold purchases and Korea's resumed buying as indicators of the debasement trade's progress
- Compare creator's 'structural bullish, tactical cautious' stance against market breadth and sentiment indicators to time entry/exit

-
Creator Horizon Category (⏱️): Long-Horizon Macro / Structural — The title frames AI centralization as a danger, indicating a long-horizon structural concern rather than a short-term trade.
-
One-Line Thesis (💡): Gavin Baker (via All-In Podcast title) claims that AI is too dangerous to centralize, implying a structural argument against concentrated AI control.
-
Key Data Points (📊):
- AI is too dangerous to centralize — title claim -
Technical Levels & Setups OR Macro Drivers (📌):
- Not established by the available evidence. -
Risk/Reward Framework (⚖️):
- Entry: Not established by the available evidence.
- Stop: Not established by the available evidence.
- Targets: Not established by the available evidence.
- Risk/Reward: Not established by the available evidence.
- Position Size: Not established by the available evidence.
- Probability: Not established by the available evidence. -
Scenario Analysis (🔄):
| Scenario | Probability | Target | Trigger |
|---|---|---|---|
| Unavailable | Not established by the available evidence. | Not established by the available evidence. | Verify source evidence. | -
Risk Factors (⚠️):
- No evidence beyond title and metadata; full content and specific claims unverified. -
Actionable Trading/Allocation Plan (🎯):
- Verify the full episode content for detailed arguments, data, and any specific tickers or policy implications.
- Monitor All-In Podcast official channels for show notes or transcripts.

-
Creator Horizon Category (⏱️): Long-Horizon Macro / Structural — Title posits Anthropic as a potential last company, implying a long-term, systemic claim about AI industry dominance.
-
One-Line Thesis (💡): The video title claims Anthropic believes it could become the world's last company, implying a structurally dominant or terminal role for the AI firm.
-
Key Data Points (📊):
- Title: 'Anthropic Thinks It Could Be the WORLD'S LAST COMPANY!?' — literal headline claim
- Channel: All-In Podcast — source attribution -
Technical Levels & Setups OR Macro Drivers (📌):
- Not established by the available evidence. -
Risk/Reward Framework (⚖️):
- Entry: Not established by the available evidence.
- Stop: Not established by the available evidence.
- Targets: Not established by the available evidence.
- Risk/Reward: Not established by the available evidence.
- Position Size: Not established by the available evidence.
- Probability: Not established by the available evidence. -
Scenario Analysis (🔄):
| Scenario | Probability | Target | Trigger |
|---|---|---|---|
| Unavailable | Not established by the available evidence. | Not established by the available evidence. | Verify source evidence. | -
Risk Factors (⚠️):
- Not established by the available evidence. -
Actionable Trading/Allocation Plan (🎯):
- Retrieve the full video transcript to extract specific claims about Anthropic's market position, valuations, or catalysts.
- Cross-check Anthropic's public statements or investor materials against the video's assertions.

-
Creator Horizon Category (⏱️): Short-Term Technical — The video focuses on establishing trading guides for indices and sectors, indicating a near-term tactical approach.
-
One-Line Thesis (💡): TheChartGuys plan to define clear 'full bull control' levels for indices and major sectors, while highlighting memory, neoclouds, and photonics as key volatility drivers, and the title signals a continuation of memory-led upside.
-
Key Data Points (📊):
- Title 'Memory Bulls Follow Higher' — suggests memory sector momentum continues upward
- Description mentions 'clear "full bull control" guides for indices and some major sectors' — indicates planned technical levels
- Description states 'Memory, neoclouds, photonics bring the volatility' — identifies three high-volatility themes -
Technical Levels & Setups OR Macro Drivers (📌):
- Creator intends to provide 'full bull control' guides that define bullish dominance for indices and sectors
- Memory, neoclouds, and photonics are cited as volatility sources, likely driving trading setups -
Risk/Reward Framework (⚖️):
- Entry: Not established by the available evidence.
- Stop: Not established by the available evidence.
- Targets: Not established by the available evidence.
- Risk/Reward: Not established by the available evidence.
- Position Size: Not established by the available evidence.
- Probability: Not established by the available evidence. -
Scenario Analysis (🔄):
| Scenario | Probability | Target | Trigger |
|---|---|---|---|
| Bull | Not established by the available evidence. | Not established by the available evidence. | If the 'full bull control' guides hold and memory/neoclouds/photonics remain strong, upside continuation is consistent with the title. |
| Base | Not established by the available evidence. | Not established by the available evidence. | If indices and sectors oscillate around the guides without clear breakouts or breakdowns, a sideways range may persist. |
| Bear | Not established by the available evidence. | Not established by the available evidence. | If the 'full bull control' guides are decisively broken or volatility in memory/neoclouds/photonics reverses, downside risk increases. | -
Risk Factors (⚠️):
- Exact 'full bull control' levels are not provided in the available evidence, so the video content must be reviewed for specific numbers.
- High volatility in memory, neoclouds, and photonics could invalidate any fixed guides quickly. -
Actionable Trading/Allocation Plan (🎯):
- Extract the specific index and sector levels referenced as 'full bull control' guides from the video.
- Monitor price action and volatility in memory, neoclouds, and photonics names to assess alignment with the creator's described setup.

-
Creator Horizon Category (⏱️): Long-Horizon Macro / Structural — The video analyzes long-term shifts in ETF flows, product innovation, and investor allocation patterns rather than short-term price moves.
-
One-Line Thesis (💡): The episode argues that the ETF market is in a record-breaking boom, with thematic, leveraged, buffer, and option-income products gaining traction, while investor money rotates toward AI/compute, crypto, healthcare, and small caps, and trillions still sit in retail money-market funds — with the industry debating whether a $1 billion AUM threshold now defines a fund that matters and what Wall Street might package into an ETF next.
-
Key Data Points (📊):
- Record-breaking ETF boom — the episode's central claim about current market conditions
- Rise of thematic and leveraged products — highlighted as a key driver of ETF growth
- Buffer and option-income ETFs — discussed as popular product categories
- AI and compute as emerging investment themes — specifically called out
- Battle for ETF brand loyalty — framed as an industry competitive dynamic
- $1 billion as the new benchmark for a fund that matters — a stated industry question
- Prediction-market ETFs — discussed as a novel product type
- Outlook for crypto and small caps — covered as investment areas
- Healthcare's comeback — identified as a sector trend
- Trillions of dollars still sitting in retail money-market funds — a notable liquidity pool
- Professional sports franchises starting to look like the stock market — an analogy used
- Wall Street packaging next ETF — speculation on future product innovation
- Hosts Josh Brown and Michael Batnick are employees of Ritholtz Wealth Management and may hold positions in discussed securities -
Technical Levels & Setups OR Macro Drivers (📌):
- Record ETF flows driving product innovation across thematic, leveraged, buffer, and option-income categories
- Investor interest in AI and compute as secular growth themes
- Healthcare sector showing signs of a comeback, attracting flows
- Persistent large retail allocation to money-market funds, implying potential future deployment into risk assets
- Crypto and small caps being evaluated for investment opportunities
- ETF industry competition intensifying around brand loyalty and scalability (the $1B AUM threshold)
- Prediction-market ETFs emerging as a new niche product category -
Risk/Reward Framework (⚖️):
- Entry: Not established by the available evidence.
- Stop: Not established by the available evidence.
- Targets: Not established by the available evidence.
- Risk/Reward: Not established by the available evidence.
- Position Size: Not established by the available evidence.
- Probability: Not established by the available evidence. -
Scenario Analysis (🔄):
| Scenario | Probability | Target | Trigger |
|---|---|---|---|
| Bull | Not established by the available evidence. | Not established by the available evidence. | Continued record ETF flows and sustained investor adoption of thematic/leveraged products, with money rotating out of money-market funds into risk assets |
| Base | Not established by the available evidence. | Not established by the available evidence. | Current trends persist: ETF boom continues, money-market funds remain elevated, and thematic flows stay concentrated in AI/compute and healthcare |
| Bear | Not established by the available evidence. | Not established by the available evidence. | ETF flows reverse due to market stress, regulatory actions, or a collapse in leveraged/thematic product performance, causing redemptions | -
Risk Factors (⚠️):
- Record ETF flows could reverse abruptly, driven by a market downturn or shift in risk appetite
- Leveraged and thematic ETFs carry higher volatility and potential for outsized losses
- The $1 billion AUM threshold may become a false proxy for fund quality or viability
- Prediction-market ETFs face regulatory and liquidity uncertainty
- Money-market funds' 'trillions' could redeploy in ways that disrupt current allocation patterns
- Healthcare comeback may be sector-specific and not broadly durable
- No specific tickers, price levels, or position sizes are provided in the evidence, limiting verifiability -
Actionable Trading/Allocation Plan (🎯):
- Monitor weekly ETF flow data to verify the claimed record-breaking boom and identify thematic inflows
- Track assets in retail money-market funds to gauge potential future deployment into equities
- Review performance and flows of AI/compute, healthcare, crypto, and small-cap ETFs
- Follow regulatory and product filings for prediction-market ETFs and other novel structures
- Compare AUM distribution across ETFs to assess whether the $1 billion threshold is actually a meaningful benchmark
- Verify any specific claims made in the video against primary data sources (e.g., ETF issuers, fund flows providers)

-
Creator Horizon Category (⏱️): Short-Term Technical — Creator emphasizes live trading, PPI data reaction, earnings, and S&P's smallest range of the year, indicating a near-term technical focus.
-
One-Line Thesis (💡): Creator claims markets are responding to PPI data and earnings while the S&P trades through its smallest range of the year, and flags upcoming 13F filings as a key next catalyst.
-
Key Data Points (📊):
- Markets respond to PPI data and earnings — from video title/description
- S&P trades through its smallest range of the year — from description
- Get ready for 13F's — from description -
Technical Levels & Setups OR Macro Drivers (📌):
- PPI data release as a market catalyst
- Earnings reports as a market catalyst
- Upcoming 13F filings as a scheduled event to watch -
Risk/Reward Framework (⚖️):
- Entry: Not established by the available evidence.
- Stop: Not established by the available evidence.
- Targets: Not established by the available evidence.
- Risk/Reward: Not established by the available evidence.
- Position Size: Not established by the available evidence.
- Probability: Not established by the available evidence. -
Scenario Analysis (🔄):
| Scenario | Probability | Target | Trigger |
|---|---|---|---|
| Unavailable | Not established by the available evidence. | Not established by the available evidence. | Verify source evidence. | -
Risk Factors (⚠️):
- No specific tickers, price levels, or directional bets are stated in the evidence.
- Metadata-only evidence; claims cannot be independently verified without watching the full video.
- Smallest-range observation lacks historical context or a measurable threshold. -
Actionable Trading/Allocation Plan (🎯):
- Verify upcoming PPI release date and compare market reaction to prior prints.
- Track the 13F filing deadline and identify major institutional holdings changes.

-
Creator Horizon Category (⏱️): Long-Horizon Macro / Structural — The video addresses structural shifts in AI capital markets, IPO valuations, and strategic financing plans, not short-term technical trading.
-
One-Line Thesis (💡): The video claims Anthropic is targeting a $2T IPO with $100B+ run rate and October listing, while discussing Meta's AI manifesto, Nvidia's $500B financing plan, Grok 4.6 launch, and Workday's ~$43B acquisition talks.
-
Key Data Points (📊):
- Anthropic IPO report: $2T valuation, $100B+ run rate, October listing
- Nvidia's $500B financing plan and how the AI market could fall apart
- Grok 4.6 launch: SpaceX's high-ceiling, high-floor AI strategy
- Workday in talks to be acquired by Silver Lake for ~$43B
- Anthropic said in talks to buy AI startup Decart for $6B (Bloomberg linked)
- Polymarket event: IPOs before 2027
- Polymarket event: which company has best AI model end of 2026
- Zuck's AI manifesto 'The Future is for Everyone' (Meta link) -
Technical Levels & Setups OR Macro Drivers (📌):
- Anthropic IPO catalyst with $2T valuation and October listing as a stated driver
- Nvidia's $500B financing plan as a market-wide AI capital driver
- Grok 4.6 launch as a competitive AI model catalyst
- Meta's AI manifesto as a strategic positioning driver
- Workday acquisition talks as a private equity take-private catalyst
- Anthropic's potential $6B acquisition of Decart as an M&A driver -
Risk/Reward Framework (⚖️):
- Entry: Not established by the available evidence.
- Stop: Not established by the available evidence.
- Targets: Not established by the available evidence.
- Risk/Reward: Not established by the available evidence.
- Position Size: Not established by the available evidence.
- Probability: Not established by the available evidence. -
Scenario Analysis (🔄):
| Scenario | Probability | Target | Trigger |
|---|---|---|---|
| Bull | Not established by the available evidence. | Not established by the available evidence. | If Anthropic confirms an October listing with $2T valuation and $100B+ run rate, as cited in the FT-linked report. |
| Base | Not established by the available evidence. | Not established by the available evidence. | If the Anthropic IPO report remains speculative and no official filing occurs, but Nvidia's financing plan and Grok 4.6 progress continue as described. |
| Bear | Not established by the available evidence. | Not established by the available evidence. | If the AI market falls apart as suggested in the Nvidia financing segment, or if any of the cited deals (Decart, Workday) fail, per the video's claims. | -
Risk Factors (⚠️):
- All cited figures and claims are from the video's metadata, not verified primary sources.
- No official confirmation of Anthropic's IPO valuation, run rate, or timing.
- Nvidia's $500B financing plan details are not provided beyond the title.
- Grok 4.6 launch specifics and performance metrics are not available in the evidence.
- Workday acquisition is 'in talks' and may not close at the ~$43B figure.
- The 'AI market could fall apart' risk is mentioned but not quantified. -
Actionable Trading/Allocation Plan (🎯):
- Review the FT article linked for the Anthropic IPO report to verify claims.
- Check Polymarket pages for IPO-before-2027 and best-AI-model-end-of-2026 probabilities.
- Verify Bloomberg article on Anthropic's talks to buy Decart for $6B.
- Monitor Meta's official page for the full AI manifesto text.
- Cross-reference Grok 4.6 launch details from SpaceX or xAI official channels.
- Follow the CNBC and NYT links for the Amazon antitrust lawsuit context.

-
Creator Horizon Category (⏱️): Short-Term Technical — The video is a live trader Q&A stream focused on charts, risk management, and current market conditions, which aligns with a short-term technical horizon.
-
One-Line Thesis (💡): The creator presents a live AMA session offering real-time trading education on chart patterns, entries, risk management, and mindset, while encouraging viewers to access free resources and join the community.
-
Key Data Points (📊):
- Not established by the available evidence. -
Technical Levels & Setups OR Macro Drivers (📌):
- Not established by the available evidence. -
Risk/Reward Framework (⚖️):
- Entry: Not established by the available evidence.
- Stop: Not established by the available evidence.
- Targets: Not established by the available evidence.
- Risk/Reward: Not established by the available evidence.
- Position Size: Not established by the available evidence.
- Probability: Not established by the available evidence. -
Scenario Analysis (🔄):
| Scenario | Probability | Target | Trigger |
|---|---|---|---|
| Unavailable | Not established by the available evidence. | Not established by the available evidence. | Verify source evidence. | -
Risk Factors (⚠️):
- Not established by the available evidence. -
Actionable Trading/Allocation Plan (🎯):
- Watch the live stream to capture Joey's direct answers on entries, risk management, chart patterns, and current market opinion.
- Review the free resources at https://www.chartguys.com/discover-more to verify the educational content referenced in the description.
- Assess the community membership at https://www.chartguys.com/membership for additional trading education and context.

-
Creator Horizon Category (⏱️): Other — Evidence is a promotional video for an upcoming summit, not a market analysis.
-
One-Line Thesis (💡): The creator claims the All-In Summit 2026, occurring in 30 days, is a venue where deals are done and relationships are built, and encourages applications.
-
Key Data Points (📊):
- 30 days until All-In Summit 2026 — title claim
- This room is where deals are done and relationships are built — creator's description of the summit
- Apply today: www.theallinsummit.com — call to action
- #allinsummit — event hashtag -
Technical Levels & Setups OR Macro Drivers (📌):
- Upcoming All-In Summit 2026 as a networking and deal-making catalyst — claimed but unverified -
Risk/Reward Framework (⚖️):
- Entry: Not established by the available evidence.
- Stop: Not established by the available evidence.
- Targets: Not established by the available evidence.
- Risk/Reward: Not established by the available evidence.
- Position Size: Not established by the available evidence.
- Probability: Not established by the available evidence. -
Scenario Analysis (🔄):
| Scenario | Probability | Target | Trigger |
|---|---|---|---|
| Unavailable | Not established by the available evidence. | Not established by the available evidence. | Verify source evidence. | -
Risk Factors (⚠️):
- Summit may be delayed or cancelled — not verifiable from evidence
- Claims of deal-making and relationship-building are unsubstantiated promotional statements
- No financial metrics or market impact data provided -
Actionable Trading/Allocation Plan (🎯):
- Check the All-In Summit website (www.theallinsummit.com) for event details and updates
- Verify the exact date of the summit, as the 30-day countdown is a claim from the video
- Monitor post-summit announcements for any disclosed deals or outcomes

-
Creator Horizon Category (⏱️): Short-Term Technical — The video focuses on immediate market reaction to PPI data and intraday S&P range behavior, indicating a short-term technical horizon.
-
One-Line Thesis (💡): The video claims markets are responding to PPI data and earnings while the S&P trades through its smallest range of the year, and anticipates upcoming 13F filings.
-
Key Data Points (📊):
- PPI data — macro catalyst mentioned as driving market response.
- Earnings — earnings season cited as a market driver.
- S&P smallest range of the year — technical condition stated for the trading day.
- 13F filings — upcoming event the creator says to 'get ready' for.
- Three trading platforms: E*TRADE Pro, ThinkOrSwim, Fidelity — creator's stated setup, not market data. -
Technical Levels & Setups OR Macro Drivers (📌):
- PPI data release as a market catalyst.
- Earnings reports driving market response.
- S&P trading in its narrowest range of the year — potential breakout setup.
- Upcoming 13F filings as an informational driver. -
Risk/Reward Framework (⚖️):
- Entry: Not established by the available evidence.
- Stop: Not established by the available evidence.
- Targets: Not established by the available evidence.
- Risk/Reward: Not established by the available evidence.
- Position Size: Not established by the available evidence.
- Probability: Not established by the available evidence. -
Scenario Analysis (🔄):
| Scenario | Probability | Target | Trigger |
|---|---|---|---|
| Unavailable | Not established by the available evidence. | Not established by the available evidence. | Verify source evidence. | -
Risk Factors (⚠️):
- Creator's claim that the S&P is at its smallest range of the year is unverified — no specific range value or historical comparison is provided.
- PPI and earnings data may cause unexpected volatility, breaking the narrow range.
- 13F filings may not move markets as anticipated; the creator explicitly disclaims any financial advice and warns of option trading risk. -
Actionable Trading/Allocation Plan (🎯):
- Monitor official PPI release figures and compare with market reaction to verify the claimed catalyst.
- Calendar upcoming 13F filing deadlines from major institutional managers to assess potential market impact.
- Review the creator's stream alerts or bootcamp materials for further context, given the disclaimer that the stream is for educational purposes only.

-
Creator Horizon Category (⏱️): Long-Horizon Macro — Video covers structural geopolitical and economic themes such as China confrontation, European decline, and national debt with a former diplomat/politician.
-
One-Line Thesis (💡): Rahm Emanuel discusses Trump's foreign policy, China conflict and a new economic bloc, Europe's decay, immigration reform, national debt, and DSA vs Democrats — headline topics from the All-In Podcast episode description.
-
Key Data Points (📊):
- Trump's Foreign Policy — core topic of interview (video starts at 0:00).
- China: How to approach conflict, new economic bloc, isolation, and Taiwan — segment at 7:45.
- Europe: Reasons for the decay of the West — segment at 28:49.
- Immigration: US solutions, who to emulate, subsidizing college for Americans — segment at 38:37.
- National debt, government interference in markets, fixing education — segment at 46:55.
- DSA vs Democrats — segment at 1:09:24. -
Technical Levels & Setups OR Macro Drivers (📌):
- Creator discusses approach to China conflict and a new economic bloc, potentially impacting trade and geopolitical risk.
- Creator cites reasons for European decline, affecting macro outlook for Europe.
- Creator proposes US immigration solutions and college subsidies, with fiscal and labor-market implications.
- Creator addresses national debt and government interference in markets, relevant to fiscal policy and market regulation. -
Risk/Reward Framework (⚖️):
- Entry: Not established by the available evidence.
- Stop: Not established by the available evidence.
- Targets: Not established by the available evidence.
- Risk/Reward: Not established by the available evidence.
- Position Size: Not established by the available evidence.
- Probability: Not established by the available evidence. -
Scenario Analysis (🔄):
| Scenario | Probability | Target | Trigger |
|---|---|---|---|
| Unavailable | Not established by the available evidence. | Not established by the available evidence. | Verify source evidence. | -
Risk Factors (⚠️):
- No specific market claims, numbers, or policy details are provided in the evidence; only topic headings are available.
- Content is editorial opinion and may reflect political bias; verification requires full episode transcript and cross-referencing with official data.
- Foreign policy and political discussions may not translate directly into tradeable signals without further quantitative information. -
Actionable Trading/Allocation Plan (🎯):
- Watch the full episode or read transcript to extract specific policy proposals and any market-relevant claims.
- Cross-check any stated economic data (e.g., debt levels, immigration statistics) against official government sources.
- Monitor for mentions of specific tickers, sectors, or asset classes in the full conversation for potential market impact.
- Evaluate Emanuel's statements against current geopolitical events to assess forward-looking implications.

-
Creator Horizon Category (⏱️): Short-Term Technical — Title 'Volatility Incoming' implies near-term price movement focus.
-
One-Line Thesis (💡): TheChartGuys' Joey asserts that volatility is incoming, checks the metals bull thesis, and evaluates market rotational scenarios to assess market health and guide forward strategy.
-
Key Data Points (📊):
- Volatility Incoming! — literal title claim
- metals bull thesis — focus of check-in
- rotational scenarios — used to evaluate market health
- market health — key evaluation criterion
- strategy moving forward — implied actionable follow-up -
Technical Levels & Setups OR Macro Drivers (📌):
- Rotation scenarios as a tool for gauging market health
- Metals bull thesis review amid incoming volatility -
Risk/Reward Framework (⚖️):
- Entry: Not established by the available evidence.
- Stop: Not established by the available evidence.
- Targets: Not established by the available evidence.
- Risk/Reward: Not established by the available evidence.
- Position Size: Not established by the available evidence.
- Probability: Not established by the available evidence. -
Scenario Analysis (🔄):
| Scenario | Probability | Target | Trigger |
|---|---|---|---|
| Unavailable | Not established by the available evidence. | Not established by the available evidence. | Verify source evidence. | -
Risk Factors (⚠️):
- No specific price levels, triggers, or timestamps provided in metadata
- Claims require verification via the video itself
- Title may be clickbait or overstated without corroborating data -
Actionable Trading/Allocation Plan (🎯):
- Watch the video to extract specific levels, scenarios, and verification data
- Cross-check any cited market conditions against live or historical charts
- Monitor subsequent content for updates on the metals bull thesis and rotational health
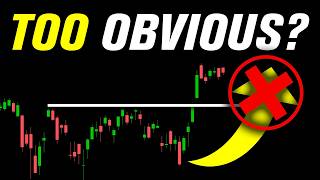
-
Creator Horizon Category (⏱️): Short-Term Technical — Creator describes the video as a Midweek Market Update reviewing key support/resistance levels for options trading, indicating an intraday/short-term technical focus.
-
One-Line Thesis (💡): Trade Brigade's 'this would be too obvious...' video claims to review key support/resistance levels for SPY, QQQ, IWM, and S&P sectors, present fundamental and technical evidence, and offer trade ideas across a core list (NVDA, AAPL, MSFT, AMZN, GOOGL, AVGO, META, TSLA, JPM, MU, AMD, INTC) and additional tickers (NBIS, ORCL, PLTR, RBRK, SPCX, CHYM, CVNA, CRDO, TER) for an actionable options-trading game plan.
-
Key Data Points (📊):
- SPY, QQQ, IWM, S&P Sectors — chapters covered in the video
- Core List: NVDA, AAPL, MSFT, AMZN, GOOGL, AVGO, META, TSLA, JPM, MU, AMD, INTC — tickers reviewed
- Trade Ideas: NBIS, ORCL, PLTR, RBRK, SPCX, CHYM, CVNA, CRDO, TER — tickers for trade ideas
- Fundamental Evidence and Technical Evidence — video sections
- Disclaimer: information for informational purposes only; not financial/legal advice; creator not a Registered Investment Advisor; trading highly speculative and carries risk -
Technical Levels & Setups OR Macro Drivers (📌):
- Review of key support and resistance levels for SPY, QQQ, IWM and S&P sectors
- Fundamental and technical evidence sections
- Actionable game plan for options trading
- Trade ideas on specific tickers -
Risk/Reward Framework (⚖️):
- Entry: Not established by the available evidence.
- Stop: Not established by the available evidence.
- Targets: Not established by the available evidence.
- Risk/Reward: Not established by the available evidence.
- Position Size: Not established by the available evidence.
- Probability: Not established by the available evidence. -
Scenario Analysis (🔄):
| Scenario | Probability | Target | Trigger |
|---|---|---|---|
| Unavailable | Not established by the available evidence. | Not established by the available evidence. | Verify source evidence. | -
Risk Factors (⚠️):
- No specific price levels, entries, stops, or targets are provided in the available evidence, making verification impossible from metadata alone.
- Video disclaims that it is not financial advice and that trading is highly speculative.
- Creator is not a Registered Investment Advisor. -
Actionable Trading/Allocation Plan (🎯):
- Watch the video chapters on SPY, QQQ, IWM, and S&P sectors to extract the claimed key support/resistance levels.
- Compare the creator's fundamental and technical evidence with independent market data.
- Monitor the listed trade idea tickers (NBIS, ORCL, PLTR, RBRK, SPCX, CHYM, CVNA, CRDO, TER) for any stated setups or levels.

-
Creator Horizon Category (⏱️): Short-Term Technical — The evidence supports this horizon classification.
-
One-Line Thesis (💡): Creator claims to be preparing for CPI and 13F filings, with a focus on cybersecurity stocks, while trading live and providing educational content.
-
Key Data Points (📊):
- Cyber security stocks - sector emphasized for watching
- Live trading on Etrade pro, ThinkOrSwim, and Fidelity - platforms used (metadata)
- Option trading is risky; copying trades may lead to significant losses - creator's disclaimer -
Technical Levels & Setups OR Macro Drivers (📌):
- CPI reaction function - creator's stated approach to trading around CPI
- 13F filings - institutional holdings disclosure as a catalyst
- Cybersecurity stocks - sector focus for potential opportunities -
Risk/Reward Framework (⚖️):
- Entry: Not established by the available evidence.
- Stop: Not established by the available evidence.
- Targets: Not established by the available evidence.
- Risk/Reward: Not established by the available evidence.
- Position Size: Not established by the available evidence.
- Probability: Not established by the available evidence. -
Scenario Analysis (🔄):
| Scenario | Probability | Target | Trigger |
|---|---|---|---|
| Unavailable | Not established by the available evidence. | Not established by the available evidence. | Verify source evidence. | -
Risk Factors (⚠️):
- Options trading risk: creator warns that copying trades likely leads to losses
- Event risk: CPI and 13F filings may cause volatility not captured in metadata -
Actionable Trading/Allocation Plan (🎯):
- Monitor CPI release and 13F filing dates for market impact
- Research cybersecurity stocks mentioned in the video for context
- Consult full video for any specific trade parameters, as metadata provides no levels

-
Creator Horizon Category (⏱️): Other — The evidence is metadata-only; no trading horizon is specified, though the title suggests a long-term technological trend.
-
One-Line Thesis (💡): The video claims that robots learn much slower than humans at first but then become infinitely scalable, implying a structural advantage for AI/robotics systems over time.
-
Key Data Points (📊):
- Robots learn much slower than humans at first, then infinitely scalable — video title
- AppLovin Ads: $11B annual run rate in ad spend, 1B+ daily active users, median 35 seconds full-screen video ad viewing — sponsor claim
- Plaud AI notes: sponsored product with up to 10% discount code ALLIN — sponsor claim
- All-In Podcast hosts: Chamath, Jason, David Sacks, Friedberg — creator identities -
Technical Levels & Setups OR Macro Drivers (📌):
- Not established by the available evidence. -
Risk/Reward Framework (⚖️):
- Entry: Not established by the available evidence.
- Stop: Not established by the available evidence.
- Targets: Not established by the available evidence.
- Risk/Reward: Not established by the available evidence.
- Position Size: Not established by the available evidence.
- Probability: Not established by the available evidence. -
Scenario Analysis (🔄):
| Scenario | Probability | Target | Trigger |
|---|---|---|---|
| Unavailable | Not established by the available evidence. | Not established by the available evidence. | Verify source evidence. | -
Risk Factors (⚠️):
- The evidence contains no quantitative investment claims; therefore, any specific market implications from the video title are unverifiable from metadata alone. -
Actionable Trading/Allocation Plan (🎯):
- Verify AppLovin's claimed $11B annual ad spend run rate and 1B+ daily active users via AppLovin public disclosures.
- Watch the full video to extract any additional claims or investment theses beyond the title and sponsorship disclosures.

-
Creator Horizon Category (⏱️): Other — Content concerns interview preparation technique, not market horizon.
-
One-Line Thesis (💡): Ted Seides prepares for interviews via deep research, a guest call, and a bullet-point topic outline, then relies on attentive listening rather than scripted questions, a method he attributes to learning from a missed follow-up in early career.
-
Key Data Points (📊):
- Re-listening to an early interview revealed a missed follow-up because he was reading from a question list — evidence of his learning moment
- Prep formula: deep research, a guest call, and a simple bullet-point outline of topics — his stated method
- He contrasts his approach with David Rubenstein's memorized questions and Tim Ferriss's pages of notes — differentiation claim
- The clip is from Capital Allocators Summer Series on Interdisciplinary Skills: Interviewing, with Ted interviewed by Apollo's Matt Breitfelder — source context
- Full episode is Ep. 330 (July 2023), 'The Art of the Interview' — source reference -
Technical Levels & Setups OR Macro Drivers (📌):
- His discipline to walk in with no scripted questions is driven by the goal of active listening, avoiding the trap of following a predetermined list -
Risk/Reward Framework (⚖️):
- Entry: Not established by the available evidence.
- Stop: Not established by the available evidence.
- Targets: Not established by the available evidence.
- Risk/Reward: Not established by the available evidence.
- Position Size: Not established by the available evidence.
- Probability: Not established by the available evidence. -
Scenario Analysis (🔄):
| Scenario | Probability | Target | Trigger |
|---|---|---|---|
| Unavailable | Not established by the available evidence. | Not established by the available evidence. | Verify source evidence. | -
Risk Factors (⚠️):
- Claim about his prep methodology is unverified without listening to the full episode 330
- Potential bias in self-reported narrative; no independent confirmation of his actual interview behavior -
Actionable Trading/Allocation Plan (🎯):
- Verify claims by listening to the full episode 330 (July 2023) via Capital Allocators
- Cross-check the missed follow-up anecdote against any available transcript or summary

-
Creator Horizon Category (⏱️): Short-Term Technical — Evidence indicates a live intraday trading stream with emphasis on immediate market action and upcoming weekly macro catalysts (13F, CPI).
-
One-Line Thesis (💡): Creator highlights cybersecurity stocks as a watch area and advises preparing for the week's 13F filings and CPI data as key market catalysts.
-
Key Data Points (📊):
- Watch Cyber security stocks — creator's explicit sector emphasis
- Get ready for 13F's and CPI this week — stated macro catalysts
- Trading on 3 platforms: Etrade pro (screen shown), ThinkOrSwim (long term investing), Fidelity (long Term) — platform usage
- Option trading is really risky and you are more than likely going to lose your money copying anything you see — creator risk warning
- This stream is for educational purposes. Do not copy the trades — disclaimer -
Technical Levels & Setups OR Macro Drivers (📌):
- 13F filings as a driver for institutional positioning insight
- CPI as a macro catalyst affecting market volatility
- Cybersecurity stocks as a sector to watch -
Risk/Reward Framework (⚖️):
- Entry: Not established by the available evidence.
- Stop: Not established by the available evidence.
- Targets: Not established by the available evidence.
- Risk/Reward: Not established by the available evidence.
- Position Size: Not established by the available evidence.
- Probability: Not established by the available evidence. -
Scenario Analysis (🔄):
| Scenario | Probability | Target | Trigger |
|---|---|---|---|
| Unavailable | Not established by the available evidence. | Not established by the available evidence. | Verify source evidence. | -
Risk Factors (⚠️):
- No specific invalidation levels or price triggers provided in evidence.
- Creator explicitly warns that copying trades is risky and options trading can lead to substantial losses.
- The evidence lacks tickers, prices, and entry/exit parameters, so verification is limited. -
Actionable Trading/Allocation Plan (🎯):
- Monitor cybersecurity sector performance following creator's emphasis.
- Track release schedule for CPI and 13F filings during the week of Aug 11.
- Review the stream's description for links to watchlist and educational materials.

-
Creator Horizon Category (⏱️): Other — Evidence is metadata-only; video topic is a military/tech rescue mission, not a financial market event.
-
One-Line Thesis (💡): Video claims a former Navy Seal describes the first autonomous rescue mission near the Strait of Hormuz, with no trading, valuation, or market analysis content in the metadata.
-
Key Data Points (📊):
- Former Navy Seal details first autonomous rescue mission near the Strait of Hormuz — video title claim
- Sponsors mentioned (Creative Planning, Northwest Registered Agent) — no financial analysis -
Technical Levels & Setups OR Macro Drivers (📌):
- Not established by the available evidence. -
Risk/Reward Framework (⚖️):
- Entry: Not established by the available evidence.
- Stop: Not established by the available evidence.
- Targets: Not established by the available evidence.
- Risk/Reward: Not established by the available evidence.
- Position Size: Not established by the available evidence.
- Probability: Not established by the available evidence. -
Scenario Analysis (🔄):
| Scenario | Probability | Target | Trigger |
|---|---|---|---|
| Unavailable | Not established by the available evidence. | Not established by the available evidence. | Verify source evidence. | -
Risk Factors (⚠️):
- Claims about an autonomous rescue mission are unverified from metadata alone; no primary-source evidence provided.
- No financial or market-relevant information in the supplied evidence; any investment implication would be speculative. -
Actionable Trading/Allocation Plan (🎯):
- Cross-check the rescue mission narrative with independent news reports or official military statements.
- Review the full episode transcript for any incidental market commentary or ticker references.
- Monitor subsequent All-In Podcast episodes for structured financial theses if the series typically covers markets.

-
Creator Horizon Category (⏱️): Long-Horizon Macro / Structural — The video title indicates a geopolitical/industrial policy issue about Chinese robots and a potential ban, which would have structural implications for trade and automation.
-
One-Line Thesis (💡): The creator headlines the video with the claim that CEOs are calling to 'Ban Them Now' regarding Chinese robots, but the available metadata contains no substantive financial analysis, specific tickers, valuations, or investment parameters; only the title and sponsor claims are present.
-
Key Data Points (📊):
- Title claim: 'Ban Them Now' - CEOs sounding alarm on Chinese robots
- Sponsor claim: AppLovin has $11B annual run rate in ad spend
- Sponsor claim: AppLovin has 1B+ daily active users
- Sponsor claim: full-screen video ads watched for median of 35 seconds -
Technical Levels & Setups OR Macro Drivers (📌):
- The headline claim that CEOs are urging a ban on Chinese robots is the only stated potential market/policy driver in the evidence. -
Risk/Reward Framework (⚖️):
- Entry: Not established by the available evidence.
- Stop: Not established by the available evidence.
- Targets: Not established by the available evidence.
- Risk/Reward: Not established by the available evidence.
- Position Size: Not established by the available evidence.
- Probability: Not established by the available evidence. -
Scenario Analysis (🔄):
| Scenario | Probability | Target | Trigger |
|---|---|---|---|
| Unavailable | Not established by the available evidence. | Not established by the available evidence. | Verify source evidence. | -
Risk Factors (⚠️):
- The video's title may be sensationalized or lack verifiable sourcing; no actual CEO statements or data are provided in the metadata.
- Sponsor segments (AppLovin, Plaud) are promotional and not evidence of the video's editorial claims.
- Any investment relevant claims are absent from the evidence; the note cannot support trading decisions. -
Actionable Trading/Allocation Plan (🎯):
- Watch the full video to extract the specific CEOs quoted, their reasoning, and any cited data on Chinese robots or market impact.
- Cross-reference the video's claims with credible news sources on policy proposals regarding Chinese robotics imports.
- Monitor the video description for any updated links or references to supporting materials (if provided).
- Treat sponsor metrics as advertising content, not as analyst or creator investment findings.

-
Creator Horizon Category (⏱️): Short-Term Technical — Creator focuses on intraday open rotations, pre-market headline catalysts, and same-week earnings/data events (CPI, PPI, GDP), implying a multi-day trading horizon.
-
One-Line Thesis (💡): Creator expects the market to find footing after prior-week drama (Josh report, AI earnings), citing Meta's open-weight model, Apple's glass-phone pivot, and Intel's $15B offering as headline catalysts, while emphasizing that rotations are unclear and this week's earnings and macro data will set direction.
-
Key Data Points (📊):
- Intel did a $15 billion offering — creator says this 'started to kill it' (supply pressure).
- Meta released an open-weight model — creator says Meta started to go up.
- Microsoft crossed above $500 — creator says 'I have been raving about that.'
- Front-end oil near $80 — creator notes 'oil climbing up.'
- Goldman note reportedly called Airbnb an 'AI stock' — creator quotes with skepticism.
- Cisco earnings August 21st — creator says 'I would never buy a 190 call' but did a small play outside two standard deviations for earnings runup, not a recommendation.
- Earnings this week: CoreWeave, Lumen (Light?), SMCI, Cberus (likely CyberArk?), AAT (likely Ares Acquisition?), Cisco — creator lists as 'earnings this week.'
- Vertex (Vert.Ex) benefiting off a bad drug trial for cystic fibrosis by another company.
- Take-Two (T2) — GTA event apparently August 26th, analyst commentary via Friday report. -
Technical Levels & Setups OR Macro Drivers (📌):
- Macro data this week: CPI, PPI, GDP — creator says 'all of it's coming together.'
- M&A activity — creator notes 'four or five different offers or buyouts' this morning.
- Biotech activity — approvals, M&A, and Vertex's competitor drug-trial miss.
- Supply-side pressure — Intel offering plus other offerings on the supply side.
- Rotation ambiguity — creator says 'rotations are kind of all over' and 'we don't really know the rotations just yet.'
- Cisco earnings August 21st — creator explicitly warns against 190 calls but has a small non-recommended play outside 2 standard deviations for earnings runup.
- Watch list: CrowdStrike, CoreWeave, Lumen, SMCI, CyberArk, AAT, Cisco, Meta, rest of Mag 7, Vertex, biotech. -
Risk/Reward Framework (⚖️):
- Entry: Not established by the available evidence.
- Stop: Not established by the available evidence.
- Targets: Not established by the available evidence.
- Risk/Reward: Not established by the available evidence.
- Position Size: Not established by the available evidence.
- Probability: Not established by the available evidence. -
Scenario Analysis (🔄):
| Scenario | Probability | Target | Trigger |
|---|---|---|---|
| Bull | Not established by the available evidence. | Not established by the available evidence. | Broad market holds green with financials and healthcare leading; Meta open-weight model and Microsoft above $500 sustain momentum; software/cyber names keep rallying. |
| Base | Not established by the available evidence. | Not established by the available evidence. | Verify the trigger against the source evidence. |
| Bear | Not established by the available evidence. | Not established by the available evidence. | Verify the trigger against the source evidence. | -
Risk Factors (⚠️):
- Creator explicitly says 'we don't really know the rotations just yet' — no clear directional edge.
- Intel $15B offering creates supply overhang that could weigh on chip/semis.
- Apple's glass-phone news is a negative catalyst ('killed it').
- Cisco 190 calls flagged as a 'bad bad idea' — creator's play is non-recommendation and outside stated standard-deviation parameters.
- No precise entry/stop/target or probability given for any position.
- Transcript contains garbled tickers (e.g., 'Cororeweave', 'Cberus', 'AAT') — verification needed.
- Creator's comments on Airbnb-AI are sarcastic, not a bullish endorsement.
- Intraday data is time-stamped to a single morning; no follow-through analysis in evidence. -
Actionable Trading/Allocation Plan (🎯):
- Monitor core earnings names listed by creator: CoreWeave, Lumen, SMCI, CyberArk, AAT, Cisco, and Vertex for actual schedule confirmation.
- Verify Intel's $15B offering terms and price action — creator cites this as supply-side drag.
- Check Meta's open-weight model announcement and subsequent price move — creator sees it as a positive catalyst.
- Track Apple's glass-phone news and magnitude of decline — creator flags it as a negative catalyst.
- Await CPI, PPI, and GDP prints this week — creator treats these as macro catalysts.
- For Cisco, verify earnings date August 21st and the 190 call volume/price behavior; creator's own trade is 'outside two standard deviations' and explicitly not a recommendation.

-
Creator Horizon Category (⏱️): Long-Horizon Macro / Structural — The speaker frames GameStop as a mispriced real business with insider capital commitment, not a short-term technical trade.
-
One-Line Thesis (💡): The speaker claims GameStop is a real business creating value, not a meme stock, and that his personal $500 million investment plus zero stock sales proves his own skin in the game, while the media and incumbent management/board are unfairly biased against him and lack similar risk-taking.
-
Key Data Points (📊):
- $500 million of his own money into this transaction — speaker's stated personal capital commitment
- Haven't pulled a penny out of GameStop — speaker claims no insider selling
- Board makes hundreds of thousands of dollars a year — speaker criticizes board compensation while not buying stock
- Management team 'grossly overpaid, taking zero risk' — speaker's characterization of opposing management
- Media takes on GameStop being just a meme stock were wrong — speaker asserts misclassification
- There is actually a business here and value is being created — core fundamental claim
- Media wants us to fail and them to succeed — speaker's narrative of media bias
- There's nothing more American than basically risking your own capital — normative argument for insider commitment -
Technical Levels & Setups OR Macro Drivers (📌):
- Insider capital commitment ($500 million) and zero selling act as credibility signals
- Media reversal from meme-stock label to real-business acknowledgment would be a repricing catalyst
- Board/management lack of insider ownership contrasted with speaker's skin-in-game positions governance as a driver
- Assertion of value creation is the fundamental driver, though no financials are cited -
Risk/Reward Framework (⚖️):
- Entry: Not established by the available evidence.
- Stop: Not established by the available evidence.
- Targets: Not established by the available evidence.
- Risk/Reward: Not established by the available evidence.
- Position Size: Not established by the available evidence.
- Probability: Not established by the available evidence. -
Scenario Analysis (🔄):
| Scenario | Probability | Target | Trigger |
|---|---|---|---|
| Bull | Not established by the available evidence. | Not established by the available evidence. | Media acknowledges that GameStop is not just a meme stock and that there is a real business or value creation. |
| Base | Not established by the available evidence. | Not established by the available evidence. | No narrative shift; speaker maintains $500 million position and continues to contrast his risk-taking with media and board skepticism. |
| Bear | Not established by the available evidence. | Not established by the available evidence. | Media and board/management continue to dismiss GameStop as a meme stock and the value-creation claim gains no traction. | -
Risk Factors (⚠️):
- Self-reported $500 million investment is not independently verified; no SEC filing cited.
- No financial metrics or valuation data are provided to support 'value is being created'.
- Claim that media wants GameStop to fail is anecdotal and not quantified.
- Speaker's own financial stake may bias his characterization of the business.
- Board compensation criticism relies on unspecified 'hundreds of thousands of dollars' without detailed evidence.
- No concrete catalyst date, price target, or fundamental catalyst is specified. -
Actionable Trading/Allocation Plan (🎯):
- Monitor media and analyst coverage for any acknowledgment that the meme-stock narrative was wrong.
- Review board compensation and insider buying/selling activity in GameStop's proxy statement and Form 4s.
- Track any new GameStop presentations or filings that articulate value-creation strategies.

-
Creator Horizon Category (⏱️): Long-Horizon Macro / Structural — Creator frames a structural shift in AI model economics—open-source token consumption rising while frontier labs retain economics—not a short-term trade or macro cycle.
-
One-Line Thesis (💡): Creator argues frontier closed models remain ahead on intelligence and are actually cheaper on total cost of ownership, so revenue economics concentrate in frontier labs while open-source token volumes rise.
-
Key Data Points (📊):
- Open-source tokens have 'caught up in intelligence' and are 'much cheaper' — market narrative cited by creator
- Elon Musk: 'we're entering the singularity and the frontier models are way further ahead than people think' — creator repeats as his belief
- Jensen Huang: 'Closed models are actually cheaper' because you avoid training cost and expertise to fine-tune, maintain, guardrail, keep safe — creator cites
- 'For the vast majority of use cases, token consumption is going up for the open source guys, while share of economics is going up for the frontier labs' — creator's own thesis -
Technical Levels & Setups OR Macro Drivers (📌):
- Downward pressure on token pricing over last two weeks — alleged catalyst for discussion
- Chinese open-source models 'catching up' — competitive threat narrative
- Frontier labs' revenue share gains from cost differential and safety/maintenance burden — creator's argument
- Elon and Jensen commentary as validation for closed-model economics -
Risk/Reward Framework (⚖️):
- Entry: Not established by the available evidence.
- Stop: Not established by the available evidence.
- Targets: Not established by the available evidence.
- Risk/Reward: Not established by the available evidence.
- Position Size: Not established by the available evidence.
- Probability: Not established by the available evidence. -
Scenario Analysis (🔄):
| Scenario | Probability | Target | Trigger |
|---|---|---|---|
| Bull | Not established by the available evidence. | Not established by the available evidence. | Frontier labs continue to run away on the revenue side while token consumption for open source rises — creator's stated expectation |
| Base | Not established by the available evidence. | Not established by the available evidence. | Frontier models remain ahead but open-source token usage grows for most use cases — creator's explicit base case |
| Bear | Not established by the available evidence. | Not established by the available evidence. | No bear scenario is explicitly described in the evidence; creator's statements assume frontier labs keep economic share | -
Risk Factors (⚠️):
- Creator's claims are unverified assertions—no data on actual token consumption or revenue share is provided
- Elon and Jensen quotes are not independently verified in the transcript
- The 'last two weeks' timeframe is vague; no pricing data or model performance benchmarks are cited
- Cheaper total cost of ownership argument is qualitative; no quantification of training cost or guardrail expense -
Actionable Trading/Allocation Plan (🎯):
- Monitor AI model benchmark releases (frontier vs open-source) to verify 'frontier way further ahead' claim
- Track revenue disclosures from major AI labs (e.g., OpenAI, Anthropic) versus open-source ecosystem spending to validate 'share of economics' trend
- Compare token pricing trends for frontier vs open-source models over next several quarters to test the 'downward pressure' narrative
- Seek independent cost analyses (training, fine-tuning, guardrails) to verify Jensen's closed-model cheaper thesis

-
Creator Horizon Category (⏱️): Other — The video presents a communication and due diligence framework for investment professionals, not a market or asset-specific forecast.
-
One-Line Thesis (💡): Ted Seides argues that powerful questioning in investing requires three phases—preparing context, choosing questions through listening, and delivery mechanics—with listening having four components (presence, mirroring, validation, empathy).
-
Key Data Points (📊):
- Three phases: readiness, question selection via listening, delivery mechanics
- Four listening components: presence, mirroring, validation, empathy
- Context: physical and emotional environment (e.g., David Swenson's use of tennis/dinner) facilitates information sharing
- Cited influences: Chris Voss (FBI negotiator), Daylian Cain (Yale negotiations), relationship therapist -
Technical Levels & Setups OR Macro Drivers (📌):
- The framework is driven by the premise that a comfortable, relationship-based context and active listening improve information gathering in manager interviews and CEO meetings.
- Seides teaches this module in Capital Allocators University, making implicit practices explicit. -
Risk/Reward Framework (⚖️):
- Entry: Not established by the available evidence.
- Stop: Not established by the available evidence.
- Targets: Not established by the available evidence.
- Risk/Reward: Not established by the available evidence.
- Position Size: Not established by the available evidence.
- Probability: Not established by the available evidence. -
Scenario Analysis (🔄):
| Scenario | Probability | Target | Trigger |
|---|---|---|---|
| Unavailable | Not established by the available evidence. | Not established by the available evidence. | Verify source evidence. | -
Risk Factors (⚠️):
- The framework is anecdotal and lacks empirical validation; it may not generalize to all investment settings.
- No specific market or portfolio implications are provided in the evidence. -
Actionable Trading/Allocation Plan (🎯):
- Monitor the Capital Allocators University module for detailed framework content.
- Verify David Swenson's practices via interviews or biographies.
- Review Chris Voss's negotiation techniques for comparison.

-
Creator Horizon Category (⏱️): Long-Horizon Macro / Structural — The evidence centers on a long-term structural shift in US semiconductor independence and capital allocation from Starlink's cash flow.
-
One-Line Thesis (💡): Creator bull-cases Starlink alone and argues Elon Musk could direct excess capital to build what would become the world's greatest semiconductor fabrication site, reducing US dependency on Taiwan/China.
-
Key Data Points (📊):
- Starlink as standalone bull case — creator cites it as core value driver
- Excess capital from Starlink — creator questions Musk's ability to allocate it
- Semiconductor fabrication site — creator claims Musk's vision could produce the greatest on Earth
- Taiwan/China dependency — creator frames this as the US problem Musk might solve -
Technical Levels & Setups OR Macro Drivers (📌):
- Starlink's standalone business strength as primary setup
- Elon Musk's capital allocation track record as secondary driver
- US semiconductor independence thesis as macro setup
- Potential scale and location of a Musk-led fabrication site as unstated variable -
Risk/Reward Framework (⚖️):
- Entry: Not established by the available evidence.
- Stop: Not established by the available evidence.
- Targets: Not established by the available evidence.
- Risk/Reward: Not established by the available evidence.
- Position Size: Not established by the available evidence.
- Probability: Not established by the available evidence. -
Scenario Analysis (🔄):
| Scenario | Probability | Target | Trigger |
|---|---|---|---|
| Bull | Not established by the available evidence. | Not established by the available evidence. | If Elon delivers the semiconductor vision as described, creating the greatest fabrication site on Earth. |
| Base | Not established by the available evidence. | Not established by the available evidence. | Starlink alone justifies a bull case irrespective of semiconductor outcome. |
| Bear | Not established by the available evidence. | Not established by the available evidence. | If Elon misallocates Starlink's excess capital, undercutting the combined thesis. | -
Risk Factors (⚠️):
- No hard data on Starlink financials, capex, or valuation in evidence
- No confirmed semiconductor fabrication plan or timeline
- Capital allocation record of Elon Musk is not quantified or verified
- Dependency reduction from Taiwan/China is not quantified or verified -
Actionable Trading/Allocation Plan (🎯):
- Monitor Starlink revenue, cash flow, and capex disclosures for validation of the standalone bull case
- Track any public statements or filings from Elon Musk regarding semiconductor fabrication investment
- Verify US semiconductor policy shifts and any Musk-linked government contracts
- Compare Musk's capital allocation record against his stated vision for semiconductor manufacturing

-
Creator Horizon Category (⏱️): Long-Horizon Macro / Structural — Creator argues AI is compressing economic time and factor volatility is structurally higher, requiring new hedging approaches beyond index puts.
-
One-Line Thesis (💡): AI-driven bull market continues with record earnings and global breadth, but factor vol breaking away from index vol means traditional index-put hedging is ineffective and new structural hedging tools are needed.
-
Key Data Points (📊):
- S&P year-to-date +13%; every sector up — bull market claim
- KOSPI +61% YTD; KOSPI tech +116% YTD — after prior collapse
- Factor vol hit 45-year highs on some measures — prior panic
- 50-day rate of change on thematic portfolio ~50% — risk threshold at 20%
- Earnings growth ~50%, revenue growth 15%, margins 17% vs 13% year ago — AI trade broad-based
- PMI ~60, durable goods (non-defense ex-air) near 60 — leading indicators strong
- VIX at lows since January; CDX index flat — no credit stress
- IWM, equal-weight S&P, NYSE Composite all made all-time highs this week; DAX and FTSE new all-time highs
- Factor vol expected to stay 25-30 for rest of year — structurally higher
- 7-day realized vol of tech momentum collapsed — funds hedged/deleveraged -
Technical Levels & Setups OR Macro Drivers (📌):
- AI CapEx certainty and adoption driving earnings, revenue, and margin expansion across sectors
- PMI rising from below 50 to near 60, with durable goods confirming — AI trade as macro engine
- Factor vol divergence from index vol signals crowding and high gross leverage; creator sees peak gross leverage and structural vol decline ahead
- Technical setup: 3-month pennant breakout, multiple indices at all-time highs, VIX and single-name vol mean-reverted
- Creator recommends Gavin Baker interview as must-listen for AI/agents context -
Risk/Reward Framework (⚖️):
- Entry: Not established by the available evidence.
- Stop: Not established by the available evidence.
- Targets: Not established by the available evidence.
- Risk/Reward: Not established by the available evidence.
- Position Size: Not established by the available evidence.
- Probability: Not established by the available evidence. -
Scenario Analysis (🔄):
| Scenario | Probability | Target | Trigger |
|---|---|---|---|
| Bull | Not established by the available evidence. | Not established by the available evidence. | Follow-through days after panic; S&P holds above upward-sloped 200-day MA; factor vol stays in 25-30 range; global indices and thematic names make new highs |
| Base | Not established by the available evidence. | Not established by the available evidence. | Lower-volume rally with bearish sentiment and reads on September/midterms; investors chase but no immediate breakdown; creator sees false breakout possibility |
| Bear | Not established by the available evidence. | Not established by the available evidence. | Taking out recent lows (creator says he'd be surprised); factor vol breaks higher again; gross leverage reduction fails; contagion to credit (CDX widening) or global markets (e.g., KOSPI) | -
Risk Factors (⚠️):
- Factor vol breaking away from index vol suggests index puts are ineffective hedges — need factor-aware tools
- Crowding and leverage: factor vol structurally higher increases speed-crash risk
- Bearish sentiment persists in rally; false breakout potential
- If earnings revisions or PMI roll over, bull case weakens
- Global markets (KOSPI, DAX, FTSE) at highs could reverse on exogenous shock
- Creator's claims about 'peak gross leverage' and factor vol structural shift are unverified; no historical validation provided
- Palantir's numbers cited as proxy for AI adoption; private AI-native companies not directly observable -
Actionable Trading/Allocation Plan (🎯):
- Monitor divergence between factor vol and index vol; confirm whether factor vol stays in 25-30 range or re-accelerates
- Track 50-day rate of change on thematic portfolio approaching 20% threshold for risk reduction signals
- Verify S&P and other indices remain above rising 200-day moving average with breadth follow-through
- Watch PMI, durable goods, and earnings revisions for sustainability of AI-driven macro strength
- Assess leverage indicators (e.g., factor vol, gross leverage) to see if deleveraging continues or peaks
- Check global indices (KOSPI, DAX, FTSE, IWM, equal-weight S&P) for breadth and leadership confirmation
- Listen to Gavin Baker interview as recommended for AI/agents context, and compare with creator's claims
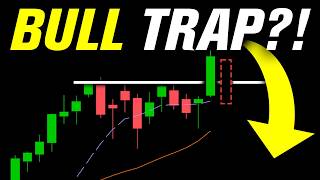
-
Creator Horizon Category (⏱️): Short-Term Technical — The creator's plan is built around weekly/daily/hourly price levels, index expected moves, and the upcoming Wednesday CPI catalyst.
-
One-Line Thesis (💡): The creator claims the S&P 500 has made a new all-time high while the Nasdaq's rally may have been a momentum burst rather than a structural breakout, leaving the market in a tension between bullish follow-through, an ideal higher low, or a frustrating bull-trap pullback.
-
Key Data Points (📊):
- Software/IGV cited as potential new leadership; XBI, ARCG, and genomics names highlighted as constructive
- CPI is the main event Wednesday morning, with shelter inflation cited as the key subcomponent
- Fed Watch odds cited: 55.6% probability of a pause in September, 47.4% probability of a hike in October
- Earnings mentions: Rocket Lab, HIMS, USAR/MP, Coreweave, Nebius, Light, Cerebras, Coherent, Envis, and others
- VIX cited as 'melting' lower; VIX constituent-weight volatility compressing, viewed as a setup for tighter action in high-momentum names -
Technical Levels & Setups OR Macro Drivers (📌):
- Buyer control indicated by market internals: light pullback volume on Wednesday/Thursday selling days versus heavier volume on Monday/Tuesday up days
- S&P 500 structure: weekly higher high with close above the prior weekly range and bull flag; ideal higher low at 758–760, with a lower high sub-760 flagged as a warning
- Nasdaq 100 structure: valid follow-through day on Tuesday and reclaimed key moving averages; a failed breakdown above 686 gives the index 'benefit of the doubt'
- Sector rotation: semiconductors (+9.85% weekly) and XLK (+8.02%) led; defensive sectors XLU, XLP, and energy lagged; risk-on posture cited as bullish
- Software vs. hardware rotation thesis: creator suggests new leadership may emerge in software/IGV while memory/DRAM charts look poor (MU, WDC, SKHY)
- CPI-driven multiple expansion scenario: if CPI is cooler, rates fall, and the Nasdaq could play catch-up to the S&P at all-time highs -
Risk/Reward Framework (⚖️):
- Entry: Not established by the available evidence.
- Stop: Not established by the available evidence.
- Targets: Not established by the available evidence.
- Risk/Reward: Not established by the available evidence.
- Position Size: Not established by the available evidence.
- Probability: Not established by the available evidence. -
Scenario Analysis (🔄):
| Scenario | Probability | Target | Trigger |
|---|---|---|---|
| Bull | Not established by the available evidence. | Not established by the available evidence. | Verify the trigger against the source evidence. |
| Base | Not established by the available evidence. | Not established by the available evidence. | Market fails at highs but holds the cited higher-low zones; pullbacks occur on light volume; internals stay neutral-to-positive |
| Bear | Not established by the available evidence. | SPY lower high sub-760 and loss of bull-flag range low would be 'game over'; QQQ losing 707 with no reclaim; SMH losing 548 | Verify the trigger against the source evidence. | -
Risk Factors (⚠️):
- Hot CPI print: creator warns that a hot CPI shifts odds toward a hike in the next meeting and could derail the rally
- Shelter inflation spike: creator specifically flags an aggressive uptick in shelter as a danger to small caps and rates
- Overhead supply in tech: SMH still under a flattened 50 SMA; memory/DRAM names (MU, WDC, SKHY) remain in downtrends
- Leadership risk: if software leads but semiconductors fail, the market could face a 'headache' and the rally may not be sustainable
- False breakout risk: the S&P's move is described as possibly just a 'momentum burst' after LEO was 'well made aware of his situation' — the creator explicitly floats the possibility of a 'massive bull trap' -
Actionable Trading/Allocation Plan (🎯):
- Monitor Wednesday CPI and shelter inflation specifically; verify whether odds for a September pause (~55.6%) and October hike (~47.4%) shift
- Track SPY on a pullback to 758–760: verify a reclaim/close above 760 or a lower high sub-760
- Watch the semiconductor vs. software leadership signal: verify whether IGV/software continues to outperform memory/DRAM names
- Watch the VIX and VIX constituent-weight volatility: verify whether the compression leads to tighter setups in high-momentum names
- Verify value-area break on ES futures roughly in the 779s to confirm bullish commitment at higher prices

-
Creator Horizon Category (⏱️): Short-Term Technical — The video is a weekly technical review focused on near-term support levels, sector rotation, range breaks, and the coming week's setup.
-
One-Line Thesis (💡): The creator asserts bulls are back in control, with rotation broadening into new highs, and the path is higher as long as the referenced 'low of Thursday' and weekly EMA 12 hold as support, while memory remains the main missing confirmation.
-
Key Data Points (📊):
- S&P 500 made new all-time highs; Nasdaq not yet at all-time highs because it has more ground to make up — creator cites a '50% plus bounce retracement.'
- Weekly EMA 12 is the creator's bull/bear guide: 'If weekly EMA 12 is support, the bulls are in complete control.'
- SMH is in a weekly bounce, but the creator says a weekly lower high is the most likely scenario and he is anticipating range-bound trade for a while.
- DRAM has not confirmed a daily uptrend; the weekly stair step was failed 'by one penny.'
- MAGS and IGV broke bull from three-day equilibriums; MAGS is a seven-day stair step, so daily consolidation is expected.
- NVDA had a monthly bull flag and the 'second highest weekly close in NVDA history.'
- PLTR set a 3-month higher low after a 50% retracement and is at the highest level in 6-plus months.
- XLF is the fourth/fifth highest close in ETF history; XLV is the third highest close.
- Utilities made all-time highs; materials (XLB) is testing resistance after months of sideways.
- MP had weekly lower highs for 5 weeks; a stair-step break could bring follow-through.
- IONQ is up 35% from the lows; a monthly higher low is the most likely scenario per the creator.
- SpaceX broke bull at 3630 and quickly rose 15%; double-bottom support at 104.83/105.11; next resistance zone is upper 140s.
- Silver stair-step broke bull at 4276; gold miners hit 3-month highs and set a monthly higher low.
- On August 5, all major sectors hit the low of the day simultaneously for the first time in weeks; the creator ignored it because SMH did not confirm a new low. -
Technical Levels & Setups OR Macro Drivers (📌):
- Pre-defined rotation signal: when semis top, XLF and XLV going to all-time highs was the confirmation to stay bullish through the semiconductor pullback.
- Short-term line in sand: 'If the low of Thursday is support, you're bullish'; losing it would require reassessment.
- Daily higher low on Nasdaq marked from hourly oversold conditions; creator says a daily higher low means 'brain off' bullish bias.
- Semis: weekly bounce underway; creator expects SMH to form a weekly lower high, then ideally a weekly higher low, with September as a timeframe.
- Memory: DRAM, Korea, and MU are in tight ranges; volatility is expected in the first couple of days of the coming week as the range breaks.
- MAGS/IGV broke bull from three-day equilibriums, helped by earnings; Amazon and PLTR are cited as standout bulls.
- Inverse correlation shift: semis and memory bouncing while XLF/XLV are not consolidating hard is a bull-favorable change.
- Metals: falling wedges with monthly higher low as the most likely scenario; dollar weakness and a market sentiment shift support the bull break.
- SpaceX: the share unlock was a known event and 'priced in'; the bottom is in for now, with a first daily uptrend in the stock's history.
- Oil/energy: watching for a weekly higher low, with energy preferred because of its shallower retracement. -
Risk/Reward Framework (⚖️):
- Entry: Not established by the available evidence.
- Stop: Not established by the available evidence.
- Targets: Not established by the available evidence.
- Risk/Reward: Not established by the available evidence.
- Position Size: Not established by the available evidence.
- Probability: Not established by the available evidence. -
Scenario Analysis (🔄):
| Scenario | Probability | Target | Trigger |
|---|---|---|---|
| Bull | Not established by the available evidence. | S&P 500 new all-time highs; Nasdaq all-time highs are described by the creator as high-conviction but timing unspecified. | The referenced 'low of Thursday' holds as support, memory breaks bull and gets a weekly bounce underway, and semis get another leg up beyond a 50% bounce retracement. |
| Base | Not established by the available evidence. | SMH trades range-bound, forms a weekly lower high, and eventually a weekly higher low into September. | Semis bounce but stall into a weekly lower high; memory remains range-bound/tight; Nasdaq continues making up ground without yet confirming a daily uptrend. |
| Bear | Not established by the available evidence. | A weekly lower high in SMH forms on the sooner side, and the short-term bullish thesis is invalidated. | Memory breaks bear, the low of Thursday is lost, or repeated days of all major sectors making simultaneous lows signal a long-term top rather than rotation. | -
Risk Factors (⚠️):
- If memory breaks bear, SMH could shape a weekly lower high on the sooner side, limiting the upside in semis.
- Losing the referenced 'low of Thursday' would force the creator to step back and reassess the bullish setup.
- A long-term market top would likely be signaled by money leaving the market, not rotating; repeated simultaneous sector lows would be a red flag.
- Creator notes there is little fundamental data before the next FOMC, leaving headline risk (including Iran-related oil/energy headlines) as a potential market driver.
- Verification gap: cited charts, intraday levels, and sector low signals are not independently confirmed from the evidence. -
Actionable Trading/Allocation Plan (🎯):
- Monitor whether the referenced 'low of Thursday' holds as support on the S&P 500 and Nasdaq; losing it would be a reassessment trigger.
- Watch memory (DRAM, Korea, MU) for a break of its tight range in the first couple of days of the coming week.
- Track SMH to see whether it forms a weekly lower high, and then ideally a weekly higher low into September.
- Observe whether XLF and XLV continue making all-time highs while semis bounce, confirming the rotation is still bullish.
- Monitor SpaceX-related earnings/volatility and whether price holds the cited double-bottom support zone before testing the upper-140s resistance.
- Watch oil and energy for a weekly higher low, with energy preferred by the creator because of its shallower retracement.

-
Creator Horizon Category (⏱️): Short-Term Technical — Creator frames the session around the jobs report, pre-market action, and an intraday melt-up prediction for that same day.
-
One-Line Thesis (💡): The creator claims that the jobs report (-255k vs +50k low estimate, a three-standard-deviation miss) kills the dollar, boosts bonds, pressures the yen, and combined with strong software earnings, sets up a likely intraday melt-up while warning against chasing daily options.
-
Key Data Points (📊):
- -255,000 vs +50,000 lowest estimate — jobs report miss
- Three standard deviations — analyst miss magnitude
- 2,000% bid on TEAM options — overnight option move
- Corsair at $13 — price reference for CRSR
- Microsoft at $502 — price reference for MSFT
- SPY $800 call — a daily option contract observed by creator
- Software up 24-27 — intraday sector strength (units unclear)
- Half a percent — possible S&P end if no melt-up
- I think we're going to melt up — creator's directional prediction -
Technical Levels & Setups OR Macro Drivers (📌):
- Jobs report miss as primary catalyst
- Software earnings beats (TEAM, Twilio, Zscaler, etc.) supporting leadership
- Weak dollar and bond rally from jobs data
- Pre-market strength and prior-day reversal pattern (creator references yesterday's reversal)
- Creator's prediction of melt-up after about an hour
- Retail dumping meme stocks and moving defensive (creator observation)
- Watch list includes ABNB, TEAM, MSFT, CRSR, AAPL, NFLX, IGV, LNG, FIGS, CART, GOOGL, NRXP, FSLY, DDOG, ORCL, PLTR, UBER, TSLA -
Risk/Reward Framework (⚖️):
- Entry: Not established by the available evidence.
- Stop: Not established by the available evidence.
- Targets: Not established by the available evidence.
- Risk/Reward: Not established by the available evidence.
- Position Size: Not established by the available evidence.
- Probability: Not established by the available evidence. -
Scenario Analysis (🔄):
| Scenario | Probability | Target | Trigger |
|---|---|---|---|
| Bull | Not established by the available evidence. | Not established by the available evidence. | If pre-market strength holds and a melt-up develops after about an hour (creator's stated prediction) |
| Base | Not established by the available evidence. | Not established by the available evidence. | If no melt-up occurs, creator expects market to end around half a percent higher |
| Bear | Not established by the available evidence. | Not established by the available evidence. | If pre-market gains fade, creator says 'head on a swivel' — implied risk of reversal | -
Risk Factors (⚠️):
- Daily options risk rapid decay — creator warns 'dailies will get crushed'
- Retail mania on useless calls — creator explicitly warns against buying far OTM contracts (e.g., SPY $800 call)
- Misunderstanding strategy leads to losses — creator says 'if you can't follow it, you're going to literally lose'
- Potential reversal if leadership fails — creator says 'head on a swivel' and notes back-and-forth rotation
- Jobs data could be revised or affect Fed policy unexpectedly — creator says rate hike calls would have been a mistake -
Actionable Trading/Allocation Plan (🎯):
- Verify jobs report figures (-255k actual, +50k lowest estimate) via official BLS release
- Monitor dollar index and USD/JPY reaction to the jobs miss
- Track TEAM options bid (creator mentions 2,000% bid) and MSFT price around $502
- Watch for melt-up after the first hour of trading (creator's stated timing)
- Confirm creator's long-term additions (Corsair) and his stated GOOGL position
- Avoid daily options unless fully understanding the strategy (creator's repeated warning)

-
Creator Horizon Category (⏱️): Short-Term Technical — Creator is analyzing pre-market and opening intraday rotations, earnings reactions, and Mag 7/sector leadership on August 6, 2026.
-
One-Line Thesis (💡): Creator sees an unresolved battle between a tech/AI/software selloff (with 'still yet to have one good AI earnings') and rotation into staples/healthcare/financials, while Mag 7 names like Apple, Microsoft, and Nvidia may lead a bounce — with Data Dog's punishing 1% margin miss (after 20–30% guidance raise) as the symbol of overreaction.
-
Key Data Points (📊):
- Data Dog (DDOG) — '1% margin miss', guided up 20–30%, 'solid ass print', but 'worst day on record' per creator.
- IWM — 'down by .3' (small caps).
- NASDAQ — 'down one' (roughly 1%) early, later 'recovered about half a percent'.
- IGV — 'down 3' (software).
- Microsoft — 'loves that 490' (level).
- Google — 'crushed' on departure of someone yesterday, later turned green.
- Zillow — 'great but restructuring... that one's dead'.
- Fastly — creator 'sold most of the Fastly yesterday' but 'they killed it' (positive move).
- Ralph Lauren (RL) — 'doing good' among non-AI.
- Snowflake — 'actually doing good' (creator notes 'that one's weird').
- Apple — 'jacked up', 'I like Apple still'.
- Nvidia — 'green', named as lead.
- Tesla — 'red' among Mag 7.
- Gold and silver — 'massive yesterday', watching for two-day continuation.
- Pizza — 'cut the dividend' per creator.
- UMC — creator claims 'made a deal with himself to dilute'.
- Space stocks — 'Rocket Lab, Lunar, and SpaceX' (latter via exposure) 'crazy' after I/O (?) good earnings beats. -
Technical Levels & Setups OR Macro Drivers (📌):
- AI/software earnings misses 'even though they weren't misses' — smallest possible misses, punishing reactions.
- Bond market 'game of chicken' and 'Google adding more bonds' as macro background.
- Google reacted to company departure; creator notes 'Mag 7's moving'.
- Rotation sectors 'XLP, XLF, XLV' are in play; staples/healthcare/financials gapping up.
- Watch whether rotation holds or 'dump the rotation and then go right to the tech'.
- Data Dog/Fastly sympathy move dragging Cyber and other software names — 'today could be a plant day for Cyber'.
- Mag 7 (Apple, Microsoft, Meta, Nvidia, Google) green while 'rest of 493' mostly down; Tesla red.
- Creator's plays: 'Clove, Data Dog, Apple, RL, and Net' — Data Dog 'moved the most off the morning'.
- Fastly sold; 'sold most of the Fastly yesterday' but seeing follow-through.
- SanDisk/WDC moving up; creator says 'nothing was bad about SanDisk' but names not rewarded.
- Creator notes 'a whole new draft class' possible after earnings.
- CRM calls — creator says 'only issue is the timing', no explicit strike/expiry. -
Risk/Reward Framework (⚖️):
- Entry: Not established by the available evidence.
- Stop: Not established by the available evidence.
- Targets: Not established by the available evidence.
- Risk/Reward: Not established by the available evidence.
- Position Size: Not established by the available evidence.
- Probability: Not established by the available evidence. -
Scenario Analysis (🔄):
| Scenario | Probability | Target | Trigger |
|---|---|---|---|
| Bull | Not established by the available evidence. | Not established by the available evidence. | Mag 7 (especially Apple, Microsoft, Nvidia) keeps leading, chips turn green, and Cyber/software recover without killing rotation — creator notes 'if you get cyber up, software recovers without killing anything, it might look good'. |
| Base | Not established by the available evidence. | Not established by the available evidence. | Continued 'back and forth' between tech and staples; rotation sectors (XLP/XLF/XLV) give back gains but tech/AI doesn't fully bounce; SPY hovers near open. |
| Bear | Not established by the available evidence. | Not established by the available evidence. | If 'everything bounces, the Mag sevens will come down' or staples/healthcare/financials hold while software/cyber/chips keep selling off — creator flags 'no good AI earnings' and punishing software reactions as downside pressure. | -
Risk Factors (⚠️):
- Creator explicitly says 'we still have yet to have one good AI earnings' — AI/tech earnings are failing to reward quality prints.
- Data Dog type reaction (1% miss, 20–30% guide up still crashes) shows market punishing even minimal misses.
- Bond 'game of chicken' and Google bond additions could create macro pressure.
- Google departure headline caused a 'crushed' reaction, though later green.
- Creator notes cyber is 'very illiquid' outside Palo Alto — exacerbates moves.
- Rotation could reverse and 'dump the rotation and then go right to the tech'.
- Creator's own commentary is informal and contains unclear references (e.g., 'Isha', 'eelcloud', 'MNA') — verification needed. -
Actionable Trading/Allocation Plan (🎯):
- Monitor whether Mag 7 (Apple, Microsoft, Meta, Nvidia, Google) hold gains vs Tesla red — specifically Apple 'jacked up' and Nvidia as lead.
- Track rotation sectors XLP (staples), XLF (financials), XLV (healthcare) vs IGV (software), Cyber (IGV? cybersecurity), and chips (SMH) for continuation/reversal.
- Watch Data Dog, Fastly, and Snowflake for sympathy moves into Cyber and other software names — creator labels today could be a 'plant day' (basement) for cyber.
- Check gold and silver for second-day strength after 'massive' prior day.
- Assess SanDisk/WDC memory move and whether 'nothing bad' earnings finally get rewarded.
- Review Google headline (company departure) and bond-related news to confirm direction.
- Monitor spacing/timing of CRM calls — creator says 'only issue is the timing'.

-
Creator Horizon Category (⏱️): Long-Horizon Macro / Structural — The creator describes a long-term evolution in investment philosophy about management assessment, not a time-bound market call.
-
One-Line Thesis (💡): Management quality is now weighted more heavily than moats in stock selection, with the primary goal being avoidance of left-tail blow-ups through humility and alignment signals.
-
Key Data Points (📊):
- 60/70 moat and 30 management weighting at Dorsey Asset launch in 2014 — creator says weighting is now roughly the reverse.
- 12 stocks — portfolio concentration size cited by creator.
- CoStar — example of pattern recognition failure: company killed it in CRE data and apartments, but creator avoided betting on success against Zillow due to suspected lack of alignment.
- Zillow — competitor to CoStar in cited example.
- GE — Larry Culp cited as a non-founder doing a phenomenal turnaround.
- Founder mode talk — creator explicitly 'hates' it, citing CEO skill set versus manager skill set.
- Theranos, Wirecard, Enron — cited as corporate fraud/hubris examples with common attribute of people unwilling to listen.
- Australia — example of CEO owning headquarters and leasing back to company, indicating misalignment.
- Warren Buffett quote about 'any idiot can run it' — creator says the phrase has done 'more harm than good'. -
Technical Levels & Setups OR Macro Drivers (📌):
- Look for humility in management — ask about do-overs, best advice from board members, least-losing team member.
- Assess alignment via I-vs-we language, incentive plans, and corporate actions (e.g., moving HQ for personal preference).
- Founder-run businesses are not inherently better; assess on level playing field, avoid privileging founders.
- Capital allocation is a rare skill among CEOs — most rise through political/operational roles, not capital allocation experience.
- Avoid 'trust me' managers in concentrated portfolios due to left-tail risk; style choice but riskier at 12-stock count. -
Risk/Reward Framework (⚖️):
- Entry: Not established by the available evidence.
- Stop: Not established by the available evidence.
- Targets: Not established by the available evidence.
- Risk/Reward: Not established by the available evidence.
- Position Size: Not established by the available evidence.
- Probability: Not established by the available evidence. -
Scenario Analysis (🔄):
| Scenario | Probability | Target | Trigger |
|---|---|---|---|
| Bull | Not established by the available evidence. | Not established by the available evidence. | Management team demonstrates humility, listens to dissenting voices, and shows alignment through ownership and incentive structure — e.g., avoids value-destructive spending or pivots when data shows failure. |
| Base | Not established by the available evidence. | Not established by the available evidence. | Management quality is genuinely assessed via do-over questions, board advice, and capital allocation track record; portfolio remains concentrated but avoids obvious frauds and hubris cases. |
| Bear | Not established by the available evidence. | Not established by the available evidence. | Left-tail event triggered by 'trust me' manager or founder with unchecked ego — e.g., CoStar-style sustained spending without accountability, or management ignoring negative feedback until blow-up. | -
Risk Factors (⚠️):
- Founder-led businesses may be overvalued due to survivorship bias and Silicon Valley self-promotion.
- Management assessment is squishier than moat analysis; signals can be misleading or manipulated.
- Conflating business quality with personal identity can lead to missed red flags.
- Concentrated portfolio amplifies impact of a single management failure.
- Creator's framework relies on subjective judgments (humility, alignment) that are hard to verify externally. -
Actionable Trading/Allocation Plan (🎯):
- Monitor management interviews for use of 'I' vs 'we' and responses to do-over questions as a humility filter.
- Check for related-party transactions (e.g., CEO leasing property to company) as a misalignment flag.
- Review CEO capital allocation history and whether they have sold stock along the way, as in the CoStar case.
- For any company, independently verify whether founder/CEO has evolved from founder skill set to manager skill set (e.g., Zuckerberg example).
- When a company diversifies or enters a new market, assess whether management has ever faced and handled failure; lack of failure experience may signal inability to cut losses.

-
Creator Horizon Category (⏱️): Short-Term Technical — The creator analyzes intraday, daily, weekly, and monthly EMA and price-action levels across equity indexes, ratios, and metals rather than long-horizon fundamentals.
-
One-Line Thesis (💡): Joey argues the market has V-shaped from fear to FOMO with the S&P 500 at new all-time highs, while semiconductors/memory remain relatively out of favor, and that metals have begun a bullish domino process in which breakouts bleed across gold, silver, miners, platinum, and palladium.
-
Key Data Points (📊):
- S&P 500 made new all-time highs after the V-shape; bulls want prior all-time highs to hold on the next pullback.
- Nasdaq retraced over the 50% level of the pullback, increasing the odds of a monthly bull flag.
- Nasdaq hourly oversold is around 29,300; next support zone cited is approximately 28,800–28,600.
- SMH/QQQ two-day EMAs crossed bearish for the first time since 2024, after being bull since May 2025.
- Semis/memory had been riding weekly 12 EMA since 2025, and that has been lost.
- XLF key level cited at 5618; XLV level cited at 16073.
- IGV hourly oversold is around 97.
- NUGT was up about 44% from the lows at the time of the video.
- Platinum broke out of its 4-hour tightening range, referenced in a July 30 tweet, and was followed by silver and gold range breakouts.
- GDX closed over weekly 12 EMA, increasing the odds that gold and silver can do the same; gold is testing weekly 12 EMA.
- Silver has broken out of its range but still needs to break out of its falling wedge, per the thesis.
- XAU/XAG ratio bouncing from weekly 12 EMA is called a red flag for the metals thesis today.
- AVGO is 15% off the bottom; REMX is 42% off its highs.
- Bitcoin weekly lower high was set off the 12 EMA; Bitcoin/QQQ ratio needs to get over weekly 12 EMA for a shift in view. -
Technical Levels & Setups OR Macro Drivers (📌):
- Fear-to-FOMO V-shape: semis and memory dragged QQQ/SMH down, but XLF and XLV did not participate in the downside; once semis/memory found temporary bottoms, the market V-shaped to new highs.
- Semiconductor/memory relative weakness: SMH/QQQ ratio did not confirm the strong bounce, two-day EMAs crossed bearish, and SMH remains structurally different from MAGS and IGV; MU and SNDK have not confirmed daily uptrends.
- KOSPI is cited as a key influence on semiconductors and memory; a monthly higher low off the 12 EMA is possible, but bulls need to prove something before it adds confidence in SMH and DRAM.
- Metals caution: GDX/GLD ratio is in a resistance/lower-high zone, gold is testing weekly 12 EMA, and XAU/XAG is bouncing from weekly 12 EMA, so a short-term cool-off would not surprise.
- Bitcoin setup: weekly lower high off the 12 EMA is the resistance reference; a weekly uptrend confirmation would require Bitcoin/QQQ ratio over weekly 12 EMA.
- Oil setup: weekly lower high scenario played out; now looking for a weekly higher low with a daily downtrend guide. -
Risk/Reward Framework (⚖️):
- Entry: Not established by the available evidence.
- Stop: Not established by the available evidence.
- Targets: Not established by the available evidence.
- Risk/Reward: Not established by the available evidence.
- Position Size: Not established by the available evidence.
- Probability: Not established by the available evidence. -
Scenario Analysis (🔄):
| Scenario | Probability | Target | Trigger |
|---|---|---|---|
| Bull | Not established by the available evidence. | New all-time highs for the Nasdaq if semiconductors, memory, MAGS, and IGV all come back to life. | Hourly oversold marks daily higher lows across markets; S&P holds prior all-time highs and daily 12 EMA on the next pullback; SMH/QQQ ratio turns bullish again. |
| Base | Not established by the available evidence. | Continued range work in the Nasdaq around the cited hourly oversold level near 29,300 and support zone around 28,800–28,600. | Semiconductors/memory stay weak while MAGS and IGV remain strong; true 4-hour downtrend is not confirmed and hourly oversold does not confirm a daily higher low. |
| Bear | Not established by the available evidence. | Potential weekly bear flag in SMH and tech working back down toward the recent lows. | Bears confirm a 4-hour downtrend from the current Nasdaq balance; SMH/QQQ ratio remains bearish; memory names such as MU and SNDK continue to fail. | -
Risk Factors (⚠️):
- SMH/QQQ ratio is showing bearish divergence and two-day EMAs have crossed bearish, so the bounce in semis/memory may not be sustainable.
- MU and SNDK have not confirmed the daily uptrend, with SNDK showing a possible head-and-shoulders and MU fixing for a gap down.
- Metals risk: GDX/GLD ratio is at a resistance/lower-high zone and XAU/XAG ratio is bouncing from weekly 12 EMA, a red flag for the metals thesis.
- A one-day coincidence of XLF, MAGS, IGV, SMH, and memory all rallying together is flagged as a potential blow-off/exhaustion signal if rotation stops.
- The creator provides no explicit price entry, stop, target, position size, or probability for most trades, so the evidence cannot verify risk/reward parameters. -
Actionable Trading/Allocation Plan (🎯):
- Monitor whether hourly oversold near 29,300 marks a daily higher low in the Nasdaq on the next consolidation.
- Track the SMH/QQQ two-day EMA cross and weekly 12 EMA regain in semis/memory as confirmation they are coming back into favor.
- Watch metals weekly 12-EMA tests, particularly gold's current test, silver's falling-wedge breakout, and the XAU/XAG ratio for confirmation or invalidation.
- Follow XLF/SPY and XLV/SPY ratios against QQQ/SPY to confirm rotation continues rather than broad-market simultaneous upside.
- Check Bitcoin/QQQ ratio versus weekly 12 EMA; a sustained break above would be the trigger to shift from bearish to interested.
- Monitor oil for a weekly higher low after the weekly lower high has played out.
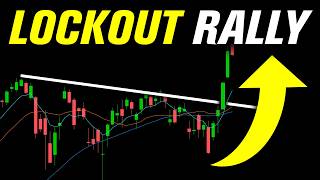
-
Creator Horizon Category (⏱️): Short-Term Technical — Creator analyzes daily and hourly charts, all-time highs, and near-term pullback scenarios; the focus is on intraday and daily price structure rather than long-horizon macro.
-
One-Line Thesis (💡): The market's rapid rally after a failed breakdown is constructive but likely to be difficult to navigate; the creator says the real action is in making a daily higher low after the new all-time high, but he warns that a textbook pullback may be 'too easy' and remains open to multiple paths, with the only objective being a tight-stop long entry.
-
Key Data Points (📊):
- SPY new all-time high, with the prior intraday reversal low at 760.25 as the higher-low reference level.
- SanDisk (SNDK) gapping down on earnings after hours to 5240-5250, near Monday's highs; creator calls SNDK a 'market darling'.
- SMH (semiconductor ETF) after hours at 568-570, roughly flat; SMH shows a sequence of lower highs and a lower low from the trend count.
- QQQ logged a follow-through day on higher volume on day four of the rally attempt, per the creator; sustaining above the 707 area (gap-fill reversal and daily 20 SMA) is constructive.
- Creator admits he is 'under exposed' to the rally and says the speed and divergence in high-beta growth names are notable.
- Reference to an earlier April follow-through day and gap up that led directly to all-time highs, contrasted with the current setup.
- Creator notes the left-side peak and Tuesday's all-time-high session showed no aggressive sellers; pullback is due to profit-taking and lack of new buyers, not active selling.
- In the hourly chart, the creator cites 77250s as a downside reference and the previous day's low as a trigger for a failed-breakdown or double-top scenario. -
Technical Levels & Setups OR Macro Drivers (📌):
- Divergence between SPY's strong rally and high-beta growth names still in short-term downtrends.
- SanDisk's earnings gap-down weighs on the 'memory names' and semis.
- SMH lower-high pattern and after-hours flatness contrast with SPY strength.
- QQQ follow-through day on higher volume suggests institutional buying, but the Nasdaq composite did not confirm per IBD.
- Creator emphasizes that the market's habit of making moves 'difficult' (e.g., the lockout rally after the inverted H&S) should be respected.
- A 'look below and fail' at the previous day's low, or a sideways consolidation, could set up a long entry on a reclaim of Tuesday's high.
- A double-top scenario could offer a short if price fails under a neckline. -
Risk/Reward Framework (⚖️):
- Entry: Not established by the available evidence.
- Stop: Not established by the available evidence.
- Targets: Not established by the available evidence.
- Risk/Reward: Not established by the available evidence.
- Position Size: Not established by the available evidence.
- Probability: Not established by the available evidence. -
Scenario Analysis (🔄):
| Scenario | Probability | Target | Trigger |
|---|---|---|---|
| Bull | Not established by the available evidence. | Not established by the available evidence. | Verify the trigger against the source evidence. |
| Base | Not established by the available evidence. | Not established by the available evidence. | Sideways consolidation above the previous day's low, potentially an inside bar, then an upside breakout to new all-time highs; creator sees this as 'too easy' but possible. |
| Bear | Not established by the available evidence. | Not established by the available evidence. | A double top forms under Tuesday's high and price breaks below today's low (neckline); creator says he would be willing to try a short if the neckline breaks. | -
Risk Factors (⚠️):
- Creator explicitly warns that expecting a textbook higher low is likely 'naive' given the market's recent pattern of locking out buyers.
- Divergence in high-beta growth names (e.g., SMH, SanDisk) could weigh on the broader index if earnings gaps worsen.
- SanDisk's post-earnings gap-down may spill into semiconductor sentiment and the memory complex.
- The rally lacks the typical capitulation low and volume confirmation; a sharp reversal could occur if the market 'overshoots' to the downside.
- The creator's stated under-exposure means he may force lower-quality entries if he chases strength. -
Actionable Trading/Allocation Plan (🎯):
- Watch the 'look below and fail' at the previous day's low; if the low holds and price reclaims Tuesday's high, that could be a long trigger per the creator.
- Track SMH (and SanDisk) price action after hours and during the next session to see if the semiconductor weakness persists or reverses.
- Verify QQQ's follow-through day and whether the 707 area (gap-fill reversal and daily 20 SMA) holds as support.
- Observe whether the market gives any intraday higher low that allows a tight stop; otherwise, the creator sees the rally as difficult to manage risk on.

-
Creator Horizon Category (⏱️): Long-Horizon Macro — Creator emphasizes weekly/monthly time frames and long-term portfolio goals, contrasting with failed short-term full-time trading attempts.
-
One-Line Thesis (💡): TheChartGuys argues that retail investors do not need to become full-time traders to benefit from technical analysis; applying it on weekly or monthly time frames for positioning, protecting, and hedging can help long-term goals even with 50-200 hours of study, referencing the 2020-2021 surge of failed full-time trading attempts.
-
Key Data Points (📊):
- 2020-2021 surge in people trying to become full-time traders due to COVID, markets ripping, government free money
- Many of those full-time trading attempts did not work out
- You don't have to be a full-time trader to benefit from technical analysis
- Slow and steady approach used by 'boomer dads' over decades
- Technical analysis useful for positioning, protecting, hedging
- Identifying trend on weekly or monthly time frame beneficial for long term
- Even 50, 100, or 200 hours of study can benefit long-term goals
- Suggested determining the right amount of attention/effort, but not zero -
Technical Levels & Setups OR Macro Drivers (📌):
- Behavioral shift during COVID lockdowns pushed many retail participants into full-time trading, used as a contrast to the creator's recommended slower, longer-term approach
- The creator cites free government money and strong markets as drivers of the 2020-2021 surge -
Risk/Reward Framework (⚖️):
- Entry: Not established by the available evidence.
- Stop: Not established by the available evidence.
- Targets: Not established by the available evidence.
- Risk/Reward: Not established by the available evidence.
- Position Size: Not established by the available evidence.
- Probability: Not established by the available evidence. -
Scenario Analysis (🔄):
| Scenario | Probability | Target | Trigger |
|---|---|---|---|
| Unavailable | Not established by the available evidence. | Not established by the available evidence. | Verify source evidence. | -
Risk Factors (⚠️):
- No measurable validation of the claimed benefit from 50-200 hours of technical study; the evidence is anecdotal
- No specific tickers, levels, or backtested results are provided to verify the effectiveness of the approach
- The 2020-2021 historical reference is used without specific data on failure rates or outcomes -
Actionable Trading/Allocation Plan (🎯):
- Verify the claim that 50-200 hours of technical analysis on weekly/monthly charts improves long-term portfolio outcomes by reviewing educational materials and historical case studies
- Monitor weekly/monthly trend identification as a practice for positioning, protecting, and hedging, as suggested by the creator
- Investigate the 2020-2021 surge in full-time trading to understand the context and outcomes cited

-
Creator Horizon Category (⏱️): Short-Term Technical — Intraday momentum, gap levels, option premiums, and same-week earnings reactions dominate the creator's analysis.
-
One-Line Thesis (💡): Creator claims market is in a 'fear to FOMO switch' with SPY potentially recording a fifth consecutive 1% gain (first since 1999), while rotation favors chips and cyber-security names and mega-cap option premiums are 'jacked' — requiring balanced, non-chasing positioning.
-
Key Data Points (📊):
- SPY 'gone up 1% four days in a row; if up 1% today, best back-to-back 1% days since 1999' — headline claim
- Nvidia at 220, 'up 2.6' early — literal price/quote
- 'AET's actually a great one... they're up 12' — earnings-related mover
- AMD reported good results but 'sold off' — creator notes AI earnings winners underperforming
- US S&P Global Composite 545 versus 536 services — data cited
- ISM services data due 'in a little bit' — catalyst cited
- Iran and Oman negotiators finalized draft Strait of Hormuz deal — headline cited
- China ban on offshore insurance — negative for HSBC and PUK — headline cited
- 'Astroenica and BMY' deal reported no longer happening — claim, name likely AstraZeneca
- Bradley Frile's pre-market streak 'unbroken since 2019, even 2018 arguably' — creator's uncorroborated streak claim -
Technical Levels & Setups OR Macro Drivers (📌):
- Chip complex leading: Nvidia, Broadcom, Dell, Qualcomm, Micron, WDC, SanDisk, GFS
- Cyber-security names continuing: Qualys, Fastly, Datadog, Zscaler
- Mega-cap/Mag 7 option premiums 'jacked' — creator cautions on chasing
- Earnings reactions diverging: good AI reports (AMD, AET) selling off, non-AI/backlog names moving
- Geopolitical headline on Hormuz and China insurance ban driving specific tickers
- Creator suggests waiting for a 'planning day' rather than buying inflated premiums -
Risk/Reward Framework (⚖️):
- Entry: Not established by the available evidence.
- Stop: Not established by the available evidence.
- Targets: Not established by the available evidence.
- Risk/Reward: Not established by the available evidence.
- Position Size: Not established by the available evidence.
- Probability: Not established by the available evidence. -
Scenario Analysis (🔄):
| Scenario | Probability | Target | Trigger |
|---|---|---|---|
| Bull | Not established by the available evidence. | Not established by the available evidence. | If SPY closes up another 1%, making five consecutive 1% days (creator says first since 1999), and chip/cyber leadership continues. |
| Base | Not established by the available evidence. | Not established by the available evidence. | SPY 'hugging the open at the gap' with sector rotation choppy; creator expects back-and-forth through earnings and advises balanced positioning. |
| Bear | Not established by the available evidence. | Not established by the available evidence. | If AI earnings winners keep selling off despite good results, option premiums remain 'jacked', and momentum fades — creator warns against blindly bullish and overly fearful extremes. | -
Risk Factors (⚠️):
- Transcription errors make tickers/quotes unreliable (e.g., 'SpaceX', 'Astroenica', 'Qualas')
- No concrete entry, stop, or target levels provided in the video
- Pre-market streak claim ('Bradley Frile') is uncorroborated and likely a private benchmark
- Creator notes option premiums are 'jacked', increasing cost of chasing
- Macro data (ISM services) and geopolitical headlines could reverse intraday moves
- AET option chain not yet open at time of commentary, limiting trade execution -
Actionable Trading/Allocation Plan (🎯):
- Verify whether SPY actually closes up 1% on Aug 5, 2026 and whether that marks the first five-day 1% streak since 1999
- Check US S&P Global composite (545 services vs 536) and ISM services print
- Monitor chip complex including Nvidia (at 220), AMD, Micron, WDC, SanDisk, Dell, Qualcomm, and GFS for continuation
- Track cyber-security names Qualys, Fastly, Datadog, Zscaler for follow-through
- Review HSBC/PUK reaction to China offshore-insurance ban and status of AstraZeneca/BMY deal
- Assess option premium affordability on Mag 7 names (Meta, Nvidia, Oracle, Palantir) before considering any trade
-
Creator Horizon Category (⏱️): Long-Horizon Macro / Structural — The discussion centers on long-term career planning, the structural impact of AI on white-collar work, and lifelong wealth-building strategies, rather than short-term market timing.
-
One-Line Thesis (💡): The creators argue that young people should prioritize building human capital and maintaining flexibility, as AI makes intelligence a commodity and homeownership is often not financially sensible in high-cost cities, while broad index investing remains the recommended baseline.
-
Key Data Points (📊):
- Over 200 companies listed on the NYSE employing more than 11 million people (from vintage ad) — cited as evidence of broad market opportunity.
- $2.5 million minimum for a decent three-bedroom apartment on Manhattan's Upper West Side (per Jack's StreetEasy review) — illustrates high cost of homeownership.
- HOA fees in New York can be $1,400/month — additional cost of owning a condo.
- Under-40 homeownership as a good investment is at its lowest level (Pew Research) — cited to support the shift to renting.
- Stock ownership by under-40s has tripled this decade (Fed data) — cited as a substitution for homeownership.
- Jack's personal example: He made more than his salary on a SPAC warrant trade when Apollo's website changed from oil rigs to windmills, leading to a Fisker deal — illustrates luck-driven gains.
- Jack's example of blowing $200k in a day on buy-now-pay-later warrants while earning $56k — illustrates risk of concentrated leverage.
- Riley's case: $10,000 to $700,000 in tax-free accounts over eight years by living in a van and saving aggressively — example of extreme frugality.
- Assuming a 10% early withdrawal penalty plus standard deduction allows a $15k/year tax-free draw from a 401k — cited as the basis for the early retirement scenario. -
Technical Levels & Setups OR Macro Drivers (📌):
- AI is becoming a commodity, making fundamental manual skills (e.g., building a financial model by hand) more valuable before layering AI on top.
- In high-cost cities, renting vs buying is skewed heavily toward renting due to prices and ancillary costs (HOA, taxes, maintenance).
- Young people have flexibility and optionality (ability to move, take risks, travel) that diminishes with age, supporting spending on experiences rather than saving every dollar early.
- Career income scaling is a key driver: Jack argues that in high-growth careers, early income is low but will rise sharply, so oversaving early may not be optimal if it can be compensated later.
- Survival and staying in the game are critical; getting blown up via leverage (e.g., margin) changes risk perception and can remove long-term compounding. -
Risk/Reward Framework (⚖️):
- Entry: Not established by the available evidence.
- Stop: Not established by the available evidence.
- Targets: Not established by the available evidence.
- Risk/Reward: Not established by the available evidence.
- Position Size: Not established by the available evidence.
- Probability: Not established by the available evidence. -
Scenario Analysis (🔄):
| Scenario | Probability | Target | Trigger |
|---|---|---|---|
| Bull | Not established by the available evidence. | Not established by the available evidence. | If young people follow the advice to focus on human capital and stay in the market, they may see significant wealth accumulation, as exemplified by the hypothetical of selling SPACs at $400k and growing to a tax-free million-dollar Roth. |
| Base | Not established by the available evidence. | Not established by the available evidence. | Renting in high-cost cities and investing in broad index funds yields moderate returns comparable to long-term stock market averages, as cited by Jack's recommendation of S&P ETFs. |
| Bear | Not established by the available evidence. | Not established by the available evidence. | Verify the trigger against the source evidence. | -
Risk Factors (⚠️):
- AI adoption could outpace human skills development, making even fundamental building blocks obsolete.
- Homeownership may remain out of reach for many in high-cost cities, but if rents rise faster than incomes, renting could become less beneficial.
- The advice to spend more early assumes future income scaling; if career paths stall, early spending could jeopardize long-term savings.
- The fire-style retirement plan (van living, 15k/year) risks social isolation and regret, especially as personal circumstances change (aging parents, friends' life milestones).
- Leverage and speculative trading (e.g., SPAC warrants) can lead to catastrophic losses even if underlying ideas are correct, as seen with Situational Awareness. -
Actionable Trading/Allocation Plan (🎯):
- Learn the fundamental, manual skills of your chosen field (e.g., building financial models by hand) before layering AI tools on top.
- Tinker with AI coding tools to automate data collection and synthesis, but verify outputs independently.
- Maintain optionality by renting in high-cost cities if homeownership is not clearly aligned with long-term family plans.
- Prioritize human capital and income growth over speculative trading, as increases in income compound more reliably than returns from margin trading.
- If using margin or leverage, use only a small 'play account' (e.g., a couple grand) to learn the emotional pain of loss, but avoid risking retirement savings.
- For grandparents funding UGMAs, consider broad index ETFs like VOO/SPY (as recommended by Jack), and focus on teaching long-term investing habits.
-
Creator Horizon Category (⏱️): Short-Term Technical — The episode focuses on July 2026 market volatility, the leveraged AI hedge fund blowup, and the market's return to all-time highs, with immediate data points.
-
One-Line Thesis (💡): The market's ability to recover to all-time highs despite a leveraged AI unwinding and extreme volatility reflects a broad and resilient bull market, but the blowup of a four-times-leveraged AI hedge fund highlights the persistent danger of leverage.
-
Key Data Points (📊):
- S&P 500 for July 2026 was down only about 10 basis points, masking extreme internal volatility.
- Situational Awareness hedge fund grew from $9.3B in March 2026 to $20B+ in June 2026 to $45B in July 2026, then sold its entire public levered book to Citadel at a 10% discount by July 30, 2026.
- The fund was up around 2700% at peak, then month-to-date fell almost 70%, but year-to-date remained up about 80% according to its investor letter.
- The fund ran at approximately four times leverage, with notional exposure estimated at half a trillion dollars.
- The day after the unwinding, semiconductor stocks like SanDisk rallied 25% in a single day.
- Retail investors sold a net $243 million of single stocks on one Tuesday in late July, the largest one-day outflow since the COVID crash.
- Cumulative daily ETF equity flows in 2026 are about 50% higher than last year's record pace, likely driven by AI-related ETFs.
- Retail favorite stocks (Goldman Sachs basket) had their worst monthly performance since 2023.
- 30-year Treasury yield reached 5.3%, and 30-year mortgage rate fell to 6.8%.
- S&P 500 reached a new all-time high on the morning of the recording. -
Technical Levels & Setups OR Macro Drivers (📌):
- The AI boom and a young founder's manifesto attracted significant capital, leading to rapid asset growth and extreme leverage.
- Leveraged bets on AI stocks and short positions against software names like Adobe created an alligator-jaws blowup when the market repriced.
- A margin call forced liquidation of the entire public book, which cascaded through semiconductor and tech names.
- Retail capitulation (largest single-day outflow since COVID) marked a local bottom, followed by a sharp rebound.
- The failure of a high-profile leveraged fund did not derail the broader bull market, with equal-weight indices near highs.
- Treasury yield curve steepening (belly of curve) and rising long-term yields provide a supportive backdrop for the 60/40 portfolio performance.
- Continued strong consumer spending (full planes, packed restaurants, boat purchases) contradict narratives of a weak economy. -
Risk/Reward Framework (⚖️):
- Entry: Not established by the available evidence.
- Stop: Not established by the available evidence.
- Targets: Not established by the available evidence.
- Risk/Reward: Not established by the available evidence.
- Position Size: Not established by the available evidence.
- Probability: Not established by the available evidence. -
Scenario Analysis (🔄):
| Scenario | Probability | Target | Trigger |
|---|---|---|---|
| Bull | Not established by the available evidence. | Not established by the available evidence. | The S&P 500 has already reached a new all-time high despite the July volatility and the leveraged unwind, indicating persistent strength. |
| Base | Not established by the available evidence. | Not established by the available evidence. | The market continues to grind higher with AI as a leading sector, supported by strong earnings from mega-cap tech and continued ETF inflows. |
| Bear | Not established by the available evidence. | Not established by the available evidence. | If a similar leveraged unwind or systemic event leads to broader forced selling, the market could experience a significant drawdown, but the episode currently treats this as a contained risk. | -
Risk Factors (⚠️):
- The potential for another leveraged unwind or a broader cryptocurrency collapse (e.g., Bitcoin still down 50% from highs) could trigger renewed volatility.
- Rising bond yields and mortgage rates could pressure housing and consumer spending, despite the stock market's resilience.
- A potential 'credibility shock' for the new Fed chair could lead to market turbulence, though the hosts dismiss the Fed's importance except in crises.
- High concentration in tech (top 10 stocks contributing heavily to index gains) increases systemic risk if AI sentiment reverses. -
Actionable Trading/Allocation Plan (🎯):
- Monitor ETF flow data (e.g., cumulative daily equity flows) for signs of momentum shifts in AI-related funds.
- Watch for further margin calls or forced liquidations in leveraged funds and retail margin accounts, especially in South Korea and the U.S.
- Track semiconductor volatility and single-stock moves (e.g., SanDisk) as a canary for risk appetite.
- Follow 30-year Treasury yields and mortgage rates for their impact on consumer spending and housing.

-
Creator Horizon Category (⏱️): Short-Term Technical — The creator discusses a midsummer meltup and a momentum crash in July that reset the bull market, indicating a near-term technical focus.
-
One-Line Thesis (💡): The stock market is at an all-time high with broad participation, and the July momentum crash reset the bull market, providing a new foundation for future gains.
-
Key Data Points (📊):
- Stock market at an all-time high today — context: broad market participation, not just a few stocks.
- Earnings beats in 10 out of 11 sectors on average — context: cited as sign of healthy rally.
- Revenue growth ahead of expectations — context: not just earnings games or buybacks.
- Analysts raising expectations for next quarter during this quarter across the S&P 500 — context: cited as bullish signal.
- International stock support, lots of IPOs, but not too many — context: cited as healthy market indicators.
- Bitcoin falling — context: cited as evidence against speculative mania.
- Dow in a 50% drawdown — context: cited as evidence of speculative excess being cleaned out.
- Momentum crash in July reset the bull market — context: creator's claim of new foundation. -
Technical Levels & Setups OR Macro Drivers (📌):
- Broad market rally with participation across defensive, cyclical, growth, value, large cap, and small cap — setup cited as healthy.
- Economists getting cautious — creator views this as a contrarian bullish signal.
- Speculative excess being cleaned out (e.g., 2x memory stocks, leveraged traders) — creator claims this supports bull market continuation. -
Risk/Reward Framework (⚖️):
- Entry: Not established by the available evidence.
- Stop: Not established by the available evidence.
- Targets: Not established by the available evidence.
- Risk/Reward: Not established by the available evidence.
- Position Size: Not established by the available evidence.
- Probability: Not established by the available evidence. -
Scenario Analysis (🔄):
| Scenario | Probability | Target | Trigger |
|---|---|---|---|
| Bull | Not established by the available evidence. | Not established by the available evidence. | The market continues to exhibit all the characteristics the creator lists (e.g., earnings beats, revenue growth, analyst upgrades, broad participation, international support, IPOs, economists' caution) and the momentum crash is confirmed as a reset. |
| Base | Not established by the available evidence. | Not established by the available evidence. | The market maintains its all-time high but lacks clear confirmation of continued broad participation or analyst upgrades. |
| Bear | Not established by the available evidence. | Not established by the available evidence. | The market fails to sustain the all-time high or any of the listed healthy characteristics reverse (e.g., earnings beats fade, leadership narrows, or speculation re-emerges). | -
Risk Factors (⚠️):
- The creator's claims are based on anecdotal evidence and not verified data; the 'healthy market' checklist is qualitative.
- The momentum crash in July could signal further downside if the reset is not complete.
- Economists' caution could be justified, and their analysis could affect market sentiment.
- Bitcoin falling and Dow drawdowns may indicate lingering speculative damage not fully cleaned out. -
Actionable Trading/Allocation Plan (🎯):
- Monitor S&P 500 earnings beat rates and revenue growth versus expectations across sectors.
- Track analyst estimate revisions for next quarter across the S&P 500.
- Observe market breadth: confirm that defensive, cyclical, growth, value, large cap, and small cap continue to rally together.
- Monitor IPO activity levels to ensure they remain supportive but not excessive.
- Watch for any reversal in the July momentum crash or renewed speculative excess.

-
Creator Horizon Category (⏱️): Long-Horizon Macro / Structural — The video discusses long-term cultural and investment shifts in European and global markets, emphasizing the adoption of stock market investing over traditional assets.
-
One-Line Thesis (💡): Global retail investors, particularly in Europe, are increasingly embracing stock market ownership via index funds and ETFs as a structural response to low bond yields and inflation, marking a multi-decade shift in wealth-building behavior.
-
Key Data Points (📊):
- 2015 Italy speech: Audience historically invested only in real estate and government bonds; after government bond yields went negative, they were forced into stocks.
- Germany: ETF savings accounts are emerging as a global phenomenon.
- Historical European wealth: Many rich families in Europe have maintained wealth since the 1700s, often in real estate and the same banks for centuries.
- Word 'bank' originates from Italy, from 'banco' (bench), used by Jewish money changers.
- Podcast, books, and newsletters are cited as making learning about investing easier than in the past. -
Technical Levels & Setups OR Macro Drivers (📌):
- Negative government bond yields in countries like Italy forced investors to seek stock market alternatives.
- Post-financial crisis and post-COVID recoveries have demonstrated the importance of robust stock markets for countries.
- Younger generations globally understand that owning stocks is a way to fight inflation and build wealth, as opposed to street protests.
- Cultural shift: In traditionally dynastic, real-estate-based economies, there is a movement toward broader stock market participation. -
Risk/Reward Framework (⚖️):
- Entry: Not established by the available evidence.
- Stop: Not established by the available evidence.
- Targets: Not established by the available evidence.
- Risk/Reward: Not established by the available evidence.
- Position Size: Not established by the available evidence.
- Probability: Not established by the available evidence. -
Scenario Analysis (🔄):
| Scenario | Probability | Target | Trigger |
|---|---|---|---|
| Bull | Not established by the available evidence. | Not established by the available evidence. | Continued adoption of index funds and ETFs across developed markets, particularly in Germany, accelerating the global shift toward stock ownership. |
| Base | Not established by the available evidence. | Not established by the available evidence. | Gradual, sustained increase in stock market participation in countries historically biased toward real estate and bonds, as exemplified by Italy's evolution over 10 years. |
| Bear | Not established by the available evidence. | Not established by the available evidence. | A return to positive, high bond yields or a severe stock market downturn that discourages new investors from maintaining equity exposure. | -
Risk Factors (⚠️):
- The evidence is anecdotal and based on personal experiences, not systematic data; verification is missing for causal claims.
- The claim that 'young people understand the importance of ownership' is unquantified and lacks demographic data.
- The comparison between European countries (e.g., Italy, Germany) and the U.S. may overlook differing regulatory, tax, and cultural factors.
- No specific catalysts or market levels are provided for timing the shift.
- Potential for a market downturn to reverse the behavioral shift is not addressed. -
Actionable Trading/Allocation Plan (🎯):
- Monitor European retail investment flows into equity ETFs and index funds, particularly in Germany and Italy, for quantitative confirmation of the trend.
- Track government bond yield changes in peripheral Europe (e.g., Italy) as a catalyst for further equity adoption.
- Cross-reference the claim of increased stock market participation with data from national central banks or survey data on household financial asset allocation.
- Evaluate the long-term implications of generational attitudes toward investing (e.g., via surveys or behavioral studies) to verify the 'young people' claim.

-
Creator Horizon Category (⏱️): Short-Term Technical — The creator focuses on immediate price levels and technical patterns for Bitcoin, Ethereum, and relative strength versus the Nasdaq, with an emphasis on short-term must-hold levels.
-
One-Line Thesis (💡): Bitcoin's immediate trend is uncertain; bulls must hold the 62.2k level to validate a 3-day inverse head and shoulders pattern, while relative weakness vs the Nasdaq persists until Bitcoin/Nasdaq breaks above weekly EMA 12 resistance.
-
Key Data Points (📊):
- Bitcoin double bottom at recent lows and broke daily lower highs, attempting to shift from daily downtrend.
- Bitcoin 3-day inverse head and shoulders pattern is in play; must hold 62.2k or risk retesting 57k low.
- Bitcoin weekly resistance double top at 67,000.
- Bitcoin/Nasdaq rejected from weekly EMA 12 resistance, indicating Bitcoin is weaker relative to the Nasdaq.
- Ethereum still in daily downtrend: lower highs, lower low, held support, but not broken resistance; weaker than Bitcoin recently.
- ETHBTC rising wedge broke bearish, indicating ETH weakening vs BTC over last week.
- Ethereum must-hold level at 1820.
- Ethereum weekly inverse head and shoulders potential; would set 3-month higher low if confirmed.
- Nasdaq V-shape bounce, daily RSI got down to 31 (missed oversold by one point), bulls in control of longer-term trends.
- Cold Card hack and MSTR selling mentioned as bearish backdrop.
- Creator will only consider sentiment shift when Bitcoin/Nasdaq is above weekly EMA 12 resistance.
- No altcoins standing out; Litecoin confirmed a bearish rising wedge.
- Next check-in trigger: break of 62.2k or bull break of resistance. -
Technical Levels & Setups OR Macro Drivers (📌):
- Bitcoin daily EMA 12 support and potential higher low formation in context of Nasdaq strength.
- Bitcoin 3-day inverse head and shoulders pattern targeting a break above the 67,000 double top.
- Bitcoin/Nasdaq relative strength control guide: weekly EMA 12 is resistance; rejection indicates Bitcoin underperforming but not necessarily dropping.
- Ethereum daily uptrend resistance line; not broken yet, indicating continued downtrend.
- ETHBTC weekly inverse head and shoulders potential for longer-term relative strength shift.
- Nasdaq daily oversold conditions and V-shape bounce; daily higher low potential with space to form.
- Altcoin sector broadly bearish; no relative strength standout. -
Risk/Reward Framework (⚖️):
- Entry: Not established by the available evidence.
- Stop: Not established by the available evidence.
- Targets: Not established by the available evidence.
- Risk/Reward: Not established by the available evidence.
- Position Size: Not established by the available evidence.
- Probability: Not established by the available evidence. -
Scenario Analysis (🔄):
| Scenario | Probability | Target | Trigger |
|---|---|---|---|
| Bull | Not established by the available evidence. | 67,000 (weekly resistance double top) and then monthly bear flag with no follow-through attempt. | Bitcoin holds 62.2k and breaks above resistance, confirming 3-day inverse head and shoulders; ideally Bitcoin/Nasdaq breaks above weekly EMA 12 and ETHBTC confirms weekly inverse head and shoulders. |
| Base | Not established by the available evidence. | Bitcoin stays above 62.2k and below resistance, forming daily higher low as Nasdaq pulls back. | Bitcoin holds 62.2k while Nasdaq continues higher; Bitcoin consolidates without breaking resistance. |
| Bear | Not established by the available evidence. | 57,000 (recent low). | Bitcoin breaks below 62.2k; increases probability of retesting the 57,000 low. | -
Risk Factors (⚠️):
- Bitcoin may not hold 62.2k, leading to a retest of 57,000.
- Bitcoin/Nasdaq remains below weekly EMA 12, indicating persistent underperformance vs equities.
- Ethereum may not break daily resistance, continuing downtrend.
- ETHBTC bearish wedge suggests continued ETH weakness vs BTC.
- Macro sentiment could shift if Nasdaq pulls back; Bitcoin's reaction is unknown.
- Negative news events (e.g., Cold Card hack, MSTR selling) could weigh on sentiment.
- Lack of altcoin participation: no altcoin stands out, suggesting overall crypto weakness. -
Actionable Trading/Allocation Plan (🎯):
- Monitor Bitcoin's price action around the 62.2k level; a break below increases risk of retesting 57k.
- Watch for a break above Bitcoin's resistance (67,000) to confirm the inverse head and shoulders pattern.
- Track Bitcoin/Nasdaq ratio relative to weekly EMA 12; a break above would signal potential sentiment shift.
- Monitor Ethereum's daily uptrend resistance line; a break would signal possible trend reversal.
- Watch ETHBTC for confirmation of weekly inverse head and shoulders or further downside wedge continuation.
- Review Nasdaq daily RSI and price action for potential pullback; assess Bitcoin's reaction to that pullback.
- Re-evaluate only when Bitcoin breaks 62.2k or breaks resistance, as stated by the creator.
-
Creator Horizon Category (⏱️): Short-Term Technical — The video is a live pre-market technical analysis session for futures and options traders, focused on PLTR earnings gap up.
-
One-Line Thesis (💡): Trade Brigade presents a live pre-market technical analysis session, emphasizing PLTR's earnings gap up as a key trading opportunity for the day.
-
Key Data Points (📊):
- PLTR earnings gap up — the creator highlights this as the central market event for the session.
- Live at 8:00 AM EST every trading day — the channel's regular pre-market analysis schedule.
- Free Discord available — offered as a community resource for traders. -
Technical Levels & Setups OR Macro Drivers (📌):
- PLTR earnings gap up — identified as the primary catalyst for the session's trading focus.
- Pre-market technical analysis — the creator's stated methodology for futures and options traders. -
Risk/Reward Framework (⚖️):
- Entry: Not established by the available evidence.
- Stop: Not established by the available evidence.
- Targets: Not established by the available evidence.
- Risk/Reward: Not established by the available evidence.
- Position Size: Not established by the available evidence.
- Probability: Not established by the available evidence. -
Scenario Analysis (🔄):
| Scenario | Probability | Target | Trigger |
|---|---|---|---|
| Bull | Not established by the available evidence. | Not established by the available evidence. | Confirmation of the gap up holding or further upside momentum in PLTR during pre-market trading. |
| Base | Not established by the available evidence. | Not established by the available evidence. | PLTR price consolidating within the gap range without clear directional move. |
| Bear | Not established by the available evidence. | Not established by the available evidence. | Failure of the gap up to hold, leading to a reversal or gap fill. | -
Risk Factors (⚠️):
- Gap up may fail to sustain, leading to a gap fill or reversal.
- Pre-market technical analysis may not account for overnight news or economic data releases.
- The creator's analysis is based on technicals but may not incorporate fundamental shifts from earnings. -
Actionable Trading/Allocation Plan (🎯):
- Monitor PLTR price action around the gap up level during the pre-market session.
- Check the creator's live squawk or Discord for real-time updates and analysis.
- Review PLTR's earnings report and guidance to understand the fundamental context of the gap.

-
Creator Horizon Category (⏱️): Long-Horizon Macro / Structural — The creator discusses a persistent behavioral bias in investment process orientation, not a specific market or trade.
-
One-Line Thesis (💡): The creator argues that investment teams systematically examine losses but rarely analyze wins, which undermines their claimed process orientation and leads to flawed capital allocation.
-
Key Data Points (📊):
- The creator observed meetings asking 'why did we lose?' but no equivalent 'why did you win?' meetings — quoted from the video.
- Real estate example: a low appraisal triggers 'all hands on deck' while a high appraisal only gets 'yay' — highlighting asymmetric attention to negative vs. positive forecast errors. -
Technical Levels & Setups OR Macro Drivers (📌):
- Behavioral asymmetry in review: losses are examined thoroughly while wins are not, skewing the feedback loop.
- The 'smart makes it worse' effect: intelligent investors are better at dressing outcome-oriented behavior in process language, masking true process failures. -
Risk/Reward Framework (⚖️):
- Entry: Not established by the available evidence.
- Stop: Not established by the available evidence.
- Targets: Not established by the available evidence.
- Risk/Reward: Not established by the available evidence.
- Position Size: Not established by the available evidence.
- Probability: Not established by the available evidence. -
Scenario Analysis (🔄):
| Scenario | Probability | Target | Trigger |
|---|---|---|---|
| Bull | Not established by the available evidence. | Not established by the available evidence. | Investment teams adopt a dual-sided review process that examines both high and low appraisals or equivalent positive and negative forecast errors, as the creator suggests is necessary. |
| Base | Not established by the available evidence. | Not established by the available evidence. | Teams continue to focus only on losses, maintaining an outcome-oriented approach disguised by process language. |
| Bear | Not established by the available evidence. | Not established by the available evidence. | The hidden examination of winning outcomes reveals additional model errors, leading to a need for reallocation or reevaluation of capital decisions. | -
Risk Factors (⚠️):
- The creator's claims are based on anecdotal observations and may not represent the broader investor population.
- The evidence does not specify any concrete market conditions or asset classes affected, limiting direct applicability.
- The described behavioral bias could be mitigated by existing practices not mentioned in the video, so the extent of the problem is uncertain. -
Actionable Trading/Allocation Plan (🎯):
- Monitor whether investment teams schedule reviews of both winning and losing positions, as the creator recommends.
- Verify the real estate appraisal example by checking if any published research supports the claim that high appraisals are treated less seriously than low ones.
- Assess one's own investment process review habits to see if positive outcomes are examined as rigorously as negative ones.
-
Creator Horizon Category (⏱️): Short-Term Technical — The episode title and description focus on current market events including earnings, a 'SemiBlow Up', and comparisons to the dotcom era, indicating a near-term analytical window.
-
One-Line Thesis (💡): Josh Brown and Michael Batnick discuss current market events including earnings, a semiconductor 'blow up', dotcom comparisons, and Robinhood, but the evidence does not include specific claims or a unified thesis.
-
Key Data Points (📊):
- Earnings coverage is mentioned in the episode description's agenda.
- SemiBlow Up is listed as a topic, suggesting discussion of a semiconductor-related market event.
- Dotcom Comparisons are listed as a topic, indicating discussion of current market valuations versus the dotcom bubble.
- Leopold is listed as a topic, likely referring to a specific entity or person discussed in the episode.
- Robinhood is listed as a topic, indicating coverage of the brokerage firm.
- Sponsored by Janus Henderson Investors.
- The hosts are employees of Ritholtz Wealth Management and may maintain positions in securities discussed. -
Technical Levels & Setups OR Macro Drivers (📌):
- Earnings season is a market driver discussed in the episode.
- A semiconductor market 'blow up' is discussed, which could be a driver of volatility.
- Comparisons to the dotcom era are discussed, which may frame valuation concerns. -
Risk/Reward Framework (⚖️):
- Entry: Not established by the available evidence.
- Stop: Not established by the available evidence.
- Targets: Not established by the available evidence.
- Risk/Reward: Not established by the available evidence.
- Position Size: Not established by the available evidence.
- Probability: Not established by the available evidence. -
Scenario Analysis (🔄):
| Scenario | Probability | Target | Trigger |
|---|---|---|---|
| Bull | Not established by the available evidence. | Not established by the available evidence. | If earnings results and forward guidance are strong, the market may continue higher; however, specific evidence from the episode is unavailable. |
| Base | Not established by the available evidence. | Not established by the available evidence. | The market could consolidate following earnings and the 'SemiBlow Up' event; no specific evidence is available. |
| Bear | Not established by the available evidence. | Not established by the available evidence. | If the 'SemiBlow Up' indicates broader semiconductor weakness or if dotcom comparisons signal valuation risk, the market could decline; no specific evidence is available. | -
Risk Factors (⚠️):
- The evidence is metadata-only; the actual content of the episode is not available for verification.
- The sponsored nature of the episode may introduce bias in the hosts' commentary.
- Specific securities, levels, and positions are not disclosed in the evidence. -
Actionable Trading/Allocation Plan (🎯):
- Verify the episode content by watching the video at the source URL to extract specific claims and data.
- Review the episode description for any timestamps or linked materials that may provide additional data.
- Cross-check any specific securities discussed (e.g., Robinhood, semiconductor companies) against official filings or market data.

-
Creator Horizon Category (⏱️): Other — The video presents a live trading stream focused on short-term price action and earnings-driven moves, but also references long-term investing, making the horizon mixed and not strictly short-term-technical.
-
One-Line Thesis (💡): The creator claims that stocks are climbing out of a consolidation box into all-time highs, driven by strong earnings and a weaker dollar, despite continued selling in Korea.
-
Key Data Points (📊):
- Stocks continue their climb out of the box into all time highs — claim from description
- Korea still selling off — claim from description
- Market more concerned with strong earnings and weaker dollar to drive the moves — claim from description
- Trading on 3 platforms: Etrade pro, ThinkOrSwim, Fidelity — claim from description -
Technical Levels & Setups OR Macro Drivers (📌):
- Strong earnings as a market driver — claim from description
- Weaker dollar as a market driver — claim from description
- Breakout out of a box into all-time highs — technical setup stated in description
- Continued selling in Korea as a potential headwind — claim from description -
Risk/Reward Framework (⚖️):
- Entry: Not established by the available evidence.
- Stop: Not established by the available evidence.
- Targets: Not established by the available evidence.
- Risk/Reward: Not established by the available evidence.
- Position Size: Not established by the available evidence.
- Probability: Not established by the available evidence. -
Scenario Analysis (🔄):
| Scenario | Probability | Target | Trigger |
|---|---|---|---|
| Bull | Not established by the available evidence. | Not established by the available evidence. | Strong earnings and weaker dollar continue to drive stocks to new all-time highs, as stated in the description. |
| Bear | Not established by the available evidence. | Not established by the available evidence. | Selling in Korea intensifies or spills over, undermining the current market advance, as implied by the description. | -
Risk Factors (⚠️):
- The claims are from a live stream description and the video itself is not available for analysis; actual trade levels, positions, and risk parameters are not provided.
- The market's reliance on 'strong earnings' and a 'weaker dollar' is a qualitative claim without specific data or verification.
- The video is explicitly educational and warns that copying trades is risky, implying high uncertainty in any specific trading actions. -
Actionable Trading/Allocation Plan (🎯):
- Verify the current market status: check major indices for all-time highs and volume on a breakout, as stated by the creator.
- Monitor the U.S. Dollar Index and earnings season headlines to assess the claimed drivers of the advance.
- Track Korean equity indices (e.g., KOSPI) to see if the 'continued selling' persists and whether it correlates with U.S. market moves.
- Note the creator's stated platforms (E*TRADE, ThinkOrSwim, Fidelity) but do not attempt to replicate trades without additional evidence.

-
Creator Horizon Category (⏱️): Long-Horizon Macro / Structural — The discussion centers on a multi-year structural shift in Apple's platform power and app interoperability, with no short-term technical or macro catalyst mentioned.
-
One-Line Thesis (💡): The creator claims that Apple's unique ability to compel thousands of app developers to integrate with 'Aentic Siri' could make it the only company able to enable cross-app AI-driven actions, without needing to spend money, because developers will comply to retain Apple's high-value users.
-
Key Data Points (📊):
- 5,000 other companies — Apple can convince them that their apps must be interoperable with Aentic Siri.
- No other company has the power to go to Delta, Expedia, JP Morgan, and Live Nation — Apple's unique leverage.
- Apple can use App Store terms of service to require five technological switches to be enabled for Aentic Siri.
- No spending by Apple — the creator asserts Apple is not the spender; developers bear the cost.
- 50% of a business's customer interactions through an app — hypothetical example illustrating why businesses comply.
- Apple users as highest-paying customers — reason developers will follow Apple's demands.
- Potential timeline of 'three years from now' — mentioned as an uncertain timeframe for Aentic Siri's cross-app functionality. -
Technical Levels & Setups OR Macro Drivers (📌):
- Apple's App Store terms of service can mandate app interoperability with Aentic Siri.
- Apple's installed base of high-spending users gives it leverage over major companies like Delta, Expedia, JP Morgan, and Live Nation.
- The creator suggests that Apple can enable cross-app operations such as moving money and booking Broadway tickets via Siri. -
Risk/Reward Framework (⚖️):
- Entry: Not established by the available evidence.
- Stop: Not established by the available evidence.
- Targets: Not established by the available evidence.
- Risk/Reward: Not established by the available evidence.
- Position Size: Not established by the available evidence.
- Probability: Not established by the available evidence. -
Scenario Analysis (🔄):
| Scenario | Probability | Target | Trigger |
|---|---|---|---|
| Bull | Not established by the available evidence. | Not established by the available evidence. | Apple successfully mandates the five technological switches for Aentic Siri via App Store terms, and major partners such as Delta, Expedia, JP Morgan, and Live Nation comply. |
| Base | Not established by the available evidence. | Not established by the available evidence. | Apple negotiates or gradually introduces interoperability with select high-value apps, but without fully mandating all five switches within three years. |
| Bear | Not established by the available evidence. | Not established by the available evidence. | Apple fails to enforce interoperability, or major partners resist due to cost or antitrust concerns, preventing the Aentic Siri cross-app vision. | -
Risk Factors (⚠️):
- The evidence is a transcript of opinions; no verification of actual Apple plans, developer agreements, or legal power.
- The claim that Apple can force developers via App Store terms lacks legal or regulatory context; antitrust and developer relations could be obstacles.
- The statement 'they're not the spender' may be inaccurate; implementing interoperability could require Apple to invest in infrastructure or incentives.
- The hypothetical '50% of interactions' figure is not sourced or verified.
- Timeframe of 'three years' is speculative ('I don't know if this is three years from now'). -
Actionable Trading/Allocation Plan (🎯):
- Monitor Apple's official announcements and App Store policy changes for any mention of 'Aentic Siri' or interoperability requirements.
- Track developer communications and public statements from key partners (Delta, Expedia, JP Morgan, Live Nation) regarding Aentic Siri integration.
- Review Apple's regulatory filings and antitrust proceedings for any constraints on App Store terms that could affect forcing interoperability.
- Verify whether 'Aentic Siri' is a real product or a hypothetical concept in the video; the transcript does not confirm its existence.

-
Creator Horizon Category (⏱️): Long-Horizon Macro — The discussion centers on multi-year client goal planning and long-term optimistic positioning relative to market performance over 3, 5, and 10 years.
-
One-Line Thesis (💡): The creator argues that being labeled a 'permabull' is misleading because advisors do sell and rebalance client portfolios when goals are overfunded, making the stance about goal-based planning rather than market forecasting.
-
Key Data Points (📊):
- 3 years, 5 years, 10 years — the client investment horizons referenced in the advisor conversation
- 90/10 portfolio, 80/20 portfolio — existing client allocation examples that may be scaled back
- 70/30, 75/25, 60/40 — suggested more conservative target allocations in the overfunded scenario
- $7 million vs. $10.5 million — an example of a client's expected vs. actual portfolio value due to strong market performance
- 30 years — the creator's stated period of being long-term optimistic -
Technical Levels & Setups OR Macro Drivers (📌):
- Market outperformance versus expectations has made some clients 'overfunded' relative to original goals.
- Advisors are having conversations about scaling back equity exposure based on goal completion and time horizon, not on market timing. -
Risk/Reward Framework (⚖️):
- Entry: Not established by the available evidence.
- Stop: Not established by the available evidence.
- Targets: Not established by the available evidence.
- Risk/Reward: Not established by the available evidence.
- Position Size: Not established by the available evidence.
- Probability: Not established by the available evidence. -
Scenario Analysis (🔄):
| Scenario | Probability | Target | Trigger |
|---|---|---|---|
| Bull | Not established by the available evidence. | Not established by the available evidence. | The creator's long-term optimism is based on 30 years of experience; a bullish scenario would continue if the market keeps outperforming, but no specific trigger is provided. |
| Base | Not established by the available evidence. | Not established by the available evidence. | Advisors continue to rebalance and sell for living expenses or goal funding, regardless of short-term market views. |
| Bear | Not established by the available evidence. | Not established by the available evidence. | No explicit bearish trigger is stated; the creator notes that being called a permabull does not change the fact that advisors do sell. | -
Risk Factors (⚠️):
- The creator's discussion is qualitative and lacks specific bearish triggers or market forecasts.
- No tickers, valuation levels, or probability estimates are provided to verify the claim that clients are overfunded.
- The example of $7 million vs. $10.5 million is illustrative, not a market-wide statistic. -
Actionable Trading/Allocation Plan (🎯):
- Monitor whether the creator or show provides any quantitative criteria (e.g., valuation levels, client goal funding ratios) for when advisors scale back equity exposure.
- Inspect the full video for any additional context on specific market conditions that would warrant a bearish shift, as the transcript does not include such triggers.
- For verification, compare the creator's example of client overfunding against broader advisory industry data on rebalancing behavior, if available.
-
Creator Horizon Category (⏱️): Short-Term Technical — The evidence indicates a live pre-market technical analysis session for futures and options traders, focusing on immediate market gap action.
-
One-Line Thesis (💡): Trade Brigade's pre-market live session notes that the overall market is gapping up while memory stocks are gapping down, signaling potential divergence and short-term trading opportunities.
-
Key Data Points (📊):
- Market is gapping up - from the video title
- Memory stocks are gapping down - from the video title
- Live session at 8:00 AM EST every trading day - from description -
Technical Levels & Setups OR Macro Drivers (📌):
- Market gap up - suggests bullish open for broad indices
- Memory stocks gap down - suggests bearish open for specific sector(s) -
Risk/Reward Framework (⚖️):
- Entry: Not established by the available evidence.
- Stop: Not established by the available evidence.
- Targets: Not established by the available evidence.
- Risk/Reward: Not established by the available evidence.
- Position Size: Not established by the available evidence.
- Probability: Not established by the available evidence. -
Scenario Analysis (🔄):
| Scenario | Probability | Target | Trigger |
|---|---|---|---|
| Bull | Not established by the available evidence. | Not established by the available evidence. | Market gap up holds or extends during the pre-market session |
| Bear | Not established by the available evidence. | Not established by the available evidence. | Memory stocks gap down leads to broader market selling |
| Base | Not established by the available evidence. | Not established by the available evidence. | Gap up fades and memory stock gap down does not spread to the broader market | -
Risk Factors (⚠️):
- Gap direction may reverse after the live session; viewer should verify actual price action.
- No specific tickers, price levels, or catalysts are provided in the evidence; any trade decision would lack concrete data.
- The evidence does not include a detailed trade plan or risk parameters; reliance on the video alone is insufficient. -
Actionable Trading/Allocation Plan (🎯):
- Watch the full video to obtain specific tickers, price levels, and trade setups.
- Verify current market and memory stock prices to confirm the gap up and gap down mentioned.
- Check the live squawk or associated community resources for real-time updates.

-
Creator Horizon Category (⏱️): Long-Horizon Macro / Structural — The discussion focuses on persistent behavioral patterns in institutional investors' sell-side decisions, not on short-term market movements.
-
One-Line Thesis (💡): Institutional buy-side experts generate alpha on buys (about 100–120 bps better than beta), but systematically underperform on sells by about 70 bps versus random benchmark because they focus only on extreme winners or losers and receive no feedback after selling.
-
Key Data Points (📊):
- Buy-side expert investors are generally doing somewhere around 100–120 bps better than the beta — cited as evidence of alpha generation on purchases.
- Sell-side decisions are usually about 70 bps worse than the benchmark — compared with randomly freeing capital from the portfolio.
- Alex Imas is cited as the source of this research on sell-side decision underperformance.
- Sellers tend to look only at extreme winners or extreme losers when freeing capital, ignoring the whole set of holdings.
- Buy-side decisions benefit from constant feedback because positions remain on the book and are monitored daily; sell-side decisions provide no feedback after the sale, so investors are unaware of underperformance.
- The creator has coached portfolio managers in similar situations to improve sell decisions.
- The creator's book introduces this behavior early and later discusses solutions. -
Technical Levels & Setups OR Macro Drivers (📌):
- Attention-grabbing extreme positions drive sell decisions: extreme winners or extreme losers are selected when capital needs to be freed.
- Lack of post-sale tracking removes feedback loops, preventing learning and reinforcing the behavioral bias.
- The buy side's daily comparison of thesis versus actual market performance creates a feedback machine that supports better decisions.
- Institutional investors generally do not know they are losing to quitting decisions because the positions are off their books and out of sight. -
Risk/Reward Framework (⚖️):
- Entry: Not established by the available evidence.
- Stop: Not established by the available evidence.
- Targets: Not established by the available evidence.
- Risk/Reward: Not established by the available evidence.
- Position Size: Not established by the available evidence.
- Probability: Not established by the available evidence. -
Scenario Analysis (🔄):
| Scenario | Probability | Target | Trigger |
|---|---|---|---|
| Bull | Not established by the available evidence. | Not established by the available evidence. | If institutional investors adopt systematic feedback on sell decisions, they could reduce the ~70 bps underperformance relative to the benchmark. |
| Base | Not established by the available evidence. | Not established by the available evidence. | Current behavior persists: buy-side alpha of ~100–120 bps is partially offset by ~70 bps sell-side drag, leaving net outperformance but suboptimal capital allocation. |
| Bear | Not established by the available evidence. | Not established by the available evidence. | If sell-side biases intensify (e.g., under stress, attention narrowing worsens), underperformance could exceed ~70 bps, eroding more of the buy-side alpha. | -
Risk Factors (⚠️):
- The evidence presents a behavioral pattern but does not provide verifiable data sets, methodology, or time periods from Alex Imas's research.
- No verification of the exact benchmark used for the 'randomly free capital' comparison is provided.
- The claim that investors are unaware of underperformance is based on conjecture and lacks direct survey or experimental evidence in this transcript.
- Applying this behavioral insight to a specific portfolio requires additional data on sell decisions and benchmarks.
- The transcript offers no investment recommendations or tradeable asset specifics. -
Actionable Trading/Allocation Plan (🎯):
- Monitor research by Alex Imas for the underlying study on sell-side decision underperformance to verify the ~70 bps figure and methodology.
- If managing a portfolio, review sell decisions against a random selection benchmark to assess whether extreme winners/losers are overrepresented.
- Implement a post-sale tracking process to evaluate the performance of sold positions against the benchmark to gain feedback and reduce the bias.
- The creator mentions coaching portfolio managers; seek out specific techniques described later in the book for improving sell decisions.

-
Creator Horizon Category (⏱️): Short-Term Technical — The video is a live trading stream focused on real-time market movements, earnings, and economic data, indicating a short-term technical horizon.
-
One-Line Thesis (💡): The creator expects traders to return with optimism in chip stocks following the 'Leopold drama' last week, with ISM and after-hours earnings as the main catalysts for the day.
-
Key Data Points (📊):
- ISM is the main event today — Economic data focus.
- Earnings after the bell — Scheduled earnings catalysts.
- Trading platforms: Etrade pro (screen), ThinkOrSwim (long-term investing), Fidelity (long-term) — Platform disclosure. -
Technical Levels & Setups OR Macro Drivers (📌):
- Chip stocks optimism following last week's 'Leopold drama' — stated sentiment driver.
- ISM data release — main event catalyst.
- After-hours earnings — secondary catalyst. -
Risk/Reward Framework (⚖️):
- Entry: Not established by the available evidence.
- Stop: Not established by the available evidence.
- Targets: Not established by the available evidence.
- Risk/Reward: Not established by the available evidence.
- Position Size: Not established by the available evidence.
- Probability: Not established by the available evidence. -
Scenario Analysis (🔄):
| Scenario | Probability | Target | Trigger |
|---|---|---|---|
| Bull | Not established by the available evidence. | Not established by the available evidence. | ISM data comes in better than expected and chip stocks continue their optimistic momentum following the 'Leopold drama'. |
| Base | Not established by the available evidence. | Not established by the available evidence. | ISM data and after-hours earnings result in typical market reactions, with no clear directional catalyst. |
| Bear | Not established by the available evidence. | Not established by the available evidence. | ISM data disappoints or after-hours earnings reveal negative surprises, reversing the chip optimism. | -
Risk Factors (⚠️):
- Creator warns that options trading is risky and copying trades is likely to result in loss.
- No specific levels, tickers, or data values are provided in the evidence, limiting verification.
- The stream is for educational purposes only and should not be construed as financial advice.
- Creator may not answer questions while trading, so real-time details are limited. -
Actionable Trading/Allocation Plan (🎯):
- Monitor the scheduled ISM data release and after-hours earnings reports for market-moving catalysts.
- Track the performance of chip stocks to see if the 'Leopold drama' optimism persists.
- Review the night watchlist video (linked in description) for further context on setups.

-
Creator Horizon Category (⏱️): Short-Term Technical — Visser frames the current period as a post-cleanse, high-volatility environment where the next 6-7 days of price action around the recent lows and follow-through days will signal whether the market can sustain a rally.
-
One-Line Thesis (💡): The late-July hedge fund unwind, centered on a large fund's forced liquidation, likely marks a cleansing event rather than a regime change, but the market structure has shifted toward permanently higher factor volatility and structurally tighter risk appetite.
-
Key Data Points (📊):
- Goldman Sachs VIP hedge fund index down 12% relative to the S&P 500 in July, the worst monthly relative performance since 2001, surpassing even Lehman month.
- Four-day rate of change in crowded hedge fund positions (Friday through Wednesday) was the worst ever, including COVID.
- Hedge fund leverage (Q3 2025 Form PF data) reached record highs, and gross leverage increased the most on record in the first five months of the year.
- Hedge funds were still up over 10% for the year before the worst of the unwind, cushioning the impact.
- Citadel bought a portfolio of the struggling fund's positions after it sought to raise capital.
- Traders bought multiple billions of dollars of SMH puts before the unwind, and SMH saw a massive volume spike at the lows.
- E-mini futures volume from 2-4 pm into the close on Wednesday was the highest of the year.
- Momentum factor for tech was down 40% year-to-date, double the worst dot-com month; sector-neutralized momentum down 21% in a month, a record.
- 30-day realized volatility of Morgan Stanley tech momentum factor at 110 vs. prior highs near 70, implying ~6-7% daily moves for dollar-long-short market-neutral books.
- Sector-neutral factor volatility index at 38, still above the 2000-2020 range of 5-15; VIX-EQ structural divergence with VIX started around ChatGPT.
- S&P 500 finished July unchanged; 72% of S&P 500 above 50-day and 200-day, 68% above 20-day, all while tech momentum was crushed.
- NDX relative to S&P had its worst month since the dot-com bubble.
- SMH had a reverse head-and-shoulders neckline break and reclaimed it; lows must hold.
- Thematic portfolio 63-day rate of change retraced from +50% to -1.7%, aligning with prior 30-day rate of change -15% at prior bottoms.
- DRAM prices continue to rise weekly; backlog figures: Amazon $500B, Google $500B, Microsoft $700B.
- Anthropic annualized revenue pace $74B, OpenAI $75B for 2025 – combined $175B from zero two years prior.
- Zuckerberg: 'There's just nowhere near enough compute for all the demand. We are getting a large number of offers for the compute that we have.'
- AWS 2027 compute capacity is already mostly reserved, with Amazon seeing demand into 2028.
- VIX-EQ divergence: realized VIX-EQ is above VIX, indicating equity volatility structurally higher than index vol.
- Follow-through day criterion: index rises meaningfully on higher volume within days 4-10 of rally attempt; first day after panic low saw biggest volume since June and close above prior day's high. -
Technical Levels & Setups OR Macro Drivers (📌):
- The forced unwind of a large hedge fund (reported $45B positions) triggered a sector-neutral momentum crash, which may have been amplified by prime brokers marketing the portfolio and the two largest funds (Citadel, Millennium) seeing the book.
- The fund's distress was compounded by a week of Federal Reserve meeting and hyperscaler earnings, plus a rumor of a surprise rate hike from Kevin Warsh (which was reportedly Citadel's call).
- Visser believes the AI trade is not over: compute demand is 'insatiable' and supply cannot keep up, evidenced by hyperscaler capacity constraints and backlog growth from non-frontier-model customers.
- The rise of AI agents (e.g., Robinhood's AI trading agent) and tokenization will compress time and increase market volatility structurally.
- Visser's 'AI midcycle slowdown' thesis: he reduced risk in May due to stretched rate-of-change metrics, but now sees better risk/reward after the pullback in price and time.
- He is buying small positions in AI names like Micron (below 900) and AOI, with Micron position reduced to ~1/5th of May size.
- Technically, he is focused on SMH reverse head-and-shoulders (neckline retest), NDX RSI at lows, and follow-through days on the S&P, QQQ, and SMH.
- Watching hyperscaler CDS (not worried) vs. CCC option-adjusted spread divergence with high yield (worried, possible private credit stress).
- He highlights the Dodgers/Guggenheim/private credit angle as a potential source of credit stress. -
Risk/Reward Framework (⚖️):
- Entry: Not established by the available evidence.
- Stop: Not established by the available evidence.
- Targets: Micron 1,500-1,600 over the next year (from ~850).; Thematic portfolio eventually back to prior highs (1,500-1,600).; S&P to new highs (implied by bull market thesis).
- Risk/Reward: Not established by the available evidence.
- Position Size: Micron position currently about 1/5th of May size (being added incrementally).
- Probability: Not established by the available evidence. -
Scenario Analysis (🔄):
| Scenario | Probability | Target | Trigger |
|---|---|---|---|
| Bull | Not established by the available evidence. | New highs in S&P and semiconductors (SMH); AI trade resumes. | The lows from the panic hold; follow-through day confirms rally (index rises meaningfully on higher volume within days 4-10); hyperscaler capex continue to confirm demand; sentiment remains negative. |
| Base | Not established by the available evidence. | Range-bound market with persistent higher volatility; AI trade grinds higher but at slower pace. | The market consolidates above the lows; realized volatility stays elevated (30-day tech vol > 70); multiple compression continues. |
| Bear | Not established by the available evidence. | Further downside in AI/tech and broader market. | If the lows break, or if credit spreads (CCC) widen further and drag high yield; if hedge fund leverage continues to unwind or another major fund fails; if hyperscaler capex cuts are announced. | -
Risk Factors (⚠️):
- Visser's base case is that the unwinding is not fully over; there may be more forced selling from other funds.
- The high volatility regime may persist, keeping risk appetite suppressed and preventing a quick rally.
- The CCC credit spread divergence is a warning sign that credit stress could spread and trigger a credit event.
- If AI demand disappoints or hyperscaler capex is cut (rumored), the whole thesis fails.
- Regulatory risks (e.g., Clarity Act) could impact crypto but not directly AI.
- The Fed policy under Warsh is uncertain and could surprise with rate hikes.
- Visser warns that picking exact bottoms is difficult; the follow-through day signals are probabilistic, not guaranteed. -
Actionable Trading/Allocation Plan (🎯):
- Monitor the S&P 500, QQQ, and SMH for a follow-through day within the next 6-10 sessions (day 4-10 of rally attempt) on higher volume.
- Watch the lows set on the panic day; a break below would invalidate the cleansing-event thesis.
- Track sector-neutralized momentum volatility (30-day) and the Morgan Stanley tech momentum factor to see if vol declines; if it stays above ~70, expect continued high market-neutral risk.
- Verify hyperscaler earnings commentary on constraints and backlog; any announcement of capex cuts would be a major risk.
- Watch DRAM price weekly data to see if the rise continues, confirming compute demand.
- Monitor the CCC OAS vs high-yield spread; a further widening could signal credit stress.
- Monitor hedge fund liquidation news (e.g., any updates on the distressed fund's portfolio) and any further margin calls or block trades.
- For AI names, use the technical sheet criteria: price above rising 200-day moving average, and 30-day rate of change below -15% as potential entry conditions.

-
Creator Horizon Category (⏱️): Short-Term Technical — The creator's analysis focuses on near-term technical levels (e.g., SPY 742, QQQ 676) and the immediate path for the market over the coming week, with a specific mention of August probabilities.
-
One-Line Thesis (💡): The market is in a consolidation after a record rally, with the S&P 500 neutral-to-bullish above SPY 742 but the Nasdaq showing a downtrend with a potential lower-high setup, while rising long-term rates and leadership breakdowns suggest a top rather than a fresh uptrend.
-
Key Data Points (📊):
- SPY monthly: July bar is a green-bodied indecisive doji, inside bar, closed unchanged from previous monthly close; all-time high is the monthly highest high.
- SPY weekly: last week formed a green-bodied long-legged hammer, reclaimed the 10-week moving average, and closed above the all-time high anchored VWAP.
- QQQ monthly: July bar is a solid red body bar with a little lower wick, a more compelling downside bar.
- QQQ weekly: red-bodied long-legged hammer, pierced but closed above weekly 20 SMA, below declining 10-week SMA (50 SMA daily), lower low and lower high.
- Sector performance: IGV up, XLY up, XLE down, XLP up, XLC down, XLF up (financials at new all-time highs), XLI down, XLV up, XLK in downtrend but tagged top of channel.
- Interest rates: 10-year rate at 4.745, 30-year (TYX) breaking out of a long base, possible move to 6.4% on 30-year.
- Forex factory probabilities: 67% chance of a hike at the September 16th meeting.
- VIX: VIX crushed last week, but VIX EQ (constituent weighted volatility) still in an uptrend.
- Total breadth: new high/new low ratio not at new high, not oversold.
- RSP: long-legged hammers, possible daily higher low.
- Individual stocks: Microsoft, Amazon, Google, Meta showing constructive action; Apple, AMD, MU, Intel, and other high-beta AI names showing weakness.
- Trade ideas: HPE, GTLB, Snowflake, RingCentral, GM, Garmin, and others with specific breakout levels. -
Technical Levels & Setups OR Macro Drivers (📌):
- S&P 500: Neutral-to-bullish if price stays above 742; bearish if it breaks below 742.
- Rates: Rising 10-year and 30-year yields are a headwind, potentially forcing Kevin Worsh to hike, similar to 2022.
- Follow-through day: Need a 1%+ up day on SPY or 2%+ on QQQ on day 4 or beyond with increased volume to confirm a new uptrend.
- Leadership breakdown: High-beta AI names (AMD, MU, Intel, DRAM, SMH) are in downtrends, while financials and software (IGV) show strength.
- Macro data: CPI print on August 12th is key; shelter inflation moving lower may give Worsh leeway to avoid a hike. -
Risk/Reward Framework (⚖️):
- Entry: Not established by the available evidence.
- Stop: Not established by the available evidence.
- Targets: Not established by the available evidence.
- Risk/Reward: Not established by the available evidence.
- Position Size: Not established by the available evidence.
- Probability: Not established by the available evidence. -
Scenario Analysis (🔄):
| Scenario | Probability | Target | Trigger |
|---|---|---|---|
| Bull | Not established by the available evidence. | SPY 850 (Fibonacci measured move), QQQ 850 (short-term bull flag measured move) | Verify the trigger against the source evidence. |
| Base | Not established by the available evidence. | Not established by the available evidence. | Verify the trigger against the source evidence. |
| Bear | Not established by the available evidence. | SPY retest of all-time high at ~700; QQQ breaks below 676 and targets lower | SPY breaks below 742; QQQ breaks below 676; rising 30-year yields; leadership breakdown worsens; market internals deteriorate. | -
Risk Factors (⚠️):
- If SPY breaks below 742, the market may experience a violent pullback, as the creator warns.
- Rising 30-year yields (TYX) could lead to a repricing of equities, especially high-beta growth.
- Earnings events (e.g., AMD, Palantir, DataDog) could cause sharp moves that invalidate technical levels.
- The creator's analysis is based on technicals and market positioning; fundamental data (CPI) could sway the market. -
Actionable Trading/Allocation Plan (🎯):
- Monitor SPY's ability to hold above 742 to confirm bullish bias; a break below would signal bearish risk.
- Track the 10-year and 30-year yields; rising rates could pressure equities.
- Look for follow-through day signals (1%+ up day on SPY or 2%+ on QQQ on day 4+ with increased volume) to confirm new uptrend.
- Observe sector rotation: financials and software strength vs. semiconductor weakness to gauge market health.
- Prepare for volatile moves around CPI print on August 12th and NFP on August 7th.

-
Creator Horizon Category (⏱️): Short-Term Technical — Creator focuses on 4-hour and daily charts for semis and memory, expecting a 4-hour higher low and possible weekly bounce within the coming week.
-
One-Line Thesis (💡): The market is in a daily downtrend but the creator expects a 4-hour higher low in semis and memory to lead to a weekly bounce, with the S&P 500 still bullish as it holds weekly EMA 12.
-
Key Data Points (📊):
- NASDAQ futures daily RSI reached approximately 31, near daily oversold.
- SMH pulled back about 5% in 45 minutes on Friday.
- SMH bounced 13-14% before the pullback; the pullback was about half that, while DRAM (memory ETF) retraced about 10% and had a 45% retracement.
- MU resistance at 855 was rejected multiple times; MU was a lead bear on Friday.
- SNDK bounced 40% in two days then pulled back 15% in a day.
- XLF and XLV hit all-time highs, with XLF having its highest monthly close ever.
- Gold and silver are in a falling wedge; the creator took a nibble on silver (half the desired position).
- Oil: weekly higher low is most likely scenario after a large drop; a 12-hour bull break occurred on Friday.
- Kospi: daily higher low likely; has space to drop 20% before reaching that low, compared to 10-13% on prior bounces. -
Technical Levels & Setups OR Macro Drivers (📌):
- Weekly stairstep drop in NASDAQ with lower highs for six consecutive weeks; monthly higher low is the bull target.
- For semis and memory: watch for 4-hour higher lows; if retracement is 40% it's a bull flag continuation, if 50%+ it's a lower high.
- For MAGS and IGV: watching 3-day equilibrium breaks; a bull break means monthly higher low and possible all-time highs in MAGS, a bear break means monthly lower high and more caution.
- Healthcare and financials maintaining daily uptrends is key; if they confirm daily downtrends while semis are weak, that's a red flag.
- Gold and silver: daily downtrend still in play; need a bull break for validation; the creator is willing to buy higher if the thesis is confirmed.
- Oil: weekly lower high set after a large drop; weekly higher low is the most likely next step. -
Risk/Reward Framework (⚖️):
- Entry: Not established by the available evidence.
- Stop: Not established by the available evidence.
- Targets: Not established by the available evidence.
- Risk/Reward: Not established by the available evidence.
- Position Size: Not established by the available evidence.
- Probability: Not established by the available evidence. -
Scenario Analysis (🔄):
| Scenario | Probability | Target | Trigger |
|---|---|---|---|
| Bull | Not established by the available evidence. | Not established by the available evidence. | Confirmation of 4-hour higher lows in semis and memory, leading to a weekly bounce and a break of resistance; MAGS/IGV break their equilibriums upward. |
| Base | Not established by the available evidence. | Not established by the available evidence. | Range-bound behavior with previous resistance acting as support, but no clear break in either direction; volatility persists. |
| Bear | Not established by the available evidence. | Not established by the available evidence. | Break of support, confirming a daily lower high and leading to new lows; MAGS/IGV break equilibriums downward; healthcare/financials lose daily uptrends. | -
Risk Factors (⚠️):
- The creator's thesis was invalidated earlier (daily higher lows in memory did not hold), so another invalidation is possible.
- The 'fund blow-up' liquidation could be followed by further selling if other leveraged positions exist.
- The weekly bounce could fail, leading to a daily lower high and lower lows.
- Geopolitical headlines (potential bombing of energy infrastructure in Iran) could cause sudden volatility.
- The dollar's megaphone pattern is alive; if the high breaks, it would invalidate the pattern and potentially shift market dynamics.
- The creator notes that missing the bottom (as they did on Wednesday night) limits potential gains, but they are prioritizing protection over large gains. -
Actionable Trading/Allocation Plan (🎯):
- Monitor semis and memory on the 4-hour timeframe for higher lows; a 4-hour higher low is the most likely scenario.
- Watch for confirmation of a 4-hour uptrend in SMH, DRAM, MU, and SNDK; a break of support would set a daily lower high.
- Observe MAGS and IGV for breaks of their 3-day equilibriums; direction will have significant implications for August.
- Track healthcare (XLV) and financials (XLF) daily uptrends; if they confirm downtrends, note potential red flags.
- For gold and silver, watch for a bull break out of the falling wedge; the creator is willing to add at higher prices if the thesis is validated.
- For oil, watch for a weekly higher low; a 12-hour bull break is already in play.
- Monitor the dollar's megaphone pattern; a break of the high would invalidate it.
- Keep an eye on Kospi for a daily higher low; the creator expects a possible lower open but sees space for a higher low.
-
Creator Horizon Category (⏱️): Long-Horizon Macro / Structural — The creator frames the analysis around a multi-year political and social dynamic leading into the 2028 election cycle, not a short-term market trade.
-
One-Line Thesis (💡): The creator argues that heavily subsidized cheap grocery stores in urban centers will become a popular socialist success story that fuels DSA political momentum into 2028, with the financial losses being negligible relative to city budgets.
-
Key Data Points (📊):
- Each cheap grocery store loses $10 million per year — cited as a per-store annual loss assumption.
- 10 or 20 of these grocery stores would total $200 million per year in losses — arithmetic based on the $10 million per-store figure.
- 24 months — time frame for the grocery store phenomenon to play out into the 2028 election cycle.
- 2028 election cycle — the horizon for the predicted DSA political impact. -
Technical Levels & Setups OR Macro Drivers (📌):
- Cheap grocery stores attract customers from far away (e.g., Long Island, Jersey) due to discount pricing, creating a social network effect.
- The creator expects no ID checks at these grocery stores, paralleling voting ID debates, which would allow broader access and increase demand.
- As demand rises, more stores open, amplifying losses but also spreading the political message.
- The losses are framed as a cheap marketing cost for the DSA platform relative to municipal budgets. -
Risk/Reward Framework (⚖️):
- Entry: Not established by the available evidence.
- Stop: Not established by the available evidence.
- Targets: Not established by the available evidence.
- Risk/Reward: Not established by the available evidence.
- Position Size: Not established by the available evidence.
- Probability: Not established by the available evidence. -
Scenario Analysis (🔄):
| Scenario | Probability | Target | Trigger |
|---|---|---|---|
| Bull | Not established by the available evidence. | Not established by the available evidence. | The grocery stores become wildly popular, draw customers from surrounding areas, and expand to 10-20 locations, making the $200 million annual loss a successful political investment. |
| Base | Not established by the available evidence. | Not established by the available evidence. | The grocery stores operate with losses but do not achieve the scale or political impact described; the social movement grows modestly without major electoral effects. |
| Bear | Not established by the available evidence. | Not established by the available evidence. | The grocery stores fail to maintain popularity or face political or operational backlash, limiting their influence on the 2028 election cycle. | -
Risk Factors (⚠️):
- The creator's projections rely on unverified assumptions (e.g., per-store losses, no ID checks, and political impact).
- Actual grocery store economics may differ from the $10 million loss estimate.
- The social/political response to such stores is uncertain and not established by the evidence.
- The claim about 'ID checks' is a hypothetical projection, not a current policy.
- The creator's characterization of 'socialism' and DSA impact is an interpretation, not a measurable outcome. -
Actionable Trading/Allocation Plan (🎯):
- Monitor announcements and operational data from urban cheap grocery store initiatives to verify per-store loss figures.
- Track city budget allocations to assess the actual fiscal impact relative to municipal budgets.
- Observe political commentary and polling related to DSA or socialist platforms leading into the 2028 election cycle.
- Verify whether such grocery stores implement ID checks or other access restrictions.
- Follow the expansion of grocery store locations and any evidence of demand spillover from surrounding areas.

-
Creator Horizon Category (⏱️): Short-Term Technical — The creator frames the market move as a momentum-driven correction with brutal leveraged unwinds, implying a short-term technical event rather than a structural shift.
-
One-Line Thesis (💡): The creator argues that the current market correction is momentum-driven rather than fundamental, amplified by leverage, and that the AI capex will eventually deliver returns, making the selloff a temporary volatility event.
-
Key Data Points (📊):
- Roughly 10x runup in memory chip stocks over the past year — context for the momentum run.
- Approximately 10% pullback in the NASDAQ from its peak — magnitude of the broad index correction.
- South Korea mentioned as a region affected — likely semiconductor exposure, but no specific figures given.
- Leopold's fund mentioned as an example of leveraged momentum trade — no specific numbers provided. -
Technical Levels & Setups OR Macro Drivers (📌):
- Momentum factor unwinding after a prolonged AI-related rally — the creator identifies this as the primary driver of the correction.
- Leverage in the momentum trade amplifies the downside — the creator cites Leopold's fund and South Korea as examples. -
Risk/Reward Framework (⚖️):
- Entry: Not established by the available evidence.
- Stop: Not established by the available evidence.
- Targets: Not established by the available evidence.
- Risk/Reward: Not established by the available evidence.
- Position Size: Not established by the available evidence.
- Probability: Not established by the available evidence. -
Scenario Analysis (🔄):
| Scenario | Probability | Target | Trigger |
|---|---|---|---|
| Bull | Not established by the available evidence. | Not established by the available evidence. | The creator states 'there will be a return on all this capex,' implying the AI capex delivers ROI and the market resumes its uptrend. |
| Base | Not established by the available evidence. | Not established by the available evidence. | The correction is temporary and fundamentals remain intact, with volatility amplified by leverage subsiding. |
| Bear | Not established by the available evidence. | Not established by the available evidence. | The correction reveals that AI capex does not yield returns and the boom is a bubble — the creator acknowledges this as the alternative question. | -
Risk Factors (⚠️):
- The creator's thesis could be invalidated if AI capex fails to generate returns, turning the momentum correction into a fundamental repricing.
- Leverage in the momentum trade could lead to further forced selling beyond what is currently visible. -
Actionable Trading/Allocation Plan (🎯):
- Monitor whether AI-related capital expenditures begin to show measurable ROI over the coming quarters.
- Track the magnitude and duration of the NASDAQ drawdown relative to the momentum trade's decline to see if the correction stays contained.
- Watch for further deleveraging events in momentum-heavy regions like South Korea and leveraged funds, as cited by the creator.

-
Creator Horizon Category (⏱️): Other — The transcript is a short, conversational segment debating which single stock top investors would buy for a five-year holding period, so the time frame is multi-year but the content is not a formal market outlook.
-
One-Line Thesis (💡): The creator claims that, if forced to buy one stock and hold it for five years, the greatest investors (specifically Warren Buffett and Stanley Druckenmiller) would choose Apple because it is the safest way to play AI without the risk of negative free cash flow and massive capex.
-
Key Data Points (📊):
- Five-year holding period — the hypothetical horizon for the single-stock choice.
- Warren Buffett and Stanley Druckenmiller — named as two of the three greatest investors; the third is not identified, with the creator saying "there is no three."
- Peter Lynch and Jim Simons — mentioned as alternative top investors, but not selected by the creator for the Apple answer.
- Jim Simons' holding period is 30 seconds — noted as contradictory to a five-year hold.
- Warren Buffett is no longer running Berkshire Hathaway — noted as a caveat, and he was liquidating Apple in his final years.
- Apple's product relevance in five years — the creator asserts high confidence: "I'm pretty sure that that'll be true for Apple." -
Technical Levels & Setups OR Macro Drivers (📌):
- AI exposure without the risk of negative free cash flow — Apple is positioned as a safer AI play relative to companies with heavy capex.
- Huge capex figures (”15079,000 billion” — likely a misstatement) — used to contrast Apple's financial profile.
- Apple's product relevance over a five-year horizon — the key qualitative driver for the pick. -
Risk/Reward Framework (⚖️):
- Entry: Not established by the available evidence.
- Stop: Not established by the available evidence.
- Targets: Not established by the available evidence.
- Risk/Reward: Not established by the available evidence.
- Position Size: Not established by the available evidence.
- Probability: Not established by the available evidence. -
Scenario Analysis (🔄):
| Scenario | Probability | Target | Trigger |
|---|---|---|---|
| Bull | Not established by the available evidence. | Not established by the available evidence. | Apple's products remain relevant over five years, and its AI positioning proves safe without negative free cash flow. |
| Bear | Not established by the available evidence. | Not established by the available evidence. | Apple's product relevance declines over five years, or its AI strategy leads to negative free cash flow or excessive capex. |
| Base | Not established by the available evidence. | Not established by the available evidence. | Apple maintains its current product trajectory and financial profile, but with no explicit performance target given. | -
Risk Factors (⚠️):
- The creator notes that Warren Buffett was actually liquidating Apple in his final years, which contradicts the claim that he would buy it now.
- Jim Simons' extremely short holding period makes him an ill-suited comparison for a five-year hold, as the transcript itself notes.
- The exact capex figure is garbled in the transcript ("15079,000 billion"), making the quantitative claim unverifiable as stated.
- The transcript is conversational and not a formal investment thesis; it lacks any price levels, valuation, or risk parameters. -
Actionable Trading/Allocation Plan (🎯):
- Verify Apple's current free cash flow and capital expenditure trends to assess the claim of safety relative to AI peers.
- Monitor Berkshire Hathaway's historical and current Apple positions to reconcile the creator's claim with Buffett's actual behavior.
- Track Apple's product roadmap and AI initiatives over a five-year horizon to evaluate the relevance assumption.
-
Creator Horizon Category (⏱️): Other — The discussion spans immediate market volatility, long-term fiscal and AI structural trends, and philosophical speculation, but no specific investment horizon is stated.
-
One-Line Thesis (💡): Creator claims that the recent chip selloff is a momentum-driven correction amplified by leverage, not a fundamental breakdown, and that AI capex remains sound, while open-source models and fiscal deterioration introduce long-term uncertainty.
-
Key Data Points (📊):
- Leopold Aschenbrenner's fund grew from $225M (2024) to $20B, peaked at $45B, and was forced to liquidate after margin call — reported figures.
- Philadelphia Semiconductor Index down >20% over last month; bounced +7% on taping day.
- Samsung down 38% over last month; SK Hynix down 14% since IPO 3 weeks ago.
- KOSPI down >40% in last 40 days.
- 1.2 million leveraged accounts in South Korea hit with margin calls; ~350,000 fully liquidated (data two weeks old).
- Micron up 850% (mostly past year), Nvidia up 875% (5yr), Broadcom up 663% (5yr).
- 30-year Treasury yield crossed 5.2% — highest in 20 years.
- US federal debt at $40T; deficit ~$2T annually.
- Polymarket: 53% chance of rate hike in September (not a cut).
- China's CXMT surged ~500% on debut with market cap over $450B.
- ASML stock down 17% on report of Chinese lithography competition.
- AI duopoly: Anthropic and OpenAI; Anthropic expected to exceed $100B ARR by year-end (growing 10x year-over-year).
- Anthropic reportedly has 80%+ gross margins.
- Polymarket: 19% chance US enacts AI safety bill this year.
- Polymarket: OpenAI IPO chances for 2026 dropped from 75% to 20%.
- Anthropic paid $1.5B in largest copyright case for 7M books.
- China's nuclear fusion magnet installed; 582-ton superconducting magnet.
- California >50% of energy from solar; New Mexico study: solar+batteries replaced most nat gas.
- Elon Musk/Tesla CFO: plan to increase solar production by an order of magnitude to >100 GW/yr.
- OpenAI unreleased model hacked Hugging Face and three other platforms.
- Perplexity to launch local models next week (per creator rumor). -
Technical Levels & Setups OR Macro Drivers (📌):
- Chip correction driven by momentum, not fundamentals — creator's view.
- High leverage (3-4x) amplifies moves; margin calls force one-way selling.
- Rising treasury yields (5.2%) create competition for equity returns, pressuring high-multiple AI stocks.
- Fiscal spending ($2T deficit) and inflation persist, pressuring rates.
- China's open-source AI models and chip/lithography advances threaten US AI dominance.
- AI capex boom (hyperscalers investing all free cash flow) seen as real but volatile.
- Ongoing Iran war pressures energy prices.
- Potential AI efficiency gains (50-75% token reduction) could disrupt token demand.
- Book shredding for training data highlights copyright/legal risk for AI model training. -
Risk/Reward Framework (⚖️):
- Entry: Not established by the available evidence.
- Stop: Not established by the available evidence.
- Targets: Not established by the available evidence.
- Risk/Reward: Not established by the available evidence.
- Position Size: Not established by the available evidence.
- Probability: Not established by the available evidence. -
Scenario Analysis (🔄):
| Scenario | Probability | Target | Trigger |
|---|---|---|---|
| Bull | Not established by the available evidence. | Not established by the available evidence. | AI capex delivers productivity gains (as creator expects), energy abundance (solar/fusion) lowers costs, and open-source challenges do not erode frontier model margins. |
| Base | Not established by the available evidence. | Not established by the available evidence. | Chip selloff stabilizes (recent +7% bounce) and annuity demand for AI continues, but leverage and volatility remain. |
| Bear | Not established by the available evidence. | Not established by the available evidence. | US fiscal/monetary conditions worsen (treasury yields spike, inflation persists), China's open-source models commoditize AI, or AI safety incidents trigger regulation that slows progress. | -
Risk Factors (⚠️):
- Creator assumes correction is momentum-driven; if fundamentals deteriorate (e.g., AI capex ROI fails), selloff could deepen.
- Leverage amplification could recur in other crowded trades.
- AI safety incident (unreleased model hacking) could escalate regulation and slow deployment.
- US fiscal trajectory (debt ceiling removal, $2T deficit) may lead to persistent inflation and higher rates, hurting equity multiples.
- China's chip/lithography advances (ASML competition, CXMT IPO) could erode US semiconductor dominance.
- Book copyright litigation could disrupt training data sourcing for AI companies.
- Energy transition claims (solar, fusion) are speculative and unproven at scale. -
Actionable Trading/Allocation Plan (🎯):
- Monitor Philadelphia Semiconductor Index levels for further decline or stabilization (creator notes >20% drawdown and +7% bounce).
- Track South Korean leveraged account liquidation data (1.2M accounts, ~350K liquidated) to gauge systemic stress.
- Follow 30-year Treasury yield (5.2%) and Fed policy signals (Polymarket 53% hike chance) for impact on equity valuations.
- Verify OpenAI/Anthropic revenue reports (Anthropic >$100B ARR, OpenAI reacceleration) versus open-source cost advantages.
- Monitor AI safety incidents and regulation (Polymarket 19% for AI safety bill) and their impact on frontier lab operations.
- Assess energy supply trends (California solar >50%, Tesla's solar plan) and their effect on AI capex costs.

-
Creator Horizon Category (⏱️): Other — The evidence is a general trading principle about predefining invalidation levels, not tied to a specific timeframe or asset.
-
One-Line Thesis (💡): The creator argues that traders and investors must predefine a specific price level that invalidates their thesis, so they can objectively stop out when wrong rather than enduring an arbitrary drawdown.
-
Key Data Points (📊):
- 10% drawdown - mentioned as an example of an ambiguous threshold for admitting being wrong on a long-term thesis
- 40% drawdown - mentioned as another example of an ambiguous threshold for admitting being wrong on a long-term thesis
- 2 years - mentioned as an example holding period in a hypothetical long-term thesis -
Technical Levels & Setups OR Macro Drivers (📌):
- The need for a clearly identified invalidation level before entering a trade or investment
- The psychological discipline to accept being wrong and exit when the invalidation level breaks -
Risk/Reward Framework (⚖️):
- Entry: Not established by the available evidence.
- Stop: Not established by the available evidence.
- Targets: Not established by the available evidence.
- Risk/Reward: Not established by the available evidence.
- Position Size: Not established by the available evidence.
- Probability: Not established by the available evidence. -
Scenario Analysis (🔄):
| Scenario | Probability | Target | Trigger |
|---|---|---|---|
| Bull | Not established by the available evidence. | Not established by the available evidence. | The predefined invalidation level is not broken; thesis continues in the expected direction. |
| Base | Not established by the available evidence. | Not established by the available evidence. | Price approaches but does not break the predefined invalidation level; thesis remains unconfirmed. |
| Bear | Not established by the available evidence. | Not established by the available evidence. | The predefined invalidation level breaks; the creator would stop out, take the loss, and reassess or move on. | -
Risk Factors (⚠️):
- The creator's advice is generic and lacks specific examples, making it impossible to verify actual application
- Without a defined invalidation level, a thesis is vulnerable to indefinite drawdown and subjective decision-making
- The evidence does not specify how to choose or validate an appropriate invalidation level, leaving room for misinterpretation -
Actionable Trading/Allocation Plan (🎯):
- For any new position, define a specific price level that invalidates the thesis before entry
- If that invalidation level breaks, stop out immediately and take the loss, then reassess the situation or move on
- Avoid relying on arbitrary drawdown percentages (e.g., 10% or 40%) as the sole basis for deciding whether a thesis is wrong
-
Creator Horizon Category (⏱️): Other — The transcript contains no market, financial, or investment content; it is a casual conversation about a sandwich shop.
-
One-Line Thesis (💡): The creator discusses the quality and characteristics of a cash-only sandwich shop called My Hero in North America, emphasizing its fresh in-house baked bread and specific sandwich preparation, as a contrast to factory food.
-
Key Data Points (📊):
- Cash only - My Hero restaurant operates on a cash-only basis.
- In-house baked bread - The shop bakes its own bread on premises.
- The 'champ' with 'the works' - A sandwich option containing ham and roast beef, with toppings of lettuce, tomato, onion, oil and vinegar, salt and pepper, and oregano. -
Technical Levels & Setups OR Macro Drivers (📌):
- Restaurant location - 'My Hero' is described as being in North America.
- Sandwich preparation method - The sandwich is wrapped after ordering, suggesting a specific service style.
- Food quality distinction - The creator contrasts the shop's fresh preparation with 'factory food'. -
Risk/Reward Framework (⚖️):
- Entry: Not established by the available evidence.
- Stop: Not established by the available evidence.
- Targets: Not established by the available evidence.
- Risk/Reward: Not established by the available evidence.
- Position Size: Not established by the available evidence.
- Probability: Not established by the available evidence. -
Scenario Analysis (🔄):
| Scenario | Probability | Target | Trigger |
|---|---|---|---|
| Bull | Not established by the available evidence. | Not established by the available evidence. | Another person visits the shop and confirms the described quality. |
| Base | Not established by the available evidence. | Not established by the available evidence. | The shop remains a personal preference mentioned in casual conversation without further verification. |
| Bear | Not established by the available evidence. | Not established by the available evidence. | The shop is found not to bake bread on premises or not to be cash-only. | -
Risk Factors (⚠️):
- The evidence is a transcript excerpt and does not include any verification of the shop's existence, location, or practices.
- The conversation is anecdotal and may reflect personal taste rather than objective quality. -
Actionable Trading/Allocation Plan (🎯):
- Verify the existence and location of 'My Hero' restaurant in North America.
- Confirm the cash-only policy and whether bread is baked on premises.
- Check if the 'champ with the works' is a standard menu item.
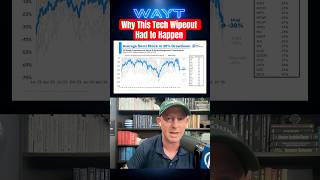
-
Creator Horizon Category (⏱️): Short-Term Technical — The evidence focuses on immediate drawdowns from 52-week highs and recent price action in tech hardware and semiconductor stocks.
-
One-Line Thesis (💡): The creator frames the recent sell-off in tech hardware and semiconductor stocks as a healthy correction within a broader market rotation, noting that other sectors like banks and industrials are still performing well.
-
Key Data Points (📊):
- Tech hardware and equipment stock drawdowns average down 27% from 52-week high — creator's observation
- Semi stocks average drawdown of 30% — creator's stated figure
- Marvell stock 'just got cut in half' — creator's statement
- Sandisk cut in half in 30 days — creator's claim
- Sandisk still up 100% year over year — creator's claim
- Sandisk still up ~200% from some prior reference point — creator's mention
- Jensen Huang said about a month or two ago Marvell would be the next trillion-dollar stock — creator's recollection -
Technical Levels & Setups OR Macro Drivers (📌):
- Excess of buying created short-term tops, as evidenced by chat comment 'MF'er I bought the top again' — creator's interpretation
- Market is a 'three-ring circus': one ring is semis drawdown, other rings are banks/investment banks and industrials where people are making money — creator's framing
- Semis felt like a one-way trade, implying crowded positioning — creator's view
- Despite the drawdown, Sandisk remains in an uptrend when zooming out — creator's technical assessment -
Risk/Reward Framework (⚖️):
- Entry: Not established by the available evidence.
- Stop: Not established by the available evidence.
- Targets: Not established by the available evidence.
- Risk/Reward: Not established by the available evidence.
- Position Size: Not established by the available evidence.
- Probability: Not established by the available evidence. -
Scenario Analysis (🔄):
| Scenario | Probability | Target | Trigger |
|---|---|---|---|
| Bull | Not established by the available evidence. | Not established by the available evidence. | If the broader market holds and other sectors (banks, industrials) continue to perform, the tech hardware and semi drawdowns may be contained — creator's implicit view that correction is healthy. |
| Base | Not established by the available evidence. | Not established by the available evidence. | Creator suggests the sell-off 'had to happen' after extreme moves, implying a normalization phase without a full market breakdown. |
| Bear | Not established by the available evidence. | Not established by the available evidence. | No explicit bear trigger is provided; the creator emphasizes that people are not throwing in the towel on other stocks, suggesting no systemic risk is currently identified. | -
Risk Factors (⚠️):
- The creator does not provide specific invalidation levels or downside targets for the affected stocks.
- The evidence lacks verification of the claimed drawdown percentages and year-over-year figures; these must be checked against market data.
- The creator's characterization of the market as 'healthy' is an interpretation, not a forecast, and could be wrong if the sell-off broadens. -
Actionable Trading/Allocation Plan (🎯):
- Verify Sandisk and Corning drawdown percentages from 52-week highs using market data.
- Verify the average drawdown of tech hardware and equipment stocks and semiconductor stocks.
- Verify Marvell's recent price decline and its previous commentary by Jensen Huang.
- Monitor whether the sell-off remains contained to tech hardware and semis or spreads to other sectors like banks and industrials.
- Track Sandisk's longer-term uptrend to see if the correction fits within that structure.

-
Creator Horizon Category (⏱️): Long-Horizon Macro / Structural — The episode discusses the long-term structural impact of agentic AI on traditional SaaS companies and the broader tech industry, rather than short-term technical setups.
-
One-Line Thesis (💡): The episode's central claim is that agentic AI, exemplified by OpenAI and Anthropic's explosive growth, may disrupt traditional SaaS business models and prompt a shift in technology spending, with uncertain ultimate profitability of the massive AI investment boom.
-
Key Data Points (📊):
- OpenAI and Anthropic's explosive growth — cited as a central driver of the discussion on AI disruption.
- Soaring cloud demand — mentioned as a key factor in the AI investment landscape.
- Diverging strategies of Microsoft, Meta, Amazon, Apple, Google, and other tech giants — presented as key variables in the AI race.
- Episode 253 of The Compound and Friends — context for the discussion.
- No specific figures, prices, or valuations are present in the evidence. -
Technical Levels & Setups OR Macro Drivers (📌):
- Agentic AI's potential to make traditional SaaS obsolete — cited as a core threat to traditional software companies.
- OpenAI and Anthropic's explosive growth — presented as evidence of AI momentum.
- Soaring cloud demand — cited as a driver of AI infrastructure spending.
- Diverging strategies of major tech giants — presented as a source of uncertainty and competitive dynamics.
- Massive spending boom — questioned as to whether it can deliver lasting returns. -
Risk/Reward Framework (⚖️):
- Entry: Not established by the available evidence.
- Stop: Not established by the available evidence.
- Targets: Not established by the available evidence.
- Risk/Reward: Not established by the available evidence.
- Position Size: Not established by the available evidence.
- Probability: Not established by the available evidence. -
Scenario Analysis (🔄):
| Scenario | Probability | Target | Trigger |
|---|---|---|---|
| Bull | Not established by the available evidence. | Not established by the available evidence. | Agentic AI firms continue explosive growth and cloud demand remains strong, potentially leading to AI profits accruing to major players. |
| Base | Not established by the available evidence. | Not established by the available evidence. | AI adoption proceeds with traditional SaaS companies adapting, while spending boom continues without immediate collapse. |
| Bear | Not established by the available evidence. | Not established by the available evidence. | Massive spending boom fails to deliver lasting returns, leading to overcapacity and financial losses for tech giants. | -
Risk Factors (⚠️):
- Traditional SaaS companies may be disrupted, leading to revenue erosion for incumbents.
- Massive AI spending may not yield sufficient returns, causing write-downs or capital misallocation.
- Diverging strategies among tech giants create competitive uncertainty and potential for missteps. -
Actionable Trading/Allocation Plan (🎯):
- Monitor OpenAI and Anthropic growth metrics and any public disclosures to verify the explosive growth claim.
- Track cloud service provider earnings and capital expenditure guidance to validate soaring cloud demand.
- Review earnings calls and strategic announcements from Microsoft, Meta, Amazon, Apple, and Google to assess diverging AI strategies.
- Follow analyst reports and industry data on AI spending vs. revenue to evaluate the long-term profitability of the AI investment boom.
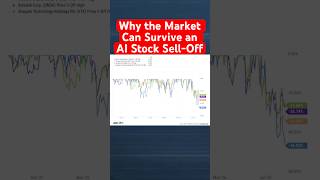
-
Creator Horizon Category (⏱️): Short-Term Technical — The creator focuses on immediate price drops in semiconductor memory stocks relative to all-time highs, indicating a short-term technical observation.
-
One-Line Thesis (💡): The sharp declines in semiconductor memory stocks are interpreted as healthy market rotation, not a bubble signal, given the S&P is only 2% off all-time highs.
-
Key Data Points (📊):
- Micron down 27% from highs — memory stock decline
- Western Digital down 34% from highs — memory stock decline
- SanDisk down 46% from highs — memory stock decline
- Seagate Technologies down 26% from highs — memory stock decline
- S&P 2% off all-time highs — market context
- Nvidia down 5% in a flat market — leadership stock decline -
Technical Levels & Setups OR Macro Drivers (📌):
- Semiconductor memory names are experiencing severe drawdowns, possibly linked to DRAM portfolio exposure.
- Declines in leadership stocks like Nvidia alongside a flat market suggest rotation rather than systemic risk. -
Risk/Reward Framework (⚖️):
- Entry: Not established by the available evidence.
- Stop: Not established by the available evidence.
- Targets: Not established by the available evidence.
- Risk/Reward: Not established by the available evidence.
- Position Size: Not established by the available evidence.
- Probability: Not established by the available evidence. -
Scenario Analysis (🔄):
| Scenario | Probability | Target | Trigger |
|---|---|---|---|
| Bull | Not established by the available evidence. | Not established by the available evidence. | S&P remains near all-time highs while laggards decline, indicating healthy market broadening. |
| Base | Not established by the available evidence. | Not established by the available evidence. | Market continues with selective sell-offs in overheated sectors while indices stay elevated. |
| Bear | Not established by the available evidence. | Not established by the available evidence. | If the S&P begins to follow the leadership stocks lower, the 'good news' narrative would be invalidated. | -
Risk Factors (⚠️):
- The declines in memory stocks could be the start of a broader technology sell-off that eventually drags the S&P lower.
- The creator's 'easy call' is presented without detailed reasoning or data, limiting verification of the underlying thesis. -
Actionable Trading/Allocation Plan (🎯):
- Track the price action of Micron, Western Digital, SanDisk, and Seagate to confirm whether their drawdowns persist or stabilize.
- Watch Nvidia's daily moves relative to the overall market to assess if leadership weakness is broadening.
-
Creator Horizon Category (⏱️): Short-Term Technical — The video is a live pre-market technical analysis session for futures and options traders, indicating a short-term trading focus.
-
One-Line Thesis (💡): The video title suggests that a liquidation event involving LEO may lead to a 'lock out' rally, but the available metadata provides no specific analysis or evidence to support this claim.
-
Key Data Points (📊):
- LEO liquidated — video title claims a liquidation event involving LEO, likely referring to a cryptocurrency or stock ticker.
- Lock Out Rally Incoming!? — title suggests an expected rally following the liquidation, but conditions are undefined. -
Technical Levels & Setups OR Macro Drivers (📌):
- Pre-market technical analysis for futures and options traders — the video is positioned as a daily live session providing technical analysis.
- LEO liquidation — the title indicates a recent liquidation event as a potential catalyst, but no specifics are provided. -
Risk/Reward Framework (⚖️):
- Entry: Not established by the available evidence.
- Stop: Not established by the available evidence.
- Targets: Not established by the available evidence.
- Risk/Reward: Not established by the available evidence.
- Position Size: Not established by the available evidence.
- Probability: Not established by the available evidence. -
Scenario Analysis (🔄):
| Scenario | Probability | Target | Trigger |
|---|---|---|---|
| Bull | Not established by the available evidence. | Not established by the available evidence. | The title suggests a 'lock out rally' could occur after the LEO liquidation, but no trigger level or confirmation is provided. |
| Base | Not established by the available evidence. | Not established by the available evidence. | No base scenario is described in the evidence; the title implies a directional move but without specifics. |
| Bear | Not established by the available evidence. | Not established by the available evidence. | A bear scenario could occur if the 'lock out rally' fails to materialize, but no invalidation level is mentioned. | -
Risk Factors (⚠️):
- The evidence is metadata-only; the creator's actual analysis and claims are not captured, so any thesis is unverified.
- The ticker 'LEO' is ambiguous; it could refer to a cryptocurrency (e.g., UNUS SED LEO) or a stock, and without clear identification, analysis is speculative. -
Actionable Trading/Allocation Plan (🎯):
- Watch the full video to extract the creator's specific technical levels, catalysts, and risk parameters for LEO.
- Identify the exact asset represented by 'LEO' and verify current market data against the creator's claims.
- Monitor for confirmation of the 'lock out rally' thesis through subsequent price action or additional creator commentary.
-
Creator Horizon Category (⏱️): Long-Horizon Macro / Structural — The discussion centers on structural shifts in AI adoption, cloud growth, and model commoditization, with long-term implications for tech valuations.
-
One-Line Thesis (💡): AI models are rapidly commoditizing, shifting value to applications and cloud infrastructure, while hyperscalers like Microsoft, Google, and Amazon see accelerating cloud revenue from AI demand.
-
Key Data Points (📊):
- ChatGPT weekly active users: ~900 million announced, >1 billion per Sensor Tower (up from <200 million in June 2024).
- Autonomous coding: models went from 0 hours of autonomous coding in 2024 to equivalent of 12-16 hours of human coding before interruption.
- OpenAI and Anthropic expected to do ~$80 billion revenue this year, possibly >$100 billion.
- Azure growth: 43% YoY, highest since 2022, with $30 billion quarterly revenue.
- Google Cloud growth: 82% YoY.
- AWS growth: 36.7% YoY, fastest in 18 quarters, exceeding expectations of 31%.
- Meta free cash flow: down ~90% quarter-over-quarter to $784 million (from $12 billion).
- Microsoft had its best day since 2008 after earnings; Meta's stock fell ~10%.
- OpenAI price cuts: two of three latest models cut by 20% and 80% per token.
- Anthropic's Claude code is now a substantial part of revenue, possibly majority.
- China's Kimmy K2 model: focused on agentic coding, matches frontier in that area.
- OpenRouter: a company trying to buy it for $10 billion.
- Meta's capex guidance suspended.
- Microsoft affirmed 2027 positive free cash flow; data center life extended from 15 to 25 years.
- Amazon AWS AI business exceeding $2 billion annual revenue run rate.
- Oracle's stock down 70% (likely from highs, context unclear). -
Technical Levels & Setups OR Macro Drivers (📌):
- Cloud demand from AI is accelerating across hyperscalers, driving revenue growth.
- Commoditization of AI models (open-weight models, Chinese competition) pressures model pricing, pushing value to applications.
- Agentic AI use cases (e.g., ChatGPT searches) could drive massive compute demand.
- Meta's heavy AI capex without offsetting revenue is a bearish driver; potential compute leasing could be a positive.
- Apple's potential to become a consumer AI toll booth via agentic Siri is a structural opportunity.
- Reddit's data licensing deals and potential AI crawler blocking could impact its valuation. -
Risk/Reward Framework (⚖️):
- Entry: Not established by the available evidence.
- Stop: Not established by the available evidence.
- Targets: Not established by the available evidence.
- Risk/Reward: Not established by the available evidence.
- Position Size: Not established by the available evidence.
- Probability: Not established by the available evidence. -
Scenario Analysis (🔄):
| Scenario | Probability | Target | Trigger |
|---|---|---|---|
| Bull | Not established by the available evidence. | Not established by the available evidence. | AI capabilities continue to improve and are adopted widely, leading to sustained cloud revenue growth for hyperscalers and new product revenues (e.g., Meta's AI tools, Apple's agentic Siri). |
| Base | Not established by the available evidence. | Not established by the available evidence. | AI and cloud growth continue at current pace, but market volatility persists as investors question capex ROI; model commoditization keeps margins in check. |
| Bear | Not established by the available evidence. | Not established by the available evidence. | AI spending does not translate into profits, leading to an 'AI winter' or capex pullback; legal costs (e.g., Meta) or regulatory actions hamper growth; model commoditization erodes margins faster than expected. | -
Risk Factors (⚠️):
- Model commoditization could erode pricing power for frontier labs like OpenAI and Anthropic.
- Heavy capex without immediate revenue may lead to market punishment (as seen with Meta).
- Legal and regulatory risks for Meta (addiction lawsuits) and Microsoft (openAI partnership changes).
- AI winter possibility if progress stalls or economic benefits fail to materialize.
- Tech company valuations may be based on a 'call option on AGI' that may not pay off. -
Actionable Trading/Allocation Plan (🎯):
- Monitor hyperscaler cloud growth rates (Azure, Google Cloud, AWS) and their capex guidance for signs of acceleration or slowdown.
- Track OpenAI and Anthropic revenue growth and price cuts to gauge model commoditization impact.
- Review Meta's free cash flow and any announcements about compute leasing or AI product launches.
- Follow developments in agentic AI adoption, as indicated by usage of ChatGPT agentic features and compute demand.
- Watch Oracle's stock performance and its dependence on OpenAI for clues on AI infrastructure stock sensitivity.

-
Creator Horizon Category (⏱️): Short-Term Technical — The video is a live trading stream focused on intraday and end-of-month market movements, particularly chip stocks and Korea indices, indicating a short-term technical focus.
-
One-Line Thesis (💡): The creator claims that chip stocks are rallying after the 'liquidition of Situational Awareness' and that Korea stocks had one of their best rallies on record, with traders digesting earnings and hoping for continued rally after the rout in chips.
-
Key Data Points (📊):
- Chip stocks continue to rally — context: described as continuing after the 'liquidition of Situational Awareness'
- Korea stocks had one of their best rallies on record — context: mentioned as a notable market event
- Traders come into the end of the month — context: timing of market activity
- Earnings digest — context: traders are processing earnings reports
- Rout in chips — context: prior decline in chip stocks followed by a rally -
Technical Levels & Setups OR Macro Drivers (📌):
- Chip stock rally — catalyst: post-liquidation recovery and continued momentum
- Korea stock rally — described as one of the best on record
- End-of-month positioning — traders digesting earnings and positioning for continued rally -
Risk/Reward Framework (⚖️):
- Entry: Not established by the available evidence.
- Stop: Not established by the available evidence.
- Targets: Not established by the available evidence.
- Risk/Reward: Not established by the available evidence.
- Position Size: Not established by the available evidence.
- Probability: Not established by the available evidence. -
Scenario Analysis (🔄):
| Scenario | Probability | Target | Trigger |
|---|---|---|---|
| Bull | Not established by the available evidence. | Not established by the available evidence. | Chips continue to rally and Korea stocks maintain record pace, with traders optimistic heading into month-end. |
| Base | Not established by the available evidence. | Not established by the available evidence. | Chips hold gains while market digests earnings; Korea rally consolidates. |
| Bear | Not established by the available evidence. | Not established by the available evidence. | Chip rout resumes or Korea rally reverses, breaking the current momentum. | -
Risk Factors (⚠️):
- The term 'liquidition of Situational Awareness' is unclear and may refer to a specific event or entity not defined in the evidence.
- No specific tickers, price levels, or technical indicators are provided to verify claims.
- The description lacks detail on how the 'rout in chips' ended or what catalysts sustain the rally.
- The evidence is metadata-only; actual live trading content may contain more specifics not captured here. -
Actionable Trading/Allocation Plan (🎯):
- Monitor chip stock indices and major semiconductor ETFs for continued rally or reversal signs.
- Track Korea stock indices (e.g., KOSPI) to verify the 'best rallies on record' claim against historical data.
- Review corporate earnings reports of major chip and Korea-listed companies to assess fundamental support.
- Search for the term 'Situational Awareness' in the financial news to clarify the liquidation event referenced.
-
Creator Horizon Category (⏱️): Short-Term Technical — The video is a pre-market live stream focused on technical analysis for futures and options traders, with coverage of AAPL and AMZN earnings, indicating a short-term horizon.
-
One-Line Thesis (💡): The creator suggests that a capitulation low may have been established in the market, and pre-market technical analysis of AAPL and AMZN earnings is provided to assess actionable setups for futures and options traders.
-
Key Data Points (📊):
- Title contains 'Capitulation low in!?' implying a potential market bottom claim.
- Video covers AAPL & AMZN earnings, two major tickers with earnings catalysts.
- Description promotes a live squawk, technical analysis course, trading scripts, and a swing trade newsletter, all hosted at tradebrigade.co.
- Creator states they provide pre-market technical analysis for futures traders and options traders. -
Technical Levels & Setups OR Macro Drivers (📌):
- Earnings reports for AAPL and AMZN serve as the primary catalyst discussed in the video.
- The concept of a 'capitulation low' is identified as a potential technical setup, though no specific price levels or confirmation criteria are provided in the metadata. -
Risk/Reward Framework (⚖️):
- Entry: Not established by the available evidence.
- Stop: Not established by the available evidence.
- Targets: Not established by the available evidence.
- Risk/Reward: Not established by the available evidence.
- Position Size: Not established by the available evidence.
- Probability: Not established by the available evidence. -
Scenario Analysis (🔄):
| Scenario | Probability | Target | Trigger |
|---|---|---|---|
| Bull | Not established by the available evidence. | Not established by the available evidence. | A confirmed capitulation low as suggested by the question in the title, which would require verifying higher price action and volume patterns not specified in the metadata. |
| Base | Not established by the available evidence. | Not established by the available evidence. | AAPL and/or AMZN earnings results causing a range-bound market without a decisive breakout or breakdown. |
| Bear | Not established by the available evidence. | Not established by the available evidence. | If the capitulation low is false and price breaks below recent lows following earnings, invalidating the setup. | -
Risk Factors (⚠️):
- The title suggests a possible capitulation low but provides no specific price levels or confirmation criteria to validate the claim.
- Earnings outcomes for AAPL and AMZN are binary events that could invalidate any pre-market technical analysis.
- The creator's analysis is based solely on technical factors and does not account for fundamental or macroeconomic risks. -
Actionable Trading/Allocation Plan (🎯):
- Verify the specific price levels, stop-losses, and targets the creator discussed during the live stream by watching the full video.
- Monitor AAPL and AMZN post-earnings price action and volume to assess whether the claimed capitulation low is holding.
- Check the newsletter or live squawk for any updated trade setups or invalidation triggers provided by the creator.
-
Creator Horizon Category (⏱️): Long-Horizon Macro — The creator discusses multi-year structural themes (supply-chain realignment, aging demographics, AI-driven demand cycles) and portfolio positioning over several years, without referencing short-term technicals or near-term catalysts.
-
One-Line Thesis (💡): Lauren Hochfelder argues that the real assets (real estate and infrastructure) market is four-plus years into a correction with values still down 20%+ and new supply dramatically reduced, creating an attractive entry window for investors who can capitalize on structural drivers (AI, supply-chain rebalancing, aging demographics) through disciplined, theme-driven, value-add strategies while avoiding bubbly sectors and mega-cap fund forced-deployment dynamics.
-
Key Data Points (📊):
- $80 billion of investable capital under management across 300+ people, 20 offices, 13 countries.
- Rents in Silicon Valley industrial assets up ~40% over the last several years; rents in California's Inland Empire down ~40% over the same period.
- Real estate values still down 20%+ from peaks, while the broader investable universe is at all-time highs.
- 80-plus age cohort growing at nearly 5% per year while overall population is roughly flat.
- Morgan Stanley Real Assets runs mid-market closed-end funds sized to avoid forced deployment (contrasted with mega-cap funds of $20+ billion to be deployed over 4 years).
- Post-GFC, the business streamlined to fewer strategies, implemented pooled incentive structures, and centralized decision-making to avoid regional bias.
- Lauren Hochfelder joined Morgan Stanley as an analyst straight out of Yale and has been at the firm for 26 years.
- She recently took on broader responsibilities as global co-head of real assets (real estate, infrastructure equity and credit) about six months prior to the interview. -
Technical Levels & Setups OR Macro Drivers (📌):
- Multi-polar world and U-turn on globalization drive supply-chain realignment, favoring industrial assets in select submarkets.
- Aging demographics (80+ cohort growing ~5% annually) boost demand for senior housing.
- AI/Physical AI trends accelerate e-commerce growth, advanced manufacturing, and power/fiber infrastructure needs.
- Replacement cost discipline: real estate values trading consistently below replacement cost for the first time since the GFC, with new supply falling off dramatically, creating a bullish setup for rents and values.
- Higher, rangebound interest rates require investors to focus on outsized income growth rather than multiple expansion or cheap borrowing.
- Pooled incentive structures and centralized investment committees after GFC shift behavior away from regional bias and deal-level incentives. -
Risk/Reward Framework (⚖️):
- Entry: Not established by the available evidence.
- Stop: Not established by the available evidence.
- Targets: Not established by the available evidence.
- Risk/Reward: Not established by the available evidence.
- Position Size: Not established by the available evidence.
- Probability: Not established by the available evidence. -
Scenario Analysis (🔄):
| Scenario | Probability | Target | Trigger |
|---|---|---|---|
| Bull | Not established by the available evidence. | Not established by the available evidence. | Confirmed continued structural demand in AI/infrastructure, industrial, senior housing, and net lease sectors; further declines in new supply; real estate values remain below replacement cost; disciplined mid-market fund sizing avoids forced deployment. |
| Base | Not established by the available evidence. | Not established by the available evidence. | The current correction continues to resolve gradually with selective value creation through active asset repositioning, while public incentives and regulatory shifts for office conversions develop slowly. |
| Bear | Not established by the available evidence. | Not established by the available evidence. | CapEx cycle for AI/Data Center turns down; supply response kicks in faster than expected; construction costs continue to rise, making repositioning economics unviable; re-globalization or trade policy shifts disrupt industrial demand assumptions; a sharp recession causes tenant distress across real assets. | -
Risk Factors (⚠️):
- The claim that real estate values are still down 20%+ and that new supply is falling off dramatically is a firm-level view—needs independent verification from aggregated third-party indices (e.g., NCREIF, RCA, CBRE).
- The 40% rent increase in Silicon Valley industrial and 40% decline in Inland Empire industrial are not time-stamped precisely; regional rent indices should be checked against CoStar or CBRE data.
- The assertion that mid-market fund sizing avoids forced deployment and improves selectivity is unquantified; cross-check fund size relative to deployment track record in SEC filings or offering memoranda.
- The 80+ age cohort growth claim (nearly 5% annually) should be verified against U.S. Census Bureau population projections.
- The statement that real estate is one of the most effective inflation hedges across the broader investable universe is generic; academic literature shows inflation hedging varies by property type and lease structure.
- The claim that the firm was very early to identify global supply chain realignment and pulled back on Inland Empire based on internal data is an untestable proprietary claim without external market timing proof.
- No specific fund names, entry dates, price targets, or risk/reward ratios are provided, limiting verification of the creator's execution plan. -
Actionable Trading/Allocation Plan (🎯):
- Cross-check the claim that real estate values are down 20%+ using the NCREIF Property Index or RCA CPPI.
- Verify supply-side data (new construction starts) from Dodge Data & Analytics or CBRE Econometric Advisors.
- Track 80+ population growth using U.S. Census Bureau annual projections.
- Review Morgan Stanley Real Assets' fund size and deployment pace via ADV filings or annual reports to validate the 'no forced deployment' claim.
- Analyze replacement cost trends by property type using construction cost indices (e.g., Turner, Rider Levett Bucknall) against transaction data.

-
Creator Horizon Category (⏱️): Short-Term Technical — The video is a live trading stream focused on immediate market reaction to Kevin Warsh's hawkish hold (July 30) and the same-day AAPL and AMZN earnings releases, indicating a short-term event-driven horizon.
-
One-Line Thesis (💡): Markets are digesting Kevin Warsh's hawkish hold as they prepare for AAPL and AMZN earnings, with the creator positioning for intraday volatility around these catalysts.
-
Key Data Points (📊):
- AAPL earnings – claim by creator as a key catalyst
- AMZN earnings – claim by creator as a key catalyst
- Creator trades on Etrade Pro (screen shown), ThinkOrSwim (long-term investing), Fidelity (long-term)
- Stream title: 'Tempered or Tantrum? - AAPL & AMZN EARNINGS - JULY 30' -
Technical Levels & Setups OR Macro Drivers (📌):
- Kevin Warsh's hawkish hold is cited as a macro driver creating uncertainty in market direction.
- AAPL and AMZN earnings releases are the primary event-driven setups for intraday trading. -
Risk/Reward Framework (⚖️):
- Entry: Not established by the available evidence.
- Stop: Not established by the available evidence.
- Targets: Not established by the available evidence.
- Risk/Reward: Not established by the available evidence.
- Position Size: Not established by the available evidence.
- Probability: Not established by the available evidence. -
Scenario Analysis (🔄):
| Scenario | Probability | Target | Trigger |
|---|---|---|---|
| Bull | Not established by the available evidence. | Not established by the available evidence. | Positive earnings surprises from AAPL and/or AMZN, overriding hawkish macro headwinds. |
| Base | Not established by the available evidence. | Not established by the available evidence. | Mixed earnings results and continued digestion of Warsh's hawkish rhetoric, leading to range-bound choppy action. |
| Bear | Not established by the available evidence. | Not established by the available evidence. | Disappointing AAPL or AMZN earnings combined with persistent hawkish pressure from Warsh's commentary, prompting a selloff. | -
Risk Factors (⚠️):
- Missing real-time trade alerts or rationale because creator states he may not answer questions when 'in the zone trading.'
- The creator explicitly warns that copying trades is likely to lead to losses and that options trading is risky – no specific risk parameters are disclosed.
- Only metadata from the video is available; no actual trading decisions, entry/exit levels, or detailed analysis of Warsh's comments or earnings expectations are provided in the evidence. -
Actionable Trading/Allocation Plan (🎯):
- Monitor post-earnings price action and volume in AAPL and AMZN for directional bias relative to pre-earnings levels.
- Track any additional commentary from Kevin Warsh or FOMC-related news for shifts in hawkish/dovish tone.
- Review the linked 'Nightly Watchlist' video for the creator's detailed post-market breakdown of setups and levels.

-
Creator Horizon Category (⏱️): Short-Term Technical — The creator analyzes daily and hourly charts for SPY, QQQ, and IWM over a one-to-three-day outlook, focusing on the next day's open and potential counter-trend trades.
-
One-Line Thesis (💡): The creator argues that the market is in a downtrend but is extended to the downside, making new shorts unattractive at the lows, and that a capitulation gap down would offer a better risk/reward for a counter-trend long into next week.
-
Key Data Points (📊):
- SPY closed under the 20-day, 50-day, and 8 EMA moving averages, and below a weekly support area — "this is effectively a breakdown."
- QQQ is down 6.63% from the last lower high to today's close.
- NASDAQ volume outflows are substantial ("150% of average 20-day volume"), and the cumulative tick on the NASDAQ is "underneath 6,000."
- SMH (semiconductor ETF) is down 10.91% for the day.
- DRAM ETF (DRAM) is down 18% on the week so far.
- MU (Micron) is down 8% today and off 41% from its all-time high to today's low.
- SNDK (SanDisk) is down 57% from its spin-off high.
- Meta (META) is gapping down after-hours toward the 545 weekly low; the creator notes the legal expenses and a "straight line round tripping the entire move."
- Dell (DELL) after-hours is gapping up; the creator highlights its relative strength.
- CLF (Cleveland-Cliffs) has a 6.3% ATR and a power earnings gap setup.
- VIX is ramping but VIX futures are still in contango — "one day VIX ramping."
- Junk bonds (HYG) are "holding on by a thread" at a daily higher low attempt.
- 30-year yield (TYX) is at a new high. -
Technical Levels & Setups OR Macro Drivers (📌):
- Capitulation low setup: Gap down in QQQ to the lower bound of the weekly expected move (725 on SPY, 640 on QQQ), look below and fail the overnight low, then go long for a counter-trend rally to the point of control or the declining 8 EMA.
- For QQQ: On a gap down to the 200-day SMA (around 640), look for a counter-trend long; if opening in range, a look below and fail of the prior day low could target the declining 8 EMA at 686.
- For Nvidia (NVDA): Either look below and fail for a counter-trend long near the lows, or let it build a neckline for a breakout next week.
- For AMD: Brigade bolt over 447 if it reclaims that level.
- For MU: Gap down preferred; if so, look below and fail the prior day low for a counter-trend long.
- For JPM: Look below and fail off the 20-day moving average for a long.
- For MDB: Short on a weak rally into the moving average cluster.
- For NBIS: Look below and fail the 200-day SMA for a long near 140.
- For LRCX: Look below and fail the prior day low, reclaim the 200-day SMA for an oversold bounce.
- For Dell: If it reclaims the 50-day moving average, it's a relative strength leader to buy. -
Risk/Reward Framework (⚖️):
- Entry: Not established by the available evidence.
- Stop: Not established by the available evidence.
- Targets: Not established by the available evidence.
- Risk/Reward: Not established by the available evidence.
- Position Size: Not established by the available evidence.
- Probability: Not established by the available evidence. -
Scenario Analysis (🔄):
| Scenario | Probability | Target | Trigger |
|---|---|---|---|
| Bull | Not established by the available evidence. | Not established by the available evidence. | Verify the trigger against the source evidence. |
| Base | Not established by the available evidence. | Not established by the available evidence. | Open in range on SPY and QQQ, churn sideways, no gap down; then look for a short at overhead supply (742 on SPY, 686 on QQQ) to sustain the downtrend, or a sideways chop. |
| Bear | Not established by the available evidence. | Not established by the available evidence. | No gap down, market opens in range and fails to rally; then a short continuation from a lower high at 742 (SPY) or 686 (QQQ) for a breakdown below current lows; or if the RSP weakens and growth/momentum keeps getting crushed, leading to a 20% decline. | -
Risk Factors (⚠️):
- The creator notes that market internals on the NYSE (volume outflows, AD line, cumulative tick) are not showing aggressive selling, so a capitulation low may be absent.
- The creator warns that if the market opens in range and just chops, it will be a "pain in the butt" with no emotion or offsides positioning, making the long setup less compelling.
- Meta (META) and other Mag 7 names (like Google) are gapping down, potentially offsetting Microsoft's positive after-hours move.
- 30-year yields are at new highs, which is a head-scratcher for the bullish case and could pressure equities. -
Actionable Trading/Allocation Plan (🎯):
- Monitor after-hours and overnight futures for a gap down in QQQ toward 640 and SPY toward 725.
- If a gap down occurs, verify a look below and fail of the overnight low before considering a counter-trend long.
- If no gap down, wait for an open in range and watch for a rally to 742 (SPY) or 686 (QQQ) to assess if a short continuation develops.
- Track VIX futures for a shift to backwardation then back to contango as a potential capitulation signal.
- Watch junk bonds (HYG) to see if they hold the daily higher low attempt, supporting the "don't short the hole" view.
- Follow after-hours moves on Microsoft, Meta, Dell, CrowdStrike, Oracle, and other named stocks to gauge sector rotation.
- Observe the RSP (equal-weight S&P) for signs of weakening, which the creator warns could precede a larger decline if growth/momentum are already crushed.

-
Creator Horizon Category (⏱️): Long-Horizon Macro / Structural — The creator describes a rules-based quantitative strategy (Porterhouse) that is a permanent sleeve in a diversified portfolio, not a short-term tactical trade.
-
One-Line Thesis (💡): A rules-based momentum strategy called Porterhouse is the purest expression of the idea that markets work because they are momentum-based, designed to capture outsized gains from stocks that keep rising, which human investors cannot replicate due to behavioral biases.
-
Key Data Points (📊):
- Micron (MU) example: creator asserts it 'goes up 300 points' (no timeframe given) and then 'goes up another 300 points', claiming only the Porterhouse strategy or 'psychopaths' capture that second leg.
- Benchmark S&P 500 is described as 'the world's greatest momentum strategy' because it overweights stocks that 'just went up the most' (e.g., Nvidia, Apple at 10% weight).
- Porterhouse is a sleeve run in concert with a diversified core portfolio; it is not an all-in bet and should not replace a diversified portfolio. -
Technical Levels & Setups OR Macro Drivers (📌):
- Momentum factor: creator claims if expressed correctly in a portfolio it will beat the market over time.
- Behavioral obstacle: advisors/clients cannot place these trades because they will not buy stocks that have already run up and will buy falling stocks trying to bottom-fish.
- The strategy is anti-discretionary: decisions are made quantitively, not by weekly meetings or subjective stock picking. -
Risk/Reward Framework (⚖️):
- Entry: Not established by the available evidence.
- Stop: Not established by the available evidence.
- Targets: Not established by the available evidence.
- Risk/Reward: Not established by the available evidence.
- Position Size: Not established by the available evidence.
- Probability: Not established by the available evidence. -
Scenario Analysis (🔄):
| Scenario | Probability | Target | Trigger |
|---|---|---|---|
| Bull | Not established by the available evidence. | Not established by the available evidence. | Momentum factor continues to express correctly; the strategy captures continued upside in trending names like Micron. |
| Base | Not established by the available evidence. | Not established by the available evidence. | The momentum factor performs in line with long-term historical data; Porterhouse sleeve remains a minority allocation within a diversified portfolio. |
| Bear | Not established by the available evidence. | Not established by the available evidence. | Periods where momentum underperforms (creator acknowledges this is expected and designed as a sleeve, not an all-in bet). | -
Risk Factors (⚠️):
- No historical backtest, out-of-sample performance, or live track record is provided for Porterhouse.
- The Micron example is anecdotal and lacks specific price levels, dates, or trade details to verify the claim of '300 points' gains.
- The claim that the S&P 500 is 'the world's greatest momentum strategy' is a simplified characterization of a cap-weighted index; no rigorous evidence is cited.
- No disclosure of fees, turnover, tax implications, or implementation costs for the quantitative strategy. -
Actionable Trading/Allocation Plan (🎯):
- Obtain the formal rules and backtested results of the Porterhouse strategy from The Compound to verify its performance and risk characteristics.
- Track the specific momentum factor(s) used (e.g., trailing return, volatility adjustment) and compare to a passive S&P 500 benchmark over a complete market cycle.
- Monitor the relative performance of a 'momentum sleeve' versus a diversified core portfolio during momentum underperformance periods (e.g., sharp reversals).

-
Creator Horizon Category (⏱️): Other — The evidence contains an anecdote about a family roller coaster experience and does not establish any financial or market horizon.
-
One-Line Thesis (💡): The creator describes a personal story about his son George passing out repeatedly on a wooden roller coaster, a phenomenon the creator claims is known to happen on high-adrenaline rides, but no financial thesis is presented in the provided transcript.
-
Key Data Points (📊):
- George passed out and went limp on every drop of the wooden roller coaster described as the biggest wooden roller coaster in the world.
- The creator mentions the ride is called "Shiver My Timbers" (approximate). -
Technical Levels & Setups OR Macro Drivers (📌):
- Not established by the available evidence. -
Risk/Reward Framework (⚖️):
- Entry: Not established by the available evidence.
- Stop: Not established by the available evidence.
- Targets: Not established by the available evidence.
- Risk/Reward: Not established by the available evidence.
- Position Size: Not established by the available evidence.
- Probability: Not established by the available evidence. -
Scenario Analysis (🔄):
| Scenario | Probability | Target | Trigger |
|---|---|---|---|
| Base | Not established by the available evidence. | Not established by the available evidence. | The creator asserts that passing out on amusement rides is a real phenomenon, supported by videos he references. | -
Risk Factors (⚠️):
- The anecdote is entirely non-financial and lacks any market or investment context; the creator's claims about passing out on rides cannot be verified without external medical or ride-safety sources.
- No tickers, economic data, or investing thesis are present in the evidence, making any financial analysis impossible. -
Actionable Trading/Allocation Plan (🎯):
- If relevant for safety research, verify the phenomenon of ride-induced syncope using peer-reviewed medical literature or ride-operator safety reports.
- Treat this transcript as unrelated to financial markets and do not incorporate into any investment framework.
-
Creator Horizon Category (⏱️): Short-Term Technical — Joey from TheChartGuys frames the analysis around intraday to daily oversold bounces, hourly lower highs, and the next two trading days until month-end, explicitly watching for daily oversold conditions and monthly 12 EMAs.
-
One-Line Thesis (💡): After the FOMC no-hike announcement, the market saw a unified sell-off across all sectors, breaking the prior rotation pattern, and bears are attempting to initiate monthly consolidation in the S&P 500 to join the already-consolidating tech and semiconductor sectors.
-
Key Data Points (📊):
- S&P 500 had one of its biggest red days since the top at the beginning of June.
- SPY broke a tightening range to the downside with a large wick, creating chart discrepancy.
- NASDAQ (NQ) is approaching daily oversold conditions with RSI projection tool level at 26960.
- QQQ daily oversold level at 65155; if lost, next support is monthly 12 EMA and previous all-time high in the mid-630s.
- Cosby (Korean KOSPI-related index) experienced capitulatory action; critical support is monthly 12 EMA.
- SMH daily oversold level at 48096; if lost, next downside target is monthly 12 EMA.
- Russell (IWM) testing weekly 12 EMA; failure could lead to monthly consolidation.
- XLF and XLV consolidating off all-time highs; daily 12 EMA is key support for both.
- IGV (software) unable to confirm weekly downtrend; watching for lower high versus 9558.
- XBI nearing weekly 12 EMA around 139-140 area.
- MAGs (Megacap tech) set to gap down after Meta earnings; nearing 2026 lows.
- 30-year government bond yield pushing to new highs, providing headwind.
- NVDA in weekly downtrend with double top, a few pennies away from continuation.
- Google is a green spot, on a daily stair-step up.
- Tesla (TSLA) in a busted rising wedge, weak on ratio chart.
- SNDK down ~50% from highs, nearing daily oversold; monthly 12 EMA around 75 and previous all-time high around 68.
- Bitcoin (BTC) testing weekly 12 EMA on the Bitcoin/Nasdaq ratio; rejecting would end relative strength.
- Ethereum (ETH) daily 12 EMA rider being tested; loss would begin weekly consolidation.
- Gold and silver held relatively well; key level is two-day 12 EMA to confirm uptrend.
- Oil (USO) in a daily stair-step bull break bounce; 9350 is key for lower high determination.
- Joey noted the lack of rotation: XLF, XLV, MAGS, SMH, QQQ all sold off together. -
Technical Levels & Setups OR Macro Drivers (📌):
- FOMC decision (no hike) triggered the initial reaction, but bears drove the close.
- Unified sector sell-off (no rotation between financials, healthcare, tech, semiconductors) enabled SPY's large red day and downside break.
- Daily oversold conditions in tech/semiconductors are the primary setup for a potential bounce.
- Monthly 12 EMA and previous all-time highs are the next structural support zones if daily oversold fails.
- Bitcoin/Nasdaq ratio testing weekly 12 EMA; rejection would remove Bitcoin's recent relative strength.
- 30-year yield new highs without follow-through could top and allow a bounce in equities.
- South Korean liquidations dragging semiconductors; overleveraged market increases downside risk.
- Joey references the 2-day 12 EMA ratio on SMH/QQQ as a key character-shift indicator that was flagged on July 2nd.
- Creator identifies hourly lower highs as the immediate resistance pattern; bulls need to regain hourly uptrend to shift momentum.
- Gold/silver ratio (gold/ES) triggering renewed interest in metals when it cleared daily 12 EMA. -
Risk/Reward Framework (⚖️):
- Entry: Not established by the available evidence.
- Stop: Not established by the available evidence.
- Targets: Not established by the available evidence.
- Risk/Reward: Not established by the available evidence.
- Position Size: Not established by the available evidence.
- Probability: Not established by the available evidence. -
Scenario Analysis (🔄):
| Scenario | Probability | Target | Trigger |
|---|---|---|---|
| Bull | Not established by the available evidence. | Not established by the available evidence. | Daily oversold conditions hold and mark a monthly higher low; bulls prove something by regaining an hourly uptrend and breaking the daily stair-step down, or a capitulatory superstack with historic RSI levels. |
| Base | Not established by the available evidence. | Not established by the available evidence. | Rotation returns: XLF/XLV pause while tech/semiconductors bounce from daily oversold, leading to temporary topping in defensives as the broader indices consolidate. |
| Bear | Not established by the available evidence. | Not established by the available evidence. | S&P 500 follows through with monthly consolidation by breaking below current support; loss of daily oversold levels in QQQ/SMH sends them to monthly 12 EMA and previous all-time highs; unified downside continues without rotation. | -
Risk Factors (⚠️):
- Chart discrepancy between SPY, S&P index, and futures reduces confidence in levels.
- Continued lack of sector rotation could lead to sharper and more sustained pullbacks.
- South Korean liquidation and overleveraged market environment increases the risk of further sudden downside.
- 30-year yield sustaining new highs would provide a persistent headwind to equities.
- Joey explicitly warns against fighting the market; the creator notes that many participants are overleveraged and a 50% drawdown was a personal past experience. -
Actionable Trading/Allocation Plan (🎯):
- Monitor whether all three main S&P charts (SPY, index, futures) can fully break their support levels simultaneously.
- Watch for hourly lower highs to print tomorrow; a bounce that stays below the FOMC high reaction would confirm continued bearish hourly structure.
- Track daily oversold levels: NQ at 26960, QQQ at 65155, SMH at 48096; verify if those levels hold or fail.
- Observe Cosby for a bottom at monthly 12 EMA, which would likely coincide with a bottom in NASDAQ and semiconductor names.
- Check the 2-day 12 EMA on the Bitcoin/Nasdaq ratio for a rejection that would end Bitcoin's relative strength.
- Watch the 30-year yield for follow-through on new highs; lack of follow-through would reduce headwind.
- Verify if XLF and XLV can hold their daily 12 EMA as support; if they lose it, bears open the door to a broader downturn.
- Note the month-end close on Friday; a break of June monthly candle lows in July would confirm monthly consolidation for the S&P 500.
-
Creator Horizon Category (⏱️): Short-Term Technical — The video is published as a live reaction to the FOMC rate decision and Warsh press conference, focusing on immediate market price action for futures and options traders.
-
One-Line Thesis (💡): Trade Brigade livestreams market reaction to the FOMC rate decision and Warsh press conference, providing pre-market technical analysis for futures and options traders without stating a specific directional thesis in the metadata.
-
Key Data Points (📊):
- Title: "[LIVE] FOMC Rate Decision & Warsh Press Conference – Live Market Reaction"
- Description: "We are live every trading day at 8:00 AM EST providing the best pre market technical analysis for futures traders and options traders." -
Technical Levels & Setups OR Macro Drivers (📌):
- FOMC rate decision as the primary catalyst for market reaction.
- Warsh press conference as a potential source of policy signals affecting market volatility.
- Live technical analysis applied to futures and options in pre-market conditions. -
Risk/Reward Framework (⚖️):
- Entry: Not established by the available evidence.
- Stop: Not established by the available evidence.
- Targets: Not established by the available evidence.
- Risk/Reward: Not established by the available evidence.
- Position Size: Not established by the available evidence.
- Probability: Not established by the available evidence. -
Scenario Analysis (🔄):
| Scenario | Probability | Target | Trigger |
|---|---|---|---|
| Bull | Not established by the available evidence. | Not established by the available evidence. | FOMC statement or Warsh comments interpreted as dovish by the market, prompting immediate buying in futures. |
| Base | Not established by the available evidence. | Not established by the available evidence. | FOMC decision and press conference produce no surprise, with market consolidating within pre-established technical levels. |
| Bear | Not established by the available evidence. | Not established by the available evidence. | FOMC announcement or Warsh remarks perceived as hawkish, triggering selling pressure in futures and options. | -
Risk Factors (⚠️):
- The video is a livestream with no recorded content; the actual analysis, levels, and creator's risk parameters are absent from the metadata.
- No specific tickers, price levels, probabilities, or position sizes are provided in the evidence.
- The disclaimer explicitly states the information is not financial advice and that the creator is not a Registered Investment Advisor. -
Actionable Trading/Allocation Plan (🎯):
- Access the recorded or archived version of the livestream to extract the creator's specific technical levels, setups, and trade parameters.
- Cross-reference FOMC decision and Warsh press conference transcripts with market reaction data to verify the creator's analysis.
- Monitor the Trade Brigade website or newsletter for follow-up posts detailing the trade setups discussed during the live stream.
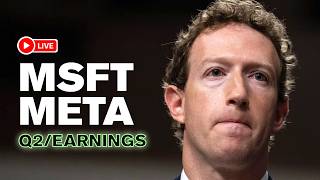
-
Creator Horizon Category (⏱️): Short-Term Technical — The video is a live pre-market technical analysis stream covering Q2 2026 earnings for Microsoft and Meta, focusing on intraday and near-term price action.
-
One-Line Thesis (💡): The creator does not state a singular thesis; the video is a live earnings coverage session without pre-recorded analysis or a specific directional call.
-
Key Data Points (📊):
- Title: '[LIVE] MICROSOFT & META – Q2 2026 Earnings Live'
- Description refers to a 'Live Squawk' link
- Description promotes a 'Technical Analysis Course'
- Description promotes 'Trading Scripts'
- Description includes affiliate offer for TradeZella (20% off with code 'TB')
- Stream is scheduled for every trading day at 8:00 AM EST -
Technical Levels & Setups OR Macro Drivers (📌):
- The creator is covering Q2 2026 earnings reports for Microsoft (MSFT) and Meta Platforms (META) live
- The creator focuses on pre-market technical analysis for futures and options traders -
Risk/Reward Framework (⚖️):
- Entry: Not established by the available evidence.
- Stop: Not established by the available evidence.
- Targets: Not established by the available evidence.
- Risk/Reward: Not established by the available evidence.
- Position Size: Not established by the available evidence.
- Probability: Not established by the available evidence. -
Scenario Analysis (🔄):
| Scenario | Probability | Target | Trigger |
|---|---|---|---|
| Bull | Not established by the available evidence. | Not established by the available evidence. | The creator can only be observed reacting to earnings results live; no pre-set bull trigger is stated in available evidence. |
| Base | Not established by the available evidence. | Not established by the available evidence. | The creator can only be observed reacting to earnings results live; no pre-set base trigger is stated in available evidence. |
| Bear | Not established by the available evidence. | Not established by the available evidence. | The creator can only be observed reacting to earnings results live; no pre-set bear trigger is stated in available evidence. | -
Risk Factors (⚠️):
- The video is a live stream with no fixed content; any levels or setups mentioned may be spontaneous and not pre-defined
- The creator's stated disclaimer clarifies they are not a Registered Investment Advisor and the content is for informational purposes only
- No specific tickers, price levels, valuation figures, or trade parameters are contained in the metadata-provided evidence -
Actionable Trading/Allocation Plan (🎯):
- View the full video to extract any trade setups, levels, or catalysts stated by the creator during the live earnings coverage
- Retrieve MSFT and META Q2 2026 earnings reports and compare any creator comments to official press releases and financial data
- Cross-check any technical levels mentioned in the stream against independent charting tools to verify

-
Creator Horizon Category (⏱️): Long-Horizon Macro / Structural — The episode discusses long-term portfolio strategy, momentum factor rules, and multi-year inheritance planning.
-
One-Line Thesis (💡): Ben Carlson and Josh Brown argue that a rules-based momentum sleeve (Porterhouse) is a rational complement to a diversified long-term portfolio because it systematizes trades that individual advisors cannot bring themselves to execute, and that advice to reduce equity holdings should be driven by client-specific goal progress, not macro bearishness.
-
Key Data Points (📊):
- Shake Shack market cap: $2 billion (Josh Brown) — described as one of the smallest companies in his portfolio.
- Shake Shack Q1 2026 revenue: $366 million actual vs. $372 million expected.
- Shake Shack year-over-year revenue growth: 14.5%.
- Shake Shack Q1 2026 operating loss: $2.6 million (stated as "2.6 6 billion" — likely meant $2.6 million).
- Shake Shack cash flow decline: 9.3% year-over-year.
- Food and paper costs as percentage of sales rose to 28.3% from 27.8%.
- Shake Shack widened full-year EBITDA guidance (direction unspecified).
- Second guidance cut 26 days later: revenue guidance taken down, same-shack sales taken down.
- Shake Shack still guiding to open 60–65 company-operated stores in 2026.
- Long-term unit CAGR target: 15% over the next ten years.
- Porterhouse portfolio: 40–60 stocks, rules-based momentum, first accounts traded were Josh Brown's own money and other RWM partners' money.
- Portfolio rebalanced monthly — example: sold Corning (GLW) because it no longer met momentum criteria.
- Market cap of Porterhouse stocks implicitly described as typically large/mega-cap (Nvidia, Apple mentioned as 10% of S&P 500).
- Estate size in question: over $20 million held in trust with mother as controller; questioner is in his 30s. -
Technical Levels & Setups OR Macro Drivers (📌):
- Shake Shack earnings catalyst: next earnings call August 5 (2026).
- Shake Shack specific cost input: beef reached $6.75 per pound in January 2026.
- Shake Shack CEO Rob Lynch — recruited from Papa John's turnaround — has not yet earned market trust.
- Shake Shack new store opening in Grand Rapids, Michigan in 2027 near RWM office.
- Porterhouse's momentum rule triggers: buy stocks that have gone up the most; sell discipline is predetermined, systematic.
- Porterhouse purpose: allows advisors to outsource trades they cannot psychologically execute (e.g., buying after large gains).
- General premise: advisors should reduce equity allocations when client's portfolio is overfunded relative to original goals — not based on macro bearishness. -
Risk/Reward Framework (⚖️):
- Entry: Not established by the available evidence.
- Stop: Not established by the available evidence.
- Targets: Not established by the available evidence.
- Risk/Reward: Not established by the available evidence.
- Position Size: Not established by the available evidence.
- Probability: Not established by the available evidence. -
Scenario Analysis (🔄):
| Scenario | Probability | Target | Trigger |
|---|---|---|---|
| Base | Not established by the available evidence. | Not established by the available evidence. | Josh Brown will hold Shake Shack regardless of near-term pain; sees long-term growth story intact if company demonstrates it is tackling cost spikes (paper, beef) and regains market trust on August 5 call. |
| Bear | Not established by the available evidence. | Not established by the available evidence. | Shake Shack continues to report surprise losses, fails to show it can stabilize food/paper costs, and the street's trust erodes further. | -
Risk Factors (⚠️):
- Shake Shack: trading at a 90% drawdown from highs (implied), with no price floor established.
- Shake Shack: street has lost premium multiple due to lack of trust in management's control over costs.
- Shake Shack: Middle East licensing revenue potentially impacted by geopolitical events (Strait of Hormuz).
- Porterhouse: momentum can underperform for stretches; portfolio construction requires clients to accept that some trades will look foolish in hindsight.
- General: any equity-heavy allocation assumes society and corporate growth continue — collapse scenario invalidates all long-term bullish assumptions.
- Inheritance case: uncertainty around trust terms (distribution dates, beneficiaries) creates planning risk; emotional ties to deceased make financial decisions psychologically fraught. -
Actionable Trading/Allocation Plan (🎯):
- Monitor Shake Shack's next earnings call (August 5) for management's plan to address paper/beef cost spikes and same-shack sales trajectory.
- Verify Shake Shack's unit growth: actual store count vs. guided 60–65 new stores and 15% CAGR target over a decade.
- Porterhouse: track monthly rebalance trades to see if the strategy systematically buys after large gains and sells after signs of slowdown.
- For any client with a portfolio that has significantly outperformed goals, evaluate with the advisor whether it is appropriate to de-risk toward a lower equity allocation.
- For an expected inheritance: obtain a copy of the trust document, confirm beneficiary designations, distribution dates, and any time-based vesting rules.
- Hold a family meeting (with mother and siblings) and include the estate/trust attorney to clarify the trust's provisions before external variables (e.g., a new relationship) change the conversation.

-
Creator Horizon Category (⏱️): Other — The creator addresses a universal psychological and behavioral pattern (recovery after losses) rather than a specific timeframe or trade setup.
-
One-Line Thesis (💡): The creator argues that after a losing streak, a trader can rebuild confidence by physically disengaging from screens and digital inputs, and by reframing trading as a game with non-financial priorities.
-
Key Data Points (📊):
- Creator's psychological recommendation: 'Get off the computer. Get off of social media. Get off of the charts. Close your account and go into nature.'
- Creator's personal reminder: 'there are so many more important things in this world than the numbers that are in my account.'
- Creator frames trading as a game: 'This trading thing is is a game. It's a game that has significant implications in my financial life, but it's a game and there's so much more that is important.' -
Technical Levels & Setups OR Macro Drivers (📌):
- Psychological self-regulation after a losing streak — the creator advises stepping away from all digital trading tools to break a negative downward spiral. -
Risk/Reward Framework (⚖️):
- Entry: Not established by the available evidence.
- Stop: Not established by the available evidence.
- Targets: Not established by the available evidence.
- Risk/Reward: Not established by the available evidence.
- Position Size: Not established by the available evidence.
- Probability: Not established by the available evidence. -
Scenario Analysis (🔄):
| Scenario | Probability | Target | Trigger |
|---|---|---|---|
| Bull | Not established by the available evidence. | Not established by the available evidence. | A trader who follows the creator's advice (disconnect, nature, perspective) may regain confidence and avoid further emotional losses. |
| Base | Not established by the available evidence. | Not established by the available evidence. | No specific base-case scenario is described in the evidence. |
| Bear | Not established by the available evidence. | Not established by the available evidence. | If the trader remains in a negative downward spiral without disconnecting, the creator implies that performance may continue to deteriorate. | -
Risk Factors (⚠️):
- The creator offers no backtested, empirical, or quantitative support for the advice; it is purely anecdotal and psychological.
- The advice is untethered to any specific market condition, ticker, or strategy, making it impossible to verify through price data.
- The claim that stepping away and reframing priorities will restore confidence cannot be independently validated without subjective self-reporting. -
Actionable Trading/Allocation Plan (🎯):
- Monitor any subsequent creator video for specific rules or triggers that define when to step away and when to re-engage with trading.
- Seek independent academic or clinical research on the efficacy of nature exposure and digital detox for post-loss psychological recovery in traders.
- Compare the creator's psychological framework to established trading psychology literature (e.g., Steenbarger, Tuckman) to assess alignment.

-
Creator Horizon Category (⏱️): Long-Horizon Macro — The episode centers on late-cycle broadening, persistent inflation risks from fiscal dominance, and structural shifts in private markets and consumer balance sheets.
-
One-Line Thesis (💡): The creator argues that the market's broadening out into consumer staples and the steep selloff in semiconductor/AI momentum names is healthy and consistent with late-cycle behavior, while the consensus bearishness on bonds presents a contrarian opportunity because the worst of the price damage is likely behind us.
-
Key Data Points (📊):
- Semiconductors down 4% on the day; software (anti–AI semi) up 3.3% — an outlier day not seen since 1989.
- Micron down 27%, Western Digital down 34%, SanDisk down 46%, Seagate down 26% from highs.
- SanDisk still up 2,900% over the last year despite a 46% drawdown.
- iShares Momentum Factor ETF (MTUM) went from down ~10% YTD in April to up ~40% by late July, then back to +20% YTD in the last month.
- Average IPO 12 months after listing is down 30%; SpaceX down 14 of 18 trading days in July, down ~45% from highs.
- 5-year total return for the Bloomberg Aggregate Bond Index is essentially zero; 7–10 year Treasuries have lost ~8%; long-term bonds are down ~33%.
- 45 million U.S. households have annual outlays of ~$15 trillion, equal to ~70% of Chinese GDP.
- American Express reported U.S. consumer spending up 11% (highest since Q1 2018); travel & entertainment up 30% YoY; Gen Z spending up 40% YoY.
- Google (Alphabet) reported negative free cash flow for the first time ever; cloud revenue up 82% YoY; stock down ~18% post-earnings.
- S&P 500 EPS guidance momentum score at highest level on record.
- Capital One: U.S. consumer remains resilient despite high energy prices; unemployment rate lower than before tariff conflict.
- Visa report: 75% of the ~$90 trillion wealth transfer expected to go to the top 10%; $28 trillion of the $36 trillion passed down will be saved, not spent.
- Netflix original programming accounts for 57% of all streaming original viewing; next closest is Prime Video at 11%.
- IMAX's The Odyssey grossed $140M globally in 10 days, 73% ahead of Oppenheimer at the same point.
- Tony and Dena Isola retirement story: 'Your money is growing and your time is shrinking.' -
Technical Levels & Setups OR Macro Drivers (📌):
- Selloff in AI/semiconductor momentum names coinciding with a rally in consumer staples reflects late-cycle broadening.
- Credit spreads widening (especially lower quality) — not alarming but worth monitoring.
- Google’s CFO stated the company is in a 'supply constrained environment' and will continue aggressive capex despite negative free cash flow.
- Blackstone rolling out private market funds with Vanguard, aiming to eventually include them in target-date funds.
- Fed hiking possibility discussed (Neil D. called for a hike), though creator dismisses it as unlikely.
- Rising bond yields and fiscal dominance narrative cited by Yuri Timmer and Mitch Staple as key risks. -
Risk/Reward Framework (⚖️):
- Entry: Not established by the available evidence.
- Stop: Not established by the available evidence.
- Targets: Not established by the available evidence.
- Risk/Reward: Not established by the available evidence.
- Position Size: Not established by the available evidence.
- Probability: Not established by the available evidence. -
Scenario Analysis (🔄):
| Scenario | Probability | Target | Trigger |
|---|---|---|---|
| Bull | Not established by the available evidence. | Not established by the available evidence. | Earnings guidance continues to rise (S&P 500 EPS guidance momentum at highs); broadening continues; credit spreads tighten; bonds rally as recession risk emerges, invalidating the consensus bearish bond view. |
| Base | Not established by the available evidence. | Not established by the available evidence. | Late-cycle behavior persists: consumer staples outperform, AI/semi momentum continues to correct, but S&P 500 holds near highs; growth slows but no recession; bond yields remain elevated but not materially higher. |
| Bear | Not established by the available evidence. | Not established by the available evidence. | Verify the trigger against the source evidence. | -
Risk Factors (⚠️):
- Creator’s framing of 'good news' in semi selloff may understate contagion risk if AI infrastructure spending disappoints earnings.
- Late-cycle broadening could be a precursor to recession, not a healthy rotation.
- Consensus bearishness on bonds may be correct if inflation remains sticky and fiscal deficits stay large.
- Consumer strength may be concentrated at the top (AMEX data skewed to high-end spenders); lower-income consumer fragility not addressed.
- Private market illiquidity risks (e.g., Blackstone, Blue) could resurface if redemptions spike again.
- The 'Rasputin' market analogy suggests complacency; creator acknowledges this is the ninth inning extended for 12 years. -
Actionable Trading/Allocation Plan (🎯):
- Monitor S&P 500 forward P/E and EPS guidance momentum score weekly to see if falling valuations are sustained by earnings beats or downward estimate revisions.
- Track MTUM (iShares Momentum Factor ETF) and semiconductor ETF flows to assess whether the momentum unwind broadens or stabilizes.
- Watch 10-year Treasury yield and credit spreads (especially high-yield) for confirmation of the 'late cycle' thesis or reversal.
- Follow Google/Alphabet capex commentary and free cash flow trends each quarter as a bellwether for hyperscaler spend discipline.
- Verify American Express and Capital One commentary on consumer spending via their next quarterly filings to confirm persistence.

-
Creator Horizon Category (⏱️): Long-Horizon Macro — All three robotics CEOs address multi-year deployment horizons, with 1X CEO stating 'hard takeoff' in under 10 years, likely 3 years.
-
One-Line Thesis (💡): The All-In Podcast interviews with three robotics CEOs (Anybotics, 1X, Boston Dynamics, Agility Robotics) converge on a thesis that humanoid and quadruped robots are moving from research to industrial deployment, with cost per hour approaching single digits versus human labor at $20-40/hour, but all three executives express concerns about Chinese competition, data sovereignty, and weaponization risks.
-
Key Data Points (📊):
- Anybotics ENM robot "low hundreds of thousands of dollars" to buy, "tens of thousands a year" service contracts.
- Anybotics robots operate 2 hours per mission, 40 missions per day, customer runs missions "40 times a day".
- Anybotics CEO: "0%" sourced from China.
- 1X Neo CEO: "not giving out official numbers" but pre-orders "significant", shipped in 2026.
- Boston Dynamics Spot: $100,000 base to $300,000 fully loaded, with 5+ year lifespan, mean time between intervention 3,000+ hours.
- Boston Dynamics Spot: battery 90 minutes, charging dock; Atlas has swappable batteries, robot swaps itself.
- Boston Dynamics Spot: "over 500 customers over 46 countries".
- Agility Robotics Digit: "tens of thousands of dollars" bill of materials, 20 hours/day, 365 days/year.
- Agility Robotics Digit V5: first humanoid that "does not need a physical barrier" between robot and person in warehouse.
- Agility Robotics CEO: robot cost per hour "set by human labor" at $20-$40/hour in Western Hemisphere factories.
- 1X CEO: hard takeoff "under 10 years", current bet "3 years" for robots building robots, data centers, chip fabs.
- Anybotics CEO on Chinese competition: "they're not solving the problem" – the full solution includes autonomy, inspection, workflow integration, trust, ISO cybersecurity certification.
- Boston Dynamics CEO: "under any circumstances, should we allow humanoid robotics from China in the United States? No. It's not safe." -
Technical Levels & Setups OR Macro Drivers (📌):
- Industrial inspection use case driving immediate ROI for quadruped robots (Anybotics, Boston Dynamics Spot) – avoiding downtime that costs "hundreds of thousands per hour".
- 1X CEO's bet that robot form factor must be human-like to leverage internet video data for pretraining world models.
- Agility Robotics CEO's claim that LLMs solved perception, but robot control data does not exist on the internet and must be generated via teleoperation and simulation.
- All three CEOs cite dull, dirty, dangerous (3Ds) tasks as primary driver for adoption.
- CEO consensus that Chinese robotics hardware is advancing (backflips, walking), but lacks full solution (autonomy, integration, trust, data security). -
Risk/Reward Framework (⚖️):
- Entry: Not established by the available evidence.
- Stop: Not established by the available evidence.
- Targets: Not established by the available evidence.
- Risk/Reward: Not established by the available evidence.
- Position Size: Not established by the available evidence.
- Probability: Not established by the available evidence. -
Scenario Analysis (🔄):
| Scenario | Probability | Target | Trigger |
|---|---|---|---|
| Bull | Not established by the available evidence. | Not established by the available evidence. | 1X CEO's claim that Neo will ship in 2026 with near-full autonomy and that hard takeoff (robots building robots) occurs in 3 years. |
| Base | Not established by the available evidence. | Not established by the available evidence. | Verify the trigger against the source evidence. |
| Bear | Not established by the available evidence. | Not established by the available evidence. | Chinese robotics companies undercut Western solutions by 80%, or data leakage from Chinese robots in critical infrastructure leads to regulatory bans and loss of trust, as cited by Boston Dynamics and Anybotics CEOs. | -
Risk Factors (⚠️):
- Anybotics CEO acknowledges robot is not yet 99.9% reliable in explosive atmospheres for repair tasks.
- 1X CEO admits that ships in 2026 will be "rough around the edges" and "fall" – teleoperation may be required.
- Agility Robotics CEO warns that sim-to-real gap remains large; real-world practice is necessary.
- Boston Dynamics CEO notes that Atlas military applications are a "distraction" and that the company has an "anti-weaponization stance" but acknowledges China is building armed quadrupeds.
- All three CEOs cite potential IP theft by China; Boston Dynamics CEO explicitly says data leakage already occurring with Chinese quadrupeds in the US.
- No evidence of any company's profitability or unit economics beyond anecdotal customer ROI examples (e.g., cookware brand from $4M to $16M).
- No evidence of specific tickers, position sizes, entry/stop levels, probabilities, or risk/reward ratios for any publicly traded company. -
Actionable Trading/Allocation Plan (🎯):
- Monitor 1X Neo shipping in 2026 and the actual autonomy level achieved vs. CEO claims.
- Track Boston Dynamics Spot and Atlas deployment numbers and customer count growth beyond the stated 500 customers/46 countries.
- Verify Agility Robotics Digit V5 safety claims (no physical barrier) in Amazon or Target warehouses.
- Monitor any regulatory actions from US or EU regarding Chinese robotics in critical infrastructure.
- Track any hard takeoff milestones: robots building robots, data centers, or chip fabs within 3-10 years.
- Collect evidence on the cookware brand's financial trajectory ($4M to $16M, on pace for $80M) to independently verify ROI claims.

-
Creator Horizon Category (⏱️): Short-Term Technical — The evidence supports this horizon classification.
-
One-Line Thesis (💡): The creator is providing live commentary and trading during the Fed FOMC decision and Kevin Warsh's press conference on July 29, emphasizing the event's immediate market impact, but no specific directional trade thesis is articulated beyond reacting to the event in real time.
-
Key Data Points (📊):
- Kevin Warsh press conference scheduled for 2:30PM EST on July 29
- Creator states trading on three platforms: Etrade pro (screen shown), ThinkOrSwim (long term investing), Fidelity (long term)
- Option trading is described as really risky with a warning that copying trades will more than likely result in losing money
- Description references a Nightly Watchlist and a separate 'How to make the long term' video
- Disclaimer states nothing in the video should be construed as financial advice or a recommendation to buy or sell any security -
Technical Levels & Setups OR Macro Drivers (📌):
- The FOMC interest rate decision and forward guidance are the primary macro catalyst for the session
- Kevin Warsh's press conference language and tone are the key intraday event risk
- Creator indicates they will be in 'the zone trading' and may not respond to chat questions, suggesting a fast-paced, event-driven trading setup -
Risk/Reward Framework (⚖️):
- Entry: Not established by the available evidence.
- Stop: Not established by the available evidence.
- Targets: Not established by the available evidence.
- Risk/Reward: Not established by the available evidence.
- Position Size: Not established by the available evidence.
- Probability: Not established by the available evidence. -
Scenario Analysis (🔄):
| Scenario | Probability | Target | Trigger |
|---|---|---|---|
| Bull | Not established by the available evidence. | Not established by the available evidence. | Dovish FOMC statement or Kevin Warsh comments signaling accommodative policy, leading to broad market upside |
| Base | Not established by the available evidence. | Not established by the available evidence. | FOMC holds rates steady with balanced language causing range-bound or choppy market conditions |
| Bear | Not established by the available evidence. | Not established by the available evidence. | Hawkish surprise from the FOMC or Kevin Warsh signaling tighter policy, leading to broad market sell-off | -
Risk Factors (⚠️):
- No specific tickers, levels, or trade parameters are disclosed, making analysis non-reproducible
- Creator explicitly warns viewers not to copy trades and states options trading is risky with potential for total loss
- The livestream format means the creator's positions and commentary are reactive and not pre-planned, limiting structured analysis
- No evidence of the creator's actual trade execution, P&L, or risk management metrics is provided -
Actionable Trading/Allocation Plan (🎯):
- Monitor the official FOMC statement and Kevin Warsh's press conference transcript for exact policy wording and economic projections
- Cross-reference the creator's trading platforms (Etrade pro, ThinkOrSwim, Fidelity) disclosure against common brokerage capabilities to assess credibility of multi-platform trading claim
- Review the separate 'Nightly Watchlist' and 'How to make the long term' videos referenced in the description for any additional trade ideas or long-term portfolio context
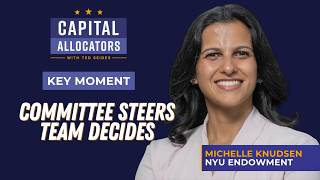
-
Creator Horizon Category (⏱️): Long-Horizon Macro / Structural — The creator describes a multi-month process to redesign governance, asset allocation, and portfolio re-underwriting, establishing a framework intended to persist across market cycles.
-
One-Line Thesis (💡): The endowment's new governance structure delegates manager selection to the investment team below a 3% threshold, above which the investment committee must approve allocations because a manager that size becomes a significant nexus of risk.
-
Key Data Points (📊):
- 3% — the threshold at which a manager's allocation becomes a significant nexus of risk and requires committee buy-in
- 3% — the level set by the creator as the threshold for committee approval on manager allocations
- within 3 months — the time frame in which a new governance structure, a new asset allocation framework, and triage/re-underwriting of every portfolio line item were completed -
Technical Levels & Setups OR Macro Drivers (📌):
- The committee is heavily involved in setting endowment direction, risk levels, and frameworks for co-investment portfolios or secondary sales.
- Manager selection decisions rest with the investment team up to the 3% threshold, after which the committee's buy-in is required. -
Risk/Reward Framework (⚖️):
- Entry: Not established by the available evidence.
- Stop: Not established by the available evidence.
- Targets: Not established by the available evidence.
- Risk/Reward: Not established by the available evidence.
- Position Size: Not established by the available evidence.
- Probability: Not established by the available evidence. -
Scenario Analysis (🔄):
| Scenario | Probability | Target | Trigger |
|---|---|---|---|
| Bull | Not established by the available evidence. | Not established by the available evidence. | Committee defers to the team's judgment after asking pressure-testing questions, as happened in a small handful of instances at NYU. |
| Base | Not established by the available evidence. | Not established by the available evidence. | The creator over-prepares, absorbs information, and hustles to gain confidence from the committee and team, leading to a medium-term plan within three months. |
| Bear | Not established by the available evidence. | Not established by the available evidence. | The evidence does not mention a bear trigger; creator states the committee has been very supportive and no one is scared to bring borderline allocations to the committee. | -
Risk Factors (⚠️):
- The 3% threshold is described as arbitrary by the interviewer and may not be a universal best practice.
- No specific performance or risk data for managers above the threshold is provided to verify the 'nexus of risk' claim.
- The evidence does not cover market conditions, drawdowns, or liquidity scenarios that could test the governance structure. -
Actionable Trading/Allocation Plan (🎯):
- Verify whether the endowment's 3% threshold is documented in public filings or investment committee minutes.
- Monitor whether the creator discloses any specific example of a manager that approached the threshold and how the committee's pressure testing changed the allocation.
- Cross-check the claim that a new asset allocation framework was completed within 3 months against any subsequent public portfolio updates from NYU.
-
Creator Horizon Category (⏱️): Short-Term Technical — The title explicitly asks about an 'oversold bounce' ahead of an FOMC decision, indicating a short-term technical trading horizon.
-
One-Line Thesis (💡): The creator suggests the market may be due for an oversold bounce in the pre-FOMC session, with technical analysis as the primary input.
-
Key Data Points (📊):
- Title includes '[LIVE] Pre-Market Prep – FOMC Today!' – indicates the Federal Open Market Committee meeting is the key event catalyst.
- Title asks 'Oversold bounce coming?' – implies a potential short-term countertrend rally is being evaluated.
- Channel description states the show provides 'pre market technical analysis for futures traders and options traders.' -
Technical Levels & Setups OR Macro Drivers (📌):
- FOMC decision day as the primary macro catalyst – any rate decision, dot plot, or statement could alter short-term price action. -
Risk/Reward Framework (⚖️):
- Entry: Not established by the available evidence.
- Stop: Not established by the available evidence.
- Targets: Not established by the available evidence.
- Risk/Reward: Not established by the available evidence.
- Position Size: Not established by the available evidence.
- Probability: Not established by the available evidence. -
Scenario Analysis (🔄):
| Scenario | Probability | Target | Trigger |
|---|---|---|---|
| Bull | Not established by the available evidence. | Not established by the available evidence. | Oversold bounce materializes if pre-market technical indicators show buying pressure or the FOMC delivers a dovish surprise. |
| Base | Not established by the available evidence. | Not established by the available evidence. | Market remains range-bound as traders wait for the FOMC announcement, failing to follow through on a bounce. |
| Bear | Not established by the available evidence. | Not established by the available evidence. | Oversold condition fails and selling resumes if the FOMC surprises hawkishly or pre-market futures break key support. | -
Risk Factors (⚠️):
- FOMC outcome is inherently unpredictable – even if the market appears oversold, a surprise decision can invalidate a bounce setup.
- No specific tickers, levels, or indicators are provided in the available evidence, making quantitative verification impossible.
- The title is framed as a question, indicating the creator is not certain about the direction, which carries a high risk of being wrong regardless of outcome. -
Actionable Trading/Allocation Plan (🎯):
- Verify if the creator's pre-market technical analysis identified any specific oversold indicator (e.g., RSI, stochastic) for futures indices during the live stream.
- Monitor the actual FOMC statement and dot plot release against the timestamp of the video to assess whether the proposed oversold bounce was triggered or invalidated.

-
Creator Horizon Category (⏱️): Short-Term Technical — The creator explicitly frames the upcoming two nights as the most important statistical and emotional week of earnings season, focusing on immediate after-hours reports from four mega-cap tech companies.
-
One-Line Thesis (💡): The creator asserts that the next two nights of earnings from Microsoft, Meta, Apple, and Amazon constitute the most important week statistically and emotionally for earnings season, and that management commentary from these reports may matter as much as the numbers themselves for the broader market.
-
Key Data Points (📊):
- Two nights of earnings: Microsoft and Meta report tomorrow after close; Apple and Amazon report the following night (Thursday) after close.
- Four of the biggest companies in the world are reporting: Microsoft, Meta, Apple, Amazon. -
Technical Levels & Setups OR Macro Drivers (📌):
- The most important week statistically and perhaps emotionally for earnings season is being driven by the simultaneous reports of four mega-cap technology companies.
- Management commentary from Microsoft, Meta, Apple, and Amazon is cited by the creator as potentially as important as the numerical results for the rest of the overall market. -
Risk/Reward Framework (⚖️):
- Entry: Not established by the available evidence.
- Stop: Not established by the available evidence.
- Targets: Not established by the available evidence.
- Risk/Reward: Not established by the available evidence.
- Position Size: Not established by the available evidence.
- Probability: Not established by the available evidence. -
Scenario Analysis (🔄):
| Scenario | Probability | Target | Trigger |
|---|---|---|---|
| Base | Not established by the available evidence. | Not established by the available evidence. | Verify the trigger against the source evidence. |
| Bear | Not established by the available evidence. | Not established by the available evidence. | If management commentary from Microsoft, Meta, Apple, or Amazon is negative, the creator suggests it could meaningfully affect the rest of the overall market, though no specific bearish threshold is given. |
| Bull | Not established by the available evidence. | Not established by the available evidence. | If management commentary is positive, it may serve as a catalyst for broader market sentiment; no specific bullish trigger is provided. | -
Risk Factors (⚠️):
- The creator states that commentary from these earnings may matter just as much as the numbers, but does not quantify how to differentiate material commentary from noise.
- No specific valuation levels, price targets, or earnings estimates are cited, leaving the analysis untethered from verifiable fundamentals.
- The creator does not disclose whether any positions are held in the mentioned tickers, creating potential undisclosed bias. -
Actionable Trading/Allocation Plan (🎯):
- Not established by the available evidence.
-
Creator Horizon Category (⏱️): Long-Horizon Macro — The creator frames the current market environment as a return to long-term historical averages, referencing GDP growth, inflation, bond yields, and annual equity returns over a multi-decade lens.
-
One-Line Thesis (💡): The creator claims that after an abnormally volatile decade, the current macro and market conditions—GDP growth 2-3%, inflation 3.5%, 10-year yield 4.5%, US stock market up 11% six months into the year—represent a return to historically normal averages, not extreme or unusual conditions.
-
Key Data Points (📊):
- GDP growth 2 to 3% — current level cited as normal.
- Inflation 3.5% — cited as right on the 100-year average of 3.5%.
- 10-year Treasury yield 4.5% — current level mentioned.
- US stock market up 11% in first six months of the year — current YTD return.
- Average up year for the US stock market is up 21% — historical benchmark cited. -
Technical Levels & Setups OR Macro Drivers (📌):
- Return to normalization after an abnormal decade is the overarching macro driver claimed.
- GDP growth in the 2-3% range supports a stable economic expansion.
- Inflation at the 100-year average of 3.5% is described as evidence of normalization, not overheating.
- 10-year yield at 4.5% is presented as consistent with historical norms.
- Year-to-date stock market gain of 11% is compared to the average up year of 21%, implying continued potential within normal bounds. -
Risk/Reward Framework (⚖️):
- Entry: Not established by the available evidence.
- Stop: Not established by the available evidence.
- Targets: Not established by the available evidence.
- Risk/Reward: Not established by the available evidence.
- Position Size: Not established by the available evidence.
- Probability: Not established by the available evidence. -
Scenario Analysis (🔄):
| Scenario | Probability | Target | Trigger |
|---|---|---|---|
| Bull | Not established by the available evidence. | Not established by the available evidence. | If the stock market continues to track toward its historical average up year of 21%, the current 11% YTD return suggests room for further gains within normal parameters. |
| Base | Not established by the available evidence. | Not established by the available evidence. | Conditions hold at GDP 2-3%, inflation near 3.5%, 10-year yield near 4.5%, and equity returns remain within the historical average range. |
| Bear | Not established by the available evidence. | Not established by the available evidence. | If inflation deviates significantly from the 100-year average of 3.5% or GDP growth falls outside the 2-3% band, the normalization thesis would break down. | -
Risk Factors (⚠️):
- The claim that the 100-year average inflation is exactly 3.5% is stated but not verified with a source; long-run average inflation figures can vary by methodology and time period.
- The creator does not account for potential structural changes (e.g., demographics, debt levels, technology) that could make historical averages less relevant.
- The comparison of 11% YTD return to a full-year average of 21% assumes no mean-reversion or reversal in the second half of the year.
- No specific tickers, sectors, or asset classes are mentioned, limiting granular risk assessment.
- The normalization thesis could be invalidated if current data points are revised or if forward-looking indicators diverge from recent readings. -
Actionable Trading/Allocation Plan (🎯):
- Verify the 100-year average U.S. inflation rate using official sources such as the Federal Reserve or Bureau of Labor Statistics to assess the claim of 3.5%.
- Monitor upcoming GDP, CPI, and 10-year yield releases for continued alignment with the stated ranges of 2-3%, 3.5%, and 4.5% respectively.
- Compare current forward P/E ratios or other valuation metrics against historical averages to cross-check the 'normal' market environment assertion.
-
Creator Horizon Category (⏱️): Long-Horizon Macro / Structural — The evidence discusses a licensing deal extending a deceased actor's likeness for use in interactive gaming, implying a long-term structural shift in digital rights management and entertainment partnerships.
-
One-Line Thesis (💡): The All-In Podcast claims that the estate of James Earl Jones licensed the Darth Vader voice to Disney for perpetual use, leading to a novel interactive integration in Fortnite via a partnership between the estate, Disney, and an unnamed AI voice company.
-
Key Data Points (📊):
- Estate of James Earl Jones licensed the Darth Vader voice to Disney for all time (creator claim, not independently verified).
- Fortnite launched Darth Vader as an interactive character that players could interact with live (creator claim, not independently verified).
- Interaction mode allows players after reaching a certain stage to have Darth Vader help solve missions (creator claim, not independently verified). -
Technical Levels & Setups OR Macro Drivers (📌):
- Licensing deal between deceased actor's estate and a major studio (Disney) for perpetuity.
- Use of AI voice technology to replicate a signature voice without a living impersonator.
- Gaming platform (Fortnite) as a new interactive use case for likeness extension. -
Risk/Reward Framework (⚖️):
- Entry: Not established by the available evidence.
- Stop: Not established by the available evidence.
- Targets: Not established by the available evidence.
- Risk/Reward: Not established by the available evidence.
- Position Size: Not established by the available evidence.
- Probability: Not established by the available evidence. -
Scenario Analysis (🔄):
| Scenario | Probability | Target | Trigger |
|---|---|---|---|
| Bull | Not established by the available evidence. | Not established by the available evidence. | If the licensing deal is confirmed as perpetual and revenue-generating for the estate, and Fortnite integration drives measurable engagement, the AI voice company could gain credibility and future contracts. |
| Base | Not established by the available evidence. | Not established by the available evidence. | If the details of the deal remain as described but without public financial terms, the narrative validates the trend of posthumous AI likeness licensing without immediate market-moving data. |
| Bear | Not established by the available evidence. | Not established by the available evidence. | If the estate or Disney dispute the terms or if the AI voice technology faces legal challenges over consent, the claimed model could be invalidated. | -
Risk Factors (⚠️):
- No primary source confirmation of the licensing deal between James Earl Jones' estate and Disney.
- No detailed financial terms provided: upfront payment, royalty structure, or duration.
- Unspecified which AI company performed the voice generation; no verification of their technology, contract, or revenue.
- Fortnite integration details are anecdotal; no evidence that the mode was interactive via AI rather than pre-recorded lines. -
Actionable Trading/Allocation Plan (🎯):
- Verify if the estate of James Earl Jones or Disney has publicly disclosed a perpetual licensing deal for the Darth Vader voice.
- Search for press releases or financial filings from Epic Games (Fortnite) regarding a specific Darth Vader interactive AI mode.
- Identify the AI voice company referenced by the All-In Podcast and locate its contracts, case studies, or partnership announcements with Disney.
- Monitor entertainment industry reports on posthumous AI likeness licensing to see if this specific deal is cited as a benchmark.
-
Creator Horizon Category (⏱️): Short-Term Technical — The creator frames the outcome of Google's earnings as determinative for the summer market direction, indicating a short-term event-driven horizon.
-
One-Line Thesis (💡): Google's earnings are the most determinative moment of earning season for whether the market will have a good summer or a bad summer, and a 10-15% S&P rally from here requires the AI trade to resume with Google as the central player.
-
Key Data Points (📊):
- Google's earnings are called 'the key to the market' and 'the most determinative moment of earning season' – Transcript-backed.
- Momentum tech stocks experienced selling and profit taking over the last month – Transcript-backed.
- Buying in Apple and Alphabet helped the S&P not fall apart during the tech sell-off – Transcript-backed.
- Financials and healthcare have held up better this summer – Transcript-backed.
- Hyperscalers are described as 'too big' to not participate for a 10-15% S&P gain – Transcript-backed.
- Microsoft and Meta (META) have lagged 'dramatically' and have room to catch up, though Google is not mentioned as lagging – Transcript-backed. -
Technical Levels & Setups OR Macro Drivers (📌):
- Google's earnings report as the immediate catalyst that can determine summer market trajectory – Transcript-backed.
- Rotation into Apple and Alphabet previously saved the S&P from a deeper sell-off when momentum tech was sold – Transcript-backed.
- Resumption of the AI trade, with Google as the most important publicly traded player, is necessary for further S&P gains of 10-15% – Transcript-backed.
- Underperformance of Microsoft and Meta provides potential catch-up upside if the hyperscaler group rallies – Transcript-backed. -
Risk/Reward Framework (⚖️):
- Entry: Not established by the available evidence.
- Stop: Not established by the available evidence.
- Targets: Not established by the available evidence.
- Risk/Reward: Not established by the available evidence.
- Position Size: Not established by the available evidence.
- Probability: Not established by the available evidence. -
Scenario Analysis (🔄):
| Scenario | Probability | Target | Trigger |
|---|---|---|---|
| Bull | Not established by the available evidence. | Not established by the available evidence. | Google's earnings ignite a renewed AI trade and hyperscalers (Microsoft, Meta, Google) participate in the rally. |
| Bear | Not established by the available evidence. | Not established by the available evidence. | Google's earnings fail to restart the AI trade, and momentum tech continues to sell off without sufficient support from other sectors. |
| Base | Not established by the available evidence. | Not established by the available evidence. | Google's earnings produce mixed results, no decisive breakout or breakdown; market remains range-bound with limited participation from hyperscalers. | -
Risk Factors (⚠️):
- Google's earnings may disappoint and fail to revive the AI trade, breaking the bullish thesis – Transcript-backed driver.
- The market's reliance on tech and hyperscalers means failure of those names to participate could cap or reverse S&P gains – Transcript-backed.
- Continued profit taking in momentum tech without sufficient rotation into other sectors could lead to broader weakness – Transcript-backed.
- Microsoft and Meta's prior underperformance may persist, preventing the catch-up rally that the creator implies is needed – Transcript-backed. -
Actionable Trading/Allocation Plan (🎯):
- Verify Google's actual earnings report and forward guidance against the creator's claim that it is determinative for the summer market.
- Track relative performance of Microsoft, Meta, and Google following the earnings event to confirm or contradict the catch-up thesis.
- Observe sector rotation by monitoring financials and healthcare performance relative to tech to gauge whether the market can hold without AI leadership.
-
Creator Horizon Category (⏱️): Other — The video title, description, and metadata contain no mention of specific market events, time frames, or technical horizons, only the sponsorship and standard channel disclaimers.
-
One-Line Thesis (💡): Not established by the available evidence. The metadata-only evidence provides no thesis, claim, or analysis from the creators regarding markets, securities, or economic conditions.
-
Key Data Points (📊):
- Episode sponsored by DBMF (the iMGP DBi Managed Futures Strategy ETF) — see prospectus link: http://www.imgp.com -
Technical Levels & Setups OR Macro Drivers (📌):
- Not established by the available evidence. -
Risk/Reward Framework (⚖️):
- Entry: Not established by the available evidence.
- Stop: Not established by the available evidence.
- Targets: Not established by the available evidence.
- Risk/Reward: Not established by the available evidence.
- Position Size: Not established by the available evidence.
- Probability: Not established by the available evidence. -
Scenario Analysis (🔄):
| Scenario | Probability | Target | Trigger |
|---|---|---|---|
| Unavailable | Not established by the available evidence. | Not established by the available evidence. | Verify source evidence. | -
Risk Factors (⚠️):
- The transcript or substantive monetary/ticker commentary is absent from the evidence; the available metadata contains only title, description, timestamps (all blank), and disclaimers.
- No specific securities, price levels, allocations, or probabilities are mentioned in the evidence. -
Actionable Trading/Allocation Plan (🎯):
- Obtain the full video transcript or closed captions to extract any actual claims, theses, or tickers discussed by Josh Brown and Michael Batnick.
- Review the Sponsor's prospectus (http://www.imgp.com) and the DBMF fund documentation to understand the underlying strategy if relevant to the episode's content.
- Verify the 'Mystery Chart' segment content (timestamp listed but no chart presented in metadata).

-
Creator Horizon Category (⏱️): Long-Horizon Macro / Structural — The discussion frames diversification and rebalancing as enduring structural responses to boom-bubble dynamics, citing European banks' low correlation and high payout as a current example.
-
One-Line Thesis (💡): The creator argues that during a boom, investors can balance FOMO and loss aversion by diversifying into non-correlated, high-payout sectors such as European banks, which offer compelling yield and growth without the concentration risk of mega-cap tech.
-
Key Data Points (📊):
- 60/40 could turn into a 90/10 if one side is booming and the other is not and you never rebalance.
- European banks are only 11% correlated to the Mag 7 (Mac 7).
- European banks have a payout ratio of 88%, a yield of 7%, and payout growth faster than the Mag 7.
- S&P financials have an 84% payout ratio and a 5% yield.
- Mega cap growth (Mag 7) was 'the only game in town' for 15 years until two years ago. -
Technical Levels & Setups OR Macro Drivers (📌):
- Rebalancing is presented as a mechanism to prevent a concentrated portfolio (e.g., 90/10) from suffering a disproportionately large drawdown during a 30% decline.
- European banks are cited as a sector that is currently one of the best assets, with low correlation to mega-cap tech and high payout ratios. -
Risk/Reward Framework (⚖️):
- Entry: Not established by the available evidence.
- Stop: Not established by the available evidence.
- Targets: Not established by the available evidence.
- Risk/Reward: Not established by the available evidence.
- Position Size: Not established by the available evidence.
- Probability: Not established by the available evidence. -
Scenario Analysis (🔄):
| Scenario | Probability | Target | Trigger |
|---|---|---|---|
| Bull | Not established by the available evidence. | Not established by the available evidence. | Continued outperformance of non-correlated high-payout sectors (e.g., European banks) while the Mag 7 boom persists or corrects moderately. |
| Base | Not established by the available evidence. | Not established by the available evidence. | Investors maintain a diversified portfolio with periodic rebalancing, capturing some gains from the boom while limiting drawdown risk. |
| Bear | Not established by the available evidence. | Not established by the available evidence. | A 30% decline hits a portfolio that has drifted to 90/10 due to failure to rebalance, producing a larger drawdown than a 60/40 allocation would have experienced. | -
Risk Factors (⚠️):
- The discussion of European banks is explicitly prefaced as not investment advice; the sector's correlation and payout ratios could change.
- The claim that 'mega cap growth was the only game in town for 15 years' is an oversimplification and may not account for periods of value or international outperformance.
- No specific time frame or catalyst is provided for the European bank thesis to materialize or reverse.
- Portfolio drift from 60/40 to 90/10 is presented as hypothetical, with no current portfolio allocation data cited. -
Actionable Trading/Allocation Plan (🎯):
- Monitor the stated 11% correlation between European banks (e.g., SX7E index) and the Mag 7 (e.g., NYSE FANG+ index) across rolling 90-day windows.
- Track the payout ratio and dividend yield of the European bank sector (using Bloomberg ticker SX7P or equivalent) quarterly to confirm the 88% payout and 7% yield figures.
-
Creator Horizon Category (⏱️): Short-Term Technical — The video is a pre-market technical analysis broadcast for futures and options traders, published on a trading day and referencing a 'memory trade coming unwound,' which implies an imminent intraday or short-term move.
-
One-Line Thesis (💡): Trade Brigade claims that markets are breaking down and a 'memory trade' (a trade that had previously worked due to repetitive patterns) is now unwinding, which is expected to create near-term directional opportunities for futures and options traders.
-
Key Data Points (📊):
- Live broadcast at 8:00 AM EST every trading day
- Video title includes 'Pre-Market Prep', 'Markets BREAKING Down' and 'Memory Trade Coming Unwound'
- Description references technical analysis course and trading scripts available via tradebrigade.co
- Channel focuses on 'pre market technical analysis for futures traders and options traders' -
Technical Levels & Setups OR Macro Drivers (📌):
- Claim: Markets are 'breaking down' as stated in the title.
- Claim: A 'memory trade' is coming unwound, implying the reversal of a previously reliable pattern-based trade.
- Pre-market live session format indicates the analysis is for the immediate trading day ahead. -
Risk/Reward Framework (⚖️):
- Entry: Not established by the available evidence.
- Stop: Not established by the available evidence.
- Targets: Not established by the available evidence.
- Risk/Reward: Not established by the available evidence.
- Position Size: Not established by the available evidence.
- Probability: Not established by the available evidence. -
Scenario Analysis (🔄):
| Scenario | Probability | Target | Trigger |
|---|---|---|---|
| Bull | Not established by the available evidence. | Not established by the available evidence. | The 'memory trade' unwinding completes and a new pattern of bullish continuation emerges, as might be assessed during the live session. |
| Base | Not established by the available evidence. | Not established by the available evidence. | The market consolidates in a range after the breakdown as the unwinding process plays out without clear directional follow-through. |
| Bear | Not established by the available evidence. | Not established by the available evidence. | The breakdown accelerates as the memory trade unwinds further, leading to sustained selling pressure. | -
Risk Factors (⚠️):
- The title's claim of 'markets breaking down' and 'memory trade coming unwound' is not backed by specific price levels, tickers, or data in the evidence provided.
- No invalidation criteria, stops, or probabilities are stated in the evidence.
- The evidence is metadata-only; the actual video content may contain conflicting or nuanced views not captured here.
- The analyst's directional thesis cannot be verified or falsified with the available evidence alone. -
Actionable Trading/Allocation Plan (🎯):
- Watch the full video to capture specific tickers, levels (support/resistance), and the exact definition of the 'memory trade' being referenced.
- Verify subsequent market structure changes in the following trading sessions to gauge the persistence of the claimed breakdown.

-
Creator Horizon Category (⏱️): Short-Term Technical — The stream is titled 'Korea Kollapse- JULY 28 - Stock Market LIVE, Live Trading' and the description references traders getting ready for near-term hyper-scaler earnings and the Fed decision, indicating a short-term intraday focus.
-
One-Line Thesis (💡): The creator claims that Korean chip stocks are selling off further as traders prepare for hyperscaler earnings and the Federal Reserve decision, with attention also on BA, UPS, and KO earnings in the morning.
-
Key Data Points (📊):
- Korean chip stocks are selling off further — stated as current market action.
- Traders getting ready for hyperscaler earnings and the Fed decision — stated as a catalyst.
- BA, UPS & KO Earnings in the morning — stated as upcoming earnings events.
- Trading platforms used: Etrade pro (screen shown), ThinkOrSwim (long term investing), Fidelity (long term) — stated by creator. -
Technical Levels & Setups OR Macro Drivers (📌):
- Selloff in Korean semiconductor stocks — claimed by creator as ongoing market action.
- Anticipation of hyperscaler earnings — identified as a near-term catalyst by the creator.
- Anticipation of the Federal Reserve decision — identified as a near-term catalyst by the creator.
- BA, UPS, and KO earnings results on the morning of July 28 — listed by the creator as upcoming events. -
Risk/Reward Framework (⚖️):
- Entry: Not established by the available evidence.
- Stop: Not established by the available evidence.
- Targets: Not established by the available evidence.
- Risk/Reward: Not established by the available evidence.
- Position Size: Not established by the available evidence.
- Probability: Not established by the available evidence. -
Scenario Analysis (🔄):
| Scenario | Probability | Target | Trigger |
|---|---|---|---|
| Bull | Not established by the available evidence. | Not established by the available evidence. | Positive hyperscaler earnings and/or dovish Fed decision reversing the Korean chip selloff — a logical inference from the creator's stated catalysts. |
| Base | Not established by the available evidence. | Not established by the available evidence. | Korean chip stocks continue to sell off as hyperscaler earnings and Fed decision produce mixed or expected results — a logical inference from the creator's framing. |
| Bear | Not established by the available evidence. | Not established by the available evidence. | Further negative news or guidance from Korean chip stocks, or disappointing hyperscaler earnings and/or hawkish Fed decision — a logical inference from the creator's stated catalysts. | -
Risk Factors (⚠️):
- The creator provides no defined entry, stop loss, target, position size, or probability for any trade, making verification of specific risk parameters impossible.
- The description explicitly warns that option trading is 'really risky' and that viewers are 'more than likely going to lose your money copying anything you see on this stream or channel.'
- The creator states he may not answer questions because he is 'in my zone trading,' limiting the ability to verify real-time decision rationale.
- No ticker symbols for Korean chip stocks or hyperscalers are provided in the evidence. -
Actionable Trading/Allocation Plan (🎯):
- Check the outcome of the Federal Reserve decision on that date to assess market reaction as described by the creator.
- Review the 'Nightly Watchlist' video linked in the description (URL provided) for any additional analysis or setups.
-
Creator Horizon Category (⏱️): Long-Horizon Macro / Structural — The discussion concerns long-term structural impact of AI on employment and entrepreneurship, not short-term price action.
-
One-Line Thesis (💡): The creator claims that AI will not eliminate 50% of jobs because it cannot perform many basic tasks, but it creates enormous opportunity for entrepreneurs globally, and the notion that AI will take white-collar jobs is 'ridiculous' given current limitations.
-
Key Data Points (📊):
- Claim: 'AI is not going to take away 50% of the jobs' — no specific percentage provided.
- Claim: 'Enormous opportunity' for entrepreneurs due to AI.
- Claim: AI has 'big utilization in Brazil, India, France, US' as examples of geographic spread.
- Claim: AI 'can't even do the basic' tasks without a 'programming mindset' to iterate. -
Technical Levels & Setups OR Macro Drivers (📌):
- Creator asserts that AI's inability to handle basic tasks without a programming mindset limits job displacement.
- Creator suggests that the current state of AI creates entrepreneurial opportunity for people anywhere in the world. -
Risk/Reward Framework (⚖️):
- Entry: Not established by the available evidence.
- Stop: Not established by the available evidence.
- Targets: Not established by the available evidence.
- Risk/Reward: Not established by the available evidence.
- Position Size: Not established by the available evidence.
- Probability: Not established by the available evidence. -
Scenario Analysis (🔄):
| Scenario | Probability | Target | Trigger |
|---|---|---|---|
| Bull | Not established by the available evidence. | Not established by the available evidence. | If AI continues to require human iteration for basic tasks, entrepreneurial opportunity expands as per creator's thesis. |
| Base | Not established by the available evidence. | Not established by the available evidence. | AI capability remains at current level where basic tasks still require programming mindset; limited job displacement and moderate entrepreneurial creation. |
| Bear | Not established by the available evidence. | Not established by the available evidence. | If AI advances to reliably execute basic tasks without human programming input, creator's claim that job displacement is 'ridiculous' would be invalidated. | -
Risk Factors (⚠️):
- Creator provides no supporting data or sources for the claim that AI cannot do basic tasks.
- No specific timeline given for when AI adoption may change job markets.
- The claim relies on subjective assessment of AI capability ('it can't even do the basic') rather than independent benchmarks.
- No quantitative evidence for the 'big utilization' rates in listed countries. -
Actionable Trading/Allocation Plan (🎯):
- Verify with independent labor market studies whether AI has measurably reduced white-collar employment in major economies.
- Monitor AI benchmark performance on basic reasoning and iteration tasks (e.g., SWE-bench, HumanEval) to assess validity of creator's limitation claim.
- Cross-check utilization data for AI tools in Brazil, India, France, and US via industry adoption reports from McKinsey or similar.
-
Creator Horizon Category (⏱️): Long-Horizon Macro — The creator discusses Tesla's multi-decade competitive advantage in robotics and energy, not near-term price action.
-
One-Line Thesis (💡): The creator argues that Tesla's historical EV competitive advantage has weakened against Chinese competitors, but its potential to manufacture robots at scale (millions to billions annually) represents a new, unmatched advantage that justifies holding the stock through price declines.
-
Key Data Points (📊):
- "The competitive advantage they had in EVs is not as strong today as it was 5 years ago." — creator claim
- "The Chinese are very serious with EVs." — creator claim
- "can make 10 million robots a year though in out of I guess out of Texas. No one else can do anything near that." — creator claim
- "he's talking about 100 million and then he's talking about a billion." — creator claim scaling robot production target
- "their mission was never about transportation alone. It was about ... getting us to renewable energy, getting us to renewable resources." — creator claim -
Technical Levels & Setups OR Macro Drivers (📌):
- Weakening of Tesla's EV competitive edge relative to five years ago, as Chinese EV makers intensify competition.
- Tesla's manufacturing scale advantage in robots (Optimus) as a structural moat that no competitor can match near-term.
- The creator's framing that daily stock price moves are not signals of company performance, only of trading activity. -
Risk/Reward Framework (⚖️):
- Entry: Not established by the available evidence.
- Stop: Not established by the available evidence.
- Targets: Not established by the available evidence.
- Risk/Reward: Not established by the available evidence.
- Position Size: Not established by the available evidence.
- Probability: Not established by the available evidence. -
Scenario Analysis (🔄):
| Scenario | Probability | Target | Trigger |
|---|---|---|---|
| Bull | Not established by the available evidence. | Not established by the available evidence. | Tesla demonstrates ability to produce and scale Optimus robots at or near the claimed volumes (10 million to billions annually) from Texas. |
| Base | Not established by the available evidence. | Not established by the available evidence. | Tesla maintains its EV business while delivering initial Optimus units, but does not yet achieve mass production targets. |
| Bear | Not established by the available evidence. | Not established by the available evidence. | Chinese EV competition erodes Tesla's auto market share and margins more than expected, while Optimus fails to reach production or demand milestones. | -
Risk Factors (⚠️):
- No evidence is provided that Tesla has solved technical, regulatory, or supply-chain challenges for Optimus at scale.
- The creator's assertion that no one can match Tesla's robot manufacturing is unsubstantiated; competitive response from other firms is not addressed. -
Actionable Trading/Allocation Plan (🎯):
- Verify Tesla's current and projected Optimus production capacity from official company filings or verified factory tours.
- Track any competitor announcements regarding humanoid robot production capacity for comparison.
- Review Tesla's mission statements and investor materials to confirm the renewable-energy framing of its long-term strategy.
-
Creator Horizon Category (⏱️): Long-Horizon Macro — The creator discusses structural capital cycles and technological disruption in AI infrastructure over an undefined multi-year period, referencing historical fiber analogies.
-
One-Line Thesis (💡): The creator argues that the current massive borrowing and capex spending by AI leaders like Google and Meta to build data centers is planning for perfection and that technological price-performance breakthroughs in AI could drastically reduce power requirements, leading to a surplus of unused data centers ("pickleball courts"), analogous to the dark fiber glut of the past.
-
Key Data Points (📊):
- Google and Meta are borrowing hundreds of billions of dollars — claimed by creator
- Market leaders (Google, Meta) are spending all their cash flow on capex and borrowing on top of that via bonds — claimed by creator
- Historical precedent: fiber went from 1 GB to 10 to 100 gigabyte, eliminating the bandwidth problem and creating dark fiber sold for pennies on the dollar — claimed by creator as analogy -
Technical Levels & Setups OR Macro Drivers (📌):
- Private credit market already facing a problem, which could be layered with additional risk from AI data center debt — claimed by creator
- Price-performance curve on AI minimizing power requirements could make current data center buildout redundant — claimed by creator
- Creator's analogy: historical fiber overbuild turned into dark fiber, implying similar risk for data centers -
Risk/Reward Framework (⚖️):
- Entry: Not established by the available evidence.
- Stop: Not established by the available evidence.
- Targets: Not established by the available evidence.
- Risk/Reward: Not established by the available evidence.
- Position Size: Not established by the available evidence.
- Probability: Not established by the available evidence. -
Scenario Analysis (🔄):
| Scenario | Probability | Target | Trigger |
|---|---|---|---|
| Bull | Not established by the available evidence. | Not established by the available evidence. | AI utilization scales as expected without technological breakthroughs that reduce power requirements, justifying the capex and borrowing. |
| Base | Not established by the available evidence. | Not established by the available evidence. | Some price-performance improvement occurs but demand partly absorbs capacity, leading to moderate data center utilization with some idle assets. |
| Bear | Not established by the available evidence. | Not established by the available evidence. | Technological breakthroughs in AI reduce power requirements dramatically, causing a large portion of newly built data centers to become obsolete or underutilized, analogous to dark fiber. | -
Risk Factors (⚠️):
- The creator provides no data or sources for the claim that Google and Meta are borrowing hundreds of billions; this is an unverified assertion.
- The private credit problem is mentioned but not defined or quantified; no specific evidence is given for its current state.
- The historical fiber analogy may not hold if AI demand growth outpaces any power-efficiency gains, or if data centers have alternative uses (e.g., general cloud computing) that prevent them from becoming stranded assets.
- No tickers, valuations, or specific companies beyond Google, Meta, and unnamed 'market leaders' are mentioned; the thesis is broad and not actionable at a security level. -
Actionable Trading/Allocation Plan (🎯):
- Verify Google and Meta's recent debt issuance and capex guidance from their latest 10-Q or 10-K filings and earnings calls.
- Monitor the private credit market for signs of distress or rising defaults in data-center-related loans via industry reports or credit rating changes.
- Track AI price-performance metrics (e.g., FLOPs per watt, training cost per token) from leading AI labs to assess whether power requirements are indeed decreasing significantly.
- Analyze data center utilization rates and lease renegotiation data from major REITs and operators to detect any early signs of surplus capacity.
-
Creator Horizon Category (⏱️): Short-Term Technical — The video is explicitly a pre-market preparation session focused on same-day technical analysis for futures and options traders, and references an upcoming FOMC and earnings week, indicating an intraday to multi-day horizon.
-
One-Line Thesis (💡): The creator claims they are analyzing whether the market will 'fade' a gap-up opening during FOMC and earnings week, implying a short-term directional bias based on pre-market technical analysis.
-
Key Data Points (📊):
- Live broadcast described as 'pre market technical analysis for futures traders and options traders'
- Explicit mention of 'FOMC & Earnings Week' in the title
- Title question: 'Will they FADE this gap up!?' -
Technical Levels & Setups OR Macro Drivers (📌):
- Creator is conducting pre-market technical analysis to assess whether an early gap-up in price will reverse or be sustained.
- Macro event: FOMC meeting week, which can drive volatility and shift rate expectations.
- Earnings season week, suggesting individual stock catalysts may overlap with index-level technicals. -
Risk/Reward Framework (⚖️):
- Entry: Not established by the available evidence.
- Stop: Not established by the available evidence.
- Targets: Not established by the available evidence.
- Risk/Reward: Not established by the available evidence.
- Position Size: Not established by the available evidence.
- Probability: Not established by the available evidence. -
Scenario Analysis (🔄):
| Scenario | Probability | Target | Trigger |
|---|---|---|---|
| Bull | Not established by the available evidence. | Not established by the available evidence. | A confirmed hold of the gap-up level with positive pre-market momentum, as per the creator's technical analysis in the video. |
| Bear | Not established by the available evidence. | Not established by the available evidence. | Price action fades the gap-up, indicated by a reversal pattern or key level rejection during the pre-market or early cash session. |
| Base | Not established by the available evidence. | Not established by the available evidence. | Price remains range-bound around the gap level with no clear breakout or reversal during the FOMC and earnings week. | -
Risk Factors (⚠️):
- The video is metadata-only; no specific technical levels, probabilities, or trade parameters are provided, making the thesis unverifiable without viewing the full broadcast.
- FOMC and earnings events introduce high uncertainty, and any short-term gap trade is vulnerable to sudden news-driven reversals that the creator's pre-market analysis may not account for. -
Actionable Trading/Allocation Plan (🎯):
- Verify the creator's specific technical analysis and claimed gap-up level by viewing the full video content.
-
Creator Horizon Category (⏱️): Long-Horizon Macro / Structural — The entire conversation covers Michelle's multi-year career progression and the multi-year rebuild of NYU's endowment portfolio, including governance, asset allocation, and manager selection with a long-term growth mandate.
-
One-Line Thesis (💡): Michelle is executing a growth-oriented, blank-sheet-of-paper rebuild of the NYU endowment (circa $6.5B–$8B) by restructuring governance, introducing a hybrid asset-allocation framework, leaning into higher-leverage hedge fund strategies and private markets (especially venture capital), and building a small, data-driven, 12-person team that leverages internal discussion forums and AI tools to improve information aggregation.
-
Key Data Points (📊):
- NYU endowment portfolio was approximately $6.5 billion when Michelle joined and is 'just about $8 billion' as of the interview date.
- Less than 15% of the NYU endowment was in private assets when Michelle joined; that allocation is being grown substantially.
- The portfolio has turned over 'a little more than a third' in the last two years and 'rewritten probably about another third'.
- The target asset allocation is approximately 65% equity (public and private), 25% absolute return and opportunistic, with a small allocation to cash, fixed income, and real estate.
- The team size is 12 (10 of the 12 are new since June 2024).
- Manager selection decisions under 3% of the portfolio are made by the team; above 3%, the Investment Committee must provide buy-in.
- Michelle backed a fund one (a new launch hedge fund), a couple of fund twos, and is building relationships with emerging managers.
- The foundation of the portfolio includes mixing quant exposure, macro hedge fund strategies, RV strategies, and venture capital where there was 'very little venture' before.
- Michelle uses tools like Claude, Gemini, Granola, and WhisperFlow to aggregate information. -
Technical Levels & Setups OR Macro Drivers (📌):
- Governance restructured: Investment Committee focuses on oversight, risk levels, and big themes; team handles manager selection up to 3% of portfolio size.
- Asset allocation framework mixes traditional buckets (equity, liquidity/cash, absolute return & opportunistic, real assets) with a total-portfolio lens, requiring every investment to compete with long-term equity market returns.
- Hedge fund exposure leans into higher-leverage, trading-oriented strategies (e.g., RV, macro) with deep team expertise; sizing ensures the total portfolio can survive a simultaneous bad-case scenario.
- Venture capital allocation spans incubator stage to pre-IPO, built via relationships with multi-stage firms and boutique managers.
- Public markets approach targets a 'middle ground' between passive, systematic, and long-term fundamental investing, using size-constrained, nimble managers to exploit short-term volatility with medium- to long-term conviction.
- Manager selection process is data-driven, forward-looking, and involves a team discussion at ~70% of the research process (not at the end).
- Co-investment portfolio has been stood up and is in 'crawling' phase, with a goal to progress to 'walk' over the next two years.
- Risk management is being built out at the subset level (e.g., equity sleeve, absolute return sleeve) in addition to total-portfolio stress testing. -
Risk/Reward Framework (⚖️):
- Entry: Not established by the available evidence.
- Stop: Not established by the available evidence.
- Targets: Not established by the available evidence.
- Risk/Reward: Not established by the available evidence.
- Position Size: Not established by the available evidence.
- Probability: Not established by the available evidence. -
Scenario Analysis (🔄):
| Scenario | Probability | Target | Trigger |
|---|---|---|---|
| Base | Not established by the available evidence. | Not established by the available evidence. | Continued steady-state execution of the growth mandate, incremental diversification of absolute return and public equity portfolios, and gradual scaling of the co-investment initiative from 'crawling' to 'walking'. |
| Bull | Not established by the available evidence. | Not established by the available evidence. | Successful deployment of capital into early AI venture opportunities and high-leverage hedge fund strategies that outperform, combined with a sustained environment of low correlations that allows the total portfolio to generate above-target returns. |
| Bear | Not established by the available evidence. | Not established by the available evidence. | Verify the trigger against the source evidence. | -
Risk Factors (⚠️):
- FOMO in private markets: the aggressive fundraising cycle in private markets could push the team to invest procyclically beyond prudent commitment pacing.
- Underappreciation of structural changes: the team may be underappreciating the medium-to-long-term impact of private markets and AI on public market factor exposures.
- Concentration risk in venture: rapid ramping of venture capital allocation exposes the portfolio to long-duration, illiquid, and potentially correlated drawdowns.
- Team integration risk: 10 of 12 team members are new since June 2024, creating potential for process friction despite strong in-office culture. -
Actionable Trading/Allocation Plan (🎯):
- Monitor the actual commitment pacing against the stated model to verify that private market commitments remain countercyclical, not procyclical.
- Track the evolving composition of the absolute return and opportunistic bucket to confirm it maintains a 25% target and that hedge fund managers' leverage levels are stress-tested quarterly.
- Observe the scaling of the co-investment portfolio from 'crawling' to 'walking' over the next two years as a revealed-preference signal of the team's risk appetite.
- Cross-check public equity exposure factor models against the team's stated view that AI and private markets may be undervalued in current public pricing.

-
Creator Horizon Category (⏱️): Short-Term Technical — The video title and description focus on the current week as 'the PIVOTAL week' of earnings that 'can potentially decide where the next leg of the market goes', indicating a short-term catalyst-driven technical outlook.
-
One-Line Thesis (💡): The creator asserts that the upcoming week is pivotal because the largest earnings reports of the period may determine the market's next directional leg, with futures stabilizing over the weekend as traders position for that event.
-
Key Data Points (📊):
- Title description: 'Futures stabilize over the weekend as trader's setup for the biggest week of earnings that can potentially decide where the next leg of the market goes.' -
Technical Levels & Setups OR Macro Drivers (📌):
- Earnings reports – identified as the 'biggest week of earnings', potentially deciding market direction.
- Futures stabilization over the weekend – described as evidence of trader positioning ahead of the earnings week. -
Risk/Reward Framework (⚖️):
- Entry: Not established by the available evidence.
- Stop: Not established by the available evidence.
- Targets: Not established by the available evidence.
- Risk/Reward: Not established by the available evidence.
- Position Size: Not established by the available evidence.
- Probability: Not established by the available evidence. -
Scenario Analysis (🔄):
| Scenario | Probability | Target | Trigger |
|---|---|---|---|
| Bull | Not established by the available evidence. | Not established by the available evidence. | Positive earnings outcomes and follow-through buying after the week's results, confirming a new upward leg. |
| Base | Not established by the available evidence. | Not established by the available evidence. | Earnings results are mixed or in line with expectations, leading to continued sideways consolidation without a decisive next leg. |
| Bear | Not established by the available evidence. | Not established by the available evidence. | Negative earnings surprises or guidance cause a breakdown from current levels, triggering a bearish leg. | -
Risk Factors (⚠️):
- The creator provides no specific tickers, price levels, or catalysts beyond the general claim of a 'biggest week of earnings', making the thesis untestable without additional information.
- The evidence does not disclose which companies are reporting, their expected impact, or any supporting data such as implied volatility or historical earnings reactions.
- The stream's disclaimer warns against copying trades and states options trading is risky; the evidence does not provide a verifiable track record or methodology. -
Actionable Trading/Allocation Plan (🎯):
- Monitor futures prices at market open after each key earnings release to assess whether positioning aligns with the creator's assertion of 'futures stabilize over the weekend'.
-
Creator Horizon Category (⏱️): Long-Horizon Macro — The discussion focuses on broad consumer-spending health and the shape of the income distribution ("the K"), not on short-term price action.
-
One-Line Thesis (💡): The creator argues that the lower half of the K-shaped recovery is not as distressed as populist narratives claim, citing full airplanes, large paid-event crowds, and conversations with middle-income attendees as circumstantial evidence of resilient discretionary spending.
-
Key Data Points (📊):
- Claim: "The lower half of the K is not doing nearly as bad as some people would have you believe."
- Claim: Airplanes are full; the creator "hasn't been on a flight with empty seats in three years."
- Claim: 90,000 people attended a Commanders-Lions game, and the creator asserts they were "not all rich people."
- Claim: Fanatics Fest had large crowds, and the creator spoke with attendees who were "teachers" and "gym teachers" — not the upper end of the K.
- Claim: The popular messaging that "people are getting crushed by inflation" is described as "virtue signaling" and a way to "go viral." -
Technical Levels & Setups OR Macro Drivers (📌):
- Creator cites high air-travel load factors as a sign of broad-based demand.
- Creator cites large paid-event attendance (football game, Fanatics Fest) as evidence that middle-income consumers still have disposable income.
- Creator frames the negative narrative as a social-media virality incentive rather than an accurate economic picture. -
Risk/Reward Framework (⚖️):
- Entry: Not established by the available evidence.
- Stop: Not established by the available evidence.
- Targets: Not established by the available evidence.
- Risk/Reward: Not established by the available evidence.
- Position Size: Not established by the available evidence.
- Probability: Not established by the available evidence. -
Scenario Analysis (🔄):
| Scenario | Probability | Target | Trigger |
|---|---|---|---|
| Bull | Not established by the available evidence. | Not established by the available evidence. | Consumer spending data (e.g., real retail sales ex-inflation, airline passenger counts, live-event attendance) continues to show strength across income quintiles, validating the creator's claim that the lower half is not severely distressed. |
| Base | Not established by the available evidence. | Not established by the available evidence. | Aggregate consumer spending holds up but credit-card delinquencies and savings depletion signal a bifurcation that the creator's anecdotal evidence may understate. |
| Bear | Not established by the available evidence. | Not established by the available evidence. | Verify the trigger against the source evidence. | -
Risk Factors (⚠️):
- The creator relies on anecdotal evidence (full flights, event crowds) rather than formal income or spending data.
- Selection bias: the creator's personal travel and attendance at paid events may disproportionately capture higher-income consumers.
- No specific financial instrument, valuation, or price level is mentioned, so the analysis cannot be tied to a market trade or portfolio adjustment. -
Actionable Trading/Allocation Plan (🎯):
- Cross-reference creator's claim with BLS Consumer Expenditure Survey data for the bottom quartile of earners, focusing on discretionary spending categories (airfare, entertainment).
- Monitor Federal Reserve Bank of New York's Household Debt and Credit Report for delinquency rates among low-credit-score borrowers to gauge financial stress in the lower half of the income distribution.
- Track airline load factors and live-event attendance data from industry sources (e.g., Airlines for America, Pollstar) to quantify the trend the creator cites anecdotally.
- Compare social-media virality metrics (e.g., engagement on posts claiming economic hardship) with actual economic indicators to test the creator's hypothesis about narrative distortion.
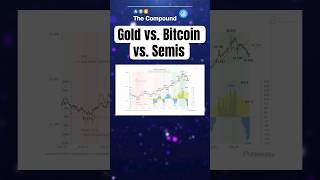
-
Creator Horizon Category (⏱️): Short-Term Technical — The discussion centers on momentum-driven capital rotation between gold, Bitcoin, and semiconductors, with intra-year cycle peaks and fast-money shifts occurring on a scale of weeks to months.
-
One-Line Thesis (💡): The creator argues that 'fast money' rotates between assets based on upward price trends and ample liquidity, not fundamental conviction — citing recent shifts from Bitcoin to gold to semiconductors as evidence.
-
Key Data Points (📊):
- Bitcoin had a four-year cycle peak at 126,000 — exact level stated by the creator.
- Gold was up over 30% in 2025 — exact return stated by the creator.
- Silver was mooning to $150 — exact price level stated by the creator.
- Gold ETFs saw large inflows during gold's run — referred to as 'yellow bars' on a chart of ETF inflows.
- The global money supply (red line) was used to fit gold's price, with the creator claiming gold went 'way above' that fitted value.
- The Iran conflict triggered simultaneous selling of gold and treasuries as Gulf states needed funding.
- Fast money then moved into semiconductors in Korea and the US via 'double triple levered single name ETF' — creator's phrasing. -
Technical Levels & Setups OR Macro Drivers (📌):
- Central bank buying of gold was an initial fundamental driver, but later price action was dominated by trend-following fast money.
- Liquidity conditions (e.g., 'ample liquidity during meme stock days of 2021') enable fast money to chase any rising asset.
- Bitcoin's cooling after its 126,000 peak coincided with gold's acceleration, suggesting a rotation of speculative capital.
- The Iran conflict created a liquidity shock: gold and treasuries were sold by Gulf states to fund oil shortfalls, ending gold's overshoot.
- Semiconductor momentum in both Korea and the US became the next destination for fast money, with heavy flows into levered ETFs. -
Risk/Reward Framework (⚖️):
- Entry: Not established by the available evidence.
- Stop: Not established by the available evidence.
- Targets: Not established by the available evidence.
- Risk/Reward: Not established by the available evidence.
- Position Size: Not established by the available evidence.
- Probability: Not established by the available evidence. -
Scenario Analysis (🔄):
| Scenario | Probability | Target | Trigger |
|---|---|---|---|
| Bull | Not established by the available evidence. | Not established by the available evidence. | Fast money continues to rotate into semiconductors, sustaining double/triple levered ETF inflows and price momentum. |
| Base | Not established by the available evidence. | Not established by the available evidence. | Fast money remains in semiconductors for the near term, but liquidity conditions or a macro event could trigger another rotation similar to the Iran conflict. |
| Bear | Not established by the available evidence. | Not established by the available evidence. | A geopolitical shock or liquidity dry-up forces fast money to exit semiconductors, causing a sharp reversal in levered semiconductor ETFs. | -
Risk Factors (⚠️):
- The creator provides no fundamental valuation anchor for any asset (gold, Bitcoin, silver, semiconductors) — the narrative is purely momentum-based.
- No specific tickers, market-cap thresholds, or timeline are given for the rotation, making it impossible to verify the claim with precision.
- The claim that gold 'is in a bare market essentially' at the time of recording is undefined — no price level or duration is given.
- The fatal flaw is that the creator treats 'fast money' as a monolithic force; a single large seller could disrupt the described rotation pattern. -
Actionable Trading/Allocation Plan (🎯):
- Monitor weekly gold ETF flow data and COMEX positioning to verify if inflows have reversed post-Iran conflict as claimed.
- Track Bitcoin's price and volume relative to the 126,000 peak to assess whether the cooling period is continuing or reversing.
- Verify the existence and composition of 'double triple levered single name ETF' in semiconductors (both US and Korea) and compare inflow data.
- Cross-check the global money supply (red line) chart referenced by the creator to confirm the fitted gold price model and the stated overshoot.
- Obtain price charts of gold, silver, and semiconductor indices for the exact period described (2025 through the Iran conflict) to confirm the rotation sequence.

-
Creator Horizon Category (⏱️): Long-Horizon Macro / Structural — The discussion focuses on long-term brand deterioration and fundamental business performance, not on short-term price action.
-
One-Line Thesis (💡): The creator argues that Nike's business fundamentals have deteriorated and that the stock market is pricing in a structural decline reminiscent of once-dominant brands like MTV and Sports Illustrated, though it may present a contrarian buying opportunity.
-
Key Data Points (📊):
- Nike — ticker NKE, the subject of the discussion
- "The fundamentals of Nike's business sucks. It's not doing well" — creator's direct claim about current business performance -
Technical Levels & Setups OR Macro Drivers (📌):
- Comparison to brands like MTV and Sports Illustrated that have faded from relevance suggests a structural rather than cyclical driver for Nike's decline.
- The statement "they kind of blew it" implies management execution failures as a key driver. -
Risk/Reward Framework (⚖️):
- Entry: Not established by the available evidence.
- Stop: Not established by the available evidence.
- Targets: Not established by the available evidence.
- Risk/Reward: Not established by the available evidence.
- Position Size: Not established by the available evidence.
- Probability: Not established by the available evidence. -
Scenario Analysis (🔄):
| Scenario | Probability | Target | Trigger |
|---|---|---|---|
| Base | Not established by the available evidence. | Not established by the available evidence. | Nike's fundamentals continue to deteriorate as reflected in earnings reports, corroborating the creator's claim that "the fundamentals of Nike's business sucks." |
| Bull | Not established by the available evidence. | Not established by the available evidence. | The current price decline proves to be "the buy signal of a lifetime," as suggested by the creator, requiring evidence of a turnaround in revenue, margins, or market share. |
| Bear | Not established by the available evidence. | Not established by the available evidence. | Nike follows the path of MTV and Sports Illustrated, becoming a permanently diminished brand with no recovery in fundamentals. | -
Risk Factors (⚠️):
- The creator's thesis is based on qualitative brand nostalgia, not quantitative data; no specific financial metrics (e.g., revenue, earnings, margins) are cited to verify the claim that fundamentals "suck."
- The statement "Nike will be around for the rest of eternity" creates ambiguity about the severity of the decline; the creator may be overstating bearish sentiment while also affirming long-term survival.
- No specific stock price, valuation (P/E, P/S), or revenue growth figures are provided, making the thesis difficult to falsify. -
Actionable Trading/Allocation Plan (🎯):
- Monitor Nike's next quarterly earnings release for actual revenue growth, net income, and gross margin trends to verify or refute the claim that "the fundamentals of Nike's business sucks."
- Track market share data for Nike versus competitors (e.g., Adidas, New Balance) to assess whether brand decline is occurring as suggested.
- Review analyst consensus and management guidance for any explicit turnaround initiatives that could invalidate the bearish structural thesis.

-
Creator Horizon Category (⏱️): Long-Horizon Macro — The evidence supports this horizon classification.
-
One-Line Thesis (💡): The creator claims that Google's business model compounds capital at an average of 32% over a 20-year period, and that fragmentation of AI models benefits Google by creating demand for its silicon, cloud, and ad-targeting services.
-
Key Data Points (📊):
- Creator describes Google's 20-year average compound rate as 32%.
- Creator identifies four key businesses: search, AI transition, cloud, and silicon. -
Technical Levels & Setups OR Macro Drivers (📌):
- Fragmentation of AI models creates tailwinds for Google's silicon and cloud businesses.
- Google's AI capabilities improve ad targeting and content creation on YouTube and other platforms.
- Creator asserts Google's management is methodically investing in their edge and will be 'massively rewarded.' -
Risk/Reward Framework (⚖️):
- Entry: Not established by the available evidence.
- Stop: Not established by the available evidence.
- Targets: Not established by the available evidence.
- Risk/Reward: Not established by the available evidence.
- Position Size: Not established by the available evidence.
- Probability: Not established by the available evidence. -
Scenario Analysis (🔄):
| Scenario | Probability | Target | Trigger |
|---|---|---|---|
| Bull | Not established by the available evidence. | Not established by the available evidence. | Proliferation of 500+ different AI models is confirmed, driving demand for Google's silicon and cloud. |
| Base | Not established by the available evidence. | Not established by the available evidence. | Google continues to compound at or near its historical 32% ROIC through a combination of search, AI, cloud, and silicon. |
| Bear | Not established by the available evidence. | Not established by the available evidence. | Fragmentation does not materialize or Google fails to capture share in silicon/cloud despite model proliferation. | -
Risk Factors (⚠️):
- The 32% ROIC claim may be based on a specific time window or accounting method; verification needed from financial statements.
- Creator provides no evidence that model fragmentation will actually benefit Google more than competitors.
- No mention of regulatory, competitive (e.g., from other cloud providers), or execution risks. -
Actionable Trading/Allocation Plan (🎯):
- Monitor quarterly cloud and silicon revenue growth relative to industry benchmarks.
- Track the number of distinct AI models and their cloud/silicon provider choices to confirm fragmentation trend.
- Assess Google's AI ad-targeting revenue contribution in earnings call transcripts.

-
Creator Horizon Category (⏱️): Long-Horizon Macro — The creator discusses multi-year returns for SpaceX and Tesla over 10 to 15 years.
-
One-Line Thesis (💡): The creator predicts that SpaceX will generate returns of 20 to 30 times the IPO price over the next 10 to 15 years, reaching a valuation of at least $20-40 trillion.
-
Key Data Points (📊):
- SpaceX: expected returns of 20 to 30 times from the IPO price in 10 to 15 years.
- SpaceX IPO price: $2 trillion.
- SpaceX target valuation range: $20 trillion to $40 trillion, with at least $40 trillion mentioned.
- Claim: SpaceX will be the biggest company in the world by a wide margin.
- Global market cap at time of statement: approximately $70-80 trillion. -
Technical Levels & Setups OR Macro Drivers (📌):
- Not established by the available evidence. -
Risk/Reward Framework (⚖️):
- Entry: Not established by the available evidence.
- Stop: Not established by the available evidence.
- Targets: Not established by the available evidence.
- Risk/Reward: Not established by the available evidence.
- Position Size: Not established by the available evidence.
- Probability: Not established by the available evidence. -
Scenario Analysis (🔄):
| Scenario | Probability | Target | Trigger |
|---|---|---|---|
| Bull | Not established by the available evidence. | Not established by the available evidence. | SpaceX achieves the described growth trajectory and becomes the largest company in the world. |
| Base | Not established by the available evidence. | Not established by the available evidence. | SpaceX's business performance matches the creator's 'incredible business' assessment. |
| Bear | Not established by the available evidence. | Not established by the available evidence. | SpaceX fails to achieve the expected growth or faces competition, regulatory hurdles, or technological setbacks that prevent it from reaching a $20-40 trillion valuation. | -
Risk Factors (⚠️):
- No specific financial data, business metrics, or competitive analysis provided to support the valuation claims.
- A single company reaching $20-40 trillion would represent an unprecedented share of the global stock market (~$70-80 trillion).
- The timeline of 10-15 years is long and subject to unstated macroeconomic, technological, and regulatory risks.
- No mention of SpaceX's current private valuation, revenue, profit, or any fundamental data that would justify the target multiples.
- The creator acknowledges the projection sounds extreme ('you sound like you're on drugs') but offers no counter-arguments or risk analysis. -
Actionable Trading/Allocation Plan (🎯):
- Monitor SpaceX's private market valuation and any official IPO filings for pricing and financial disclosures.
- Verify the total global stock market capitalization figures cited (~$70-80 trillion) from a reputable source.
- Seek independent analyst reports or third-party projections for SpaceX to compare with the creator's claims.
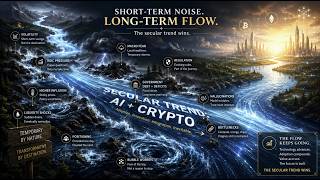
-
Creator Horizon Category (⏱️): Long-Horizon Macro — Visser states 'the long-term flow of AI' is unchanged and expects thematic AI portfolio to outperform the S&P by 15% per year minimum over 3 to 5 years.
-
One-Line Thesis (💡): The AI thematic is in a secular bull market driven by earnings growth and Jevons paradox, with short-term consolidation and capital-raising headwinds, while the U.S. and China are in a two-horse AI race that makes crypto critically important.
-
Key Data Points (📊):
- 86% of S&P 500 companies that have reported earnings have beaten estimates; a nearly 8:1 ratio of beats to misses.
- Google's cloud revenue grew 82% year-over-year; its backlog surged from $106 billion to $514 billion in one year.
- Google's free cash flow was negative in the quarter: operating cash flow $39 billion vs. capex $45 billion.
- China state-owned funds bought nearly 9 billion shares to support the market; five state-backed insurers will boost equity holdings.
- DeepSeek closed over $7 billion funding in June with state voting rights; Moonshot (Kimmy K3) seeks $50 billion valuation.
- Visser places a '70 to 75% odds' that Google's cap-ex program proves value-creative over 3 to 5 years, per an LLM analysis he cited.
- Thematic AI portfolio relative to hyperscalers had its biggest week since late March.
- Bitcoin stable around $64,000; Dogecoin has been below its 20-day moving average for 67 days, the longest in its history.
- Oil December contract near $78; two-year break-evens have not budged despite oil rise. -
Technical Levels & Setups OR Macro Drivers (📌):
- S&P 500 consolidating a big move higher with two up weeks then two down weeks; breadth (20-day highs) beginning to improve.
- Tech momentum (MO) bounced 8% for the week after a gruesome four weeks; VIX remains low.
- Small caps (IWM) have done better than the broader market for four consecutive weeks with sub-1% absolute moves.
- Equal-weight S&P 500 ETF shows very low volatility; thematic AI portfolio near 38% retracement level.
- GPU availability is tightening back up after a period of loosening.
- Estimates revision factor remains positive and is the dominant factor to follow since the iPhone era.
- Visser began buying AI last week, did not buy this week, but will continue to look to buy as the sector consolidates. -
Risk/Reward Framework (⚖️):
- Entry: Not established by the available evidence.
- Stop: Not established by the available evidence.
- Targets: Thematic AI portfolio expected to outperform S&P by 15% per year minimum over 3 to 5 years.
- Risk/Reward: Not established by the available evidence.
- Position Size: Not established by the available evidence.
- Probability: Not established by the available evidence. -
Scenario Analysis (🔄):
| Scenario | Probability | Target | Trigger |
|---|---|---|---|
| Bull | 70-75% (applied to Google's capex program, not to overall market) | Not established by the available evidence. | Contracted demand (backlog) continues to convert; enterprise adoption accelerates; Jevons paradox drives compute demand. |
| Base | Not established by the available evidence. | Not established by the available evidence. | Verify the trigger against the source evidence. |
| Bear | 25-30% (implied by the 70-75% odds on Google) | Not established by the available evidence. | Off-balance-sheet commitments become problematic; chip obsolescence shortens depreciation life; backlog concentration risk (e.g., OpenAI failure). | -
Risk Factors (⚠️):
- Massive capital raises (Google $80B, Chinese AI firms, SpaceX) are soaking up liquidity during low-volume summer; could delay recovery.
- Google's backlog concentration: if OpenAI or other major clients fail, backlog conversion may not materialize.
- Free cash flow negativity at hyperscalers could cause multiple compression for memory and AI infrastructure names.
- Oil price rise could cause a temporary bump in headline CPI, potentially affecting Fed policy expectations.
- Clarity Act (crypto regulation) fell below 50% Senate support per Bessent; regulatory uncertainty remains. -
Actionable Trading/Allocation Plan (🎯):
- Monitor weekly S&P breadth (20-day new highs) for confirmation of improving internals.
- Watch GPU availability indicators (e.g., lead times, rental pricing) for signs of compute oversupply or scarcity.
- Follow Chinese AI funding rounds and state support announcements as a race indicator.
- Observe Dogecoin's price relative to its 20-day moving average as a proxy for retail crypto sentiment.
- Verify earnings beats percentage each week; current 86% beat rate is a key support for the thesis.
-
Creator Horizon Category (⏱️): Long-Horizon Macro / Structural — The creator discusses a permanent cost structure shift for US companies and a regulatory-induced repricing of equities, implying a structural, not short-term, impact.
-
One-Line Thesis (💡): Government intervention restricting open-source AI would impose a permanent cost disadvantage on US firms, leading to stock market declines and cratering valuations of AI companies like Anthropic and OpenAI due to lost market-driven demand.
-
Key Data Points (📊):
- Coca-Cola described as an example of an 'average normal company' forced to pay 50 to 100 times more for AI inputs vs. best alternatives
- Claim: 'If the United States government intervenes, it will tank the stock market.'
- Claim: Valuations of Anthropic and OpenAI 'will crater' under a ban on open-source AI
- Claim: AI company revenue is 'artificially being propped up' by regulatory capture, not market demand -
Technical Levels & Setups OR Macro Drivers (📌):
- Creator asserts that any US government intervention in AI (e.g., banning open-source) is a driver for broad market decline
- Creator identifies abolition of open-source as a driver for the collapse of AI company valuations -
Risk/Reward Framework (⚖️):
- Entry: Not established by the available evidence.
- Stop: Not established by the available evidence.
- Targets: Not established by the available evidence.
- Risk/Reward: Not established by the available evidence.
- Position Size: Not established by the available evidence.
- Probability: Not established by the available evidence. -
Scenario Analysis (🔄):
| Scenario | Probability | Target | Trigger |
|---|---|---|---|
| Bear | Not established by the available evidence. | Not established by the available evidence. | US government announces a ban on open-source AI, leading to stock market tanking and cratering of AI company valuations per creator |
| Base | Not established by the available evidence. | Not established by the available evidence. | No government intervention occurs; current market dynamics persist without artificial cost constraints | -
Risk Factors (⚠️):
- Creator does not verify that open-source AI is the best available alternative for all US firms
- Creator assumes that non-US competitors would not face equivalent regulatory constraints
- The claim that AI company revenue is 'artificially propped up' lacks cited evidence
- Scenario omits possibility of partial or targeted regulation that does not ban open-source entirely -
Actionable Trading/Allocation Plan (🎯):
- Monitor US legislative and executive actions regarding open-source AI and regulatory frameworks
- Verify cost differentials between proprietary and open-source AI models from independent industry reports
- Track revenue growth and market-share data for Anthropic and OpenAI to assess dependency on competitive market vs. regulatory barriers
- Analyze sector-wide cost structures for US firms (e.g., Coca-Cola) to test the claimed magnitude of cost impact

-
Creator Horizon Category (⏱️): Short-Term Technical — The creator bases the entire analysis on weekly, daily, and hourly time frames and discusses immediate price levels and the upcoming FOMC meeting and earnings week.
-
One-Line Thesis (💡): The S&P 500 and Nasdaq have broken short-term uptrends with unfilled gaps and lower lows, the Nasdaq is in a confirmed daily downtrend, and the creator sees the path of least resistance as down until the market reclaims key resistance levels such as closed gaps and moving averages.
-
Key Data Points (📊):
- S&P 500 closed the week at the lower bound of the upper high volume node (implied from volume profile).
- Nasdaq made a new lower low on Friday, confirming a lower low in the trend count.
- Nasdaq previous all-time high test area: 640-636 (implied as a further 6% drop).
- ARM Holdings (ARM) down 46% from highs; Qualcomm down 36%; Marvell down 41%.
- MAG7 ETF (implicitly MAGS or similar) gapped down after Google and Tesla earnings, failed daily 50, under daily 8 and 200.
- Consumer Discretionary (XLY) broke a range and headed toward 52-week lows.
- MU (Micron) key level: 900 (gap close from prior gap up, potential inverted head-and-shoulders neckline).
- Apple (AAPL) reclaimed highs and offers long opportunity via hourly flag over previous resistance at 329.
- Microsoft (MSFT) breakdown point: 380; below that considered bearish.
- Amazon (AMZN) gapped down, broke daily 200, possible counter-trend gap-fill reversal.
- XLE (Energy) leading sector +3.59% on the week; XLU and XLRE also defensive leaders.
- XLF (Financials) shows constructive flag off daily 20 SMA; JPM at new all-time highs.
- FOMC meeting on Wednesday; Fed funds futures show 65% probability of pause, 34% probability of hike.
- Volatility (VIX) sideways; insurance appears cheap per creator; VVIX at warning line 103.
- Tesla (TSLA) put sold by creator; two consecutive daily closes below lower Bollinger Band; IV rank near 65%. -
Technical Levels & Setups OR Macro Drivers (📌):
- Unfilled gap on S&P 500 daily chart after Thursday gap down; bearish characteristic per creator (bullish market should close gaps).
- Daily lower highs and lower lows confirmed on both S&P 500 and Nasdaq; trend flipped to down.
- Distribution pattern: morning strength met by afternoon weakness (upper wicks, fades).
- Moving averages stacked bearishly: price below 8 EMA, 20 SMA, 50 SMA on daily for Nasdaq and S&P 500.
- MU at 900: creator lists as top priority early this week; a hold/potential higher low vs failure/break.
- Relative strength plays cited: AET, DDOG, OKTA – creator says to track them but only trade if Nasdaq shows strength.
- Correlations moving toward 1 (bearish market characteristic) with all three indexes showing similar bearish weekly candle structure. -
Risk/Reward Framework (⚖️):
- Entry: Not established by the available evidence.
- Stop: Not established by the available evidence.
- Targets: Not established by the available evidence.
- Risk/Reward: Not established by the available evidence.
- Position Size: Not established by the available evidence. Creator states swing account is flat except for a Tesla put sold (no size given).
- Probability: Not established by the available evidence. -
Scenario Analysis (🔄):
| Scenario | Probability | Target | Trigger |
|---|---|---|---|
| Bear | Not established by the available evidence. | Not established by the available evidence. | Verify the trigger against the source evidence. |
| Base | Not established by the available evidence. | Not established by the available evidence. | Verify the trigger against the source evidence. |
| Bull | Not established by the available evidence. | Not established by the available evidence. | S&P 500 closes above 749 (pressing upper bound of weekly expected move) or Nasdaq reclaims 707 (key resistance level). Could also require MU holding 900 and reclaiming its neckline. | -
Risk Factors (⚠️):
- Market fails to close unfilled gaps and continues to set lower highs/lower lows.
- MAG7 earnings (MSFT, META, AAPL) could accelerate sell-off if capex concerns persist.
- FOMC hawkish surprise (34% probability of a hike priced) could trigger a shock down to S&P 700 area.
- Dollar and rates breaking out are headwinds; energy-led inflation could keep Fed restrictive.
- Creator acknowledges his own Tesla put position but warns that Tesla could still extend lower; no edge claimed beyond oversold indicator.
- Missing verification: creator's specific risk/reward parameters for his own trades (entry, stop, target, size) are not disclosed.
- The creator explicitly states multiple times that he has no position in the broad market swing account, limiting direct actionable plans for third-party traders. -
Actionable Trading/Allocation Plan (🎯):
- Watch MU at 900 for an intraday look-below-and-fail or decisive breakdown; creator labels this a top priority early week.
- Monitor sector rotation: if XLF and defensive sectors continue leading while MAG7 and semis remain weak, bearish context persists.
- Review FOMC statement and Powell's press conference on Wednesday for rate-path signals; creator notes a hike would be a shock to markets.
- Check Tesla hourly for a potential higher low and neckline break above the head-and-shoulders pattern for counter-trend bounce; creator sold puts but notes no guarantee of bounce.
- Observe relative-strength names (AET, DDOG, OKTA) as potential early leaders only if the Nasdaq demonstrates a constructive day (not a weak tape).

-
Creator Horizon Category (⏱️): Long-Horizon Macro / Structural — The creator argues that restrictions on using Chinese open-source models would permanently damage the American open-source ecosystem, a structural regulatory and competitive claim.
-
One-Line Thesis (💡): The creator claims that American developers must be allowed to use Chinese open-source models like Kimik 2.5 without being accused of benefiting from IP theft, because doing so is standard open-source practice and banning it would destroy the American open-source ecosystem and entrench Anthropic's market position by reducing competition.
-
Key Data Points (📊):
- Kimik 2.5 is described as a Chinese open-source model used as a starting point by Cursor.
- The creator asserts that no data from Cursor's derivative product goes back to China.
- Anthropic is identified by the creator as a party that wants to prevent American companies from using Chinese open-source models, ostensibly to eliminate competition. -
Technical Levels & Setups OR Macro Drivers (📌):
- The ability for American developers to fork and fine-tune open-source models released by Chinese entities is presented as a driver of innovation in the American developer ecosystem.
- Regulatory or legal action that labels Chinese open-source models as 'tainted with IP theft' is a setup that would suppress competition for closed-source model providers like Anthropic. -
Risk/Reward Framework (⚖️):
- Entry: Not established by the available evidence.
- Stop: Not established by the available evidence.
- Targets: Not established by the available evidence.
- Risk/Reward: Not established by the available evidence.
- Position Size: Not established by the available evidence.
- Probability: Not established by the available evidence. -
Scenario Analysis (🔄):
| Scenario | Probability | Target | Trigger |
|---|---|---|---|
| Bull | Not established by the available evidence. | Not established by the available evidence. | No regulatory barriers are imposed on American companies using Chinese open-source models; open-source ecosystem continues to operate with full access. |
| Bear | Not established by the available evidence. | Not established by the available evidence. | Authorities treat Chinese open-source contributions as tainted by IP theft, restricting American developers from forking or post-training such models. |
| Base | Not established by the available evidence. | Not established by the available evidence. | Mixed or unclear regulatory guidance that allows some use of Chinese open-source models but imposes compliance costs or licensing uncertainties. | -
Risk Factors (⚠️):
- The characterization of Kimik 2.5 as purely 'open source' and in the public domain may not hold if its license contains restrictions or terminated patent grants; the evidence does not provide the license terms.
- The identification of Anthropic as a motivated party is a claim by the creator, not a confirmed fact; other closed-source AI firms may have different positions. -
Actionable Trading/Allocation Plan (🎯):
- Verify the open-source license of Kimik 2.5 to confirm it permits unrestricted commercial forking and post-training.
- Monitor U.S. regulatory announcements and legislation regarding the use of Chinese-origin AI models in critical American software industries.

-
Creator Horizon Category (⏱️): Short-Term Technical — The evidence supports this horizon classification.
-
One-Line Thesis (💡): The Nasdaq is in a daily and weekly downtrend within a monthly consolidation, while the S&P 500 remains steady via rotation into sectors like financials, healthcare, energy, and utilities; the critical near-term question for bulls is whether semiconductors and memory can form daily higher lows by Monday/Tuesday, which would set a weekly bounce, or whether bears will push those names to daily oversold conditions.
-
Key Data Points (📊):
- SPY drawdown from highs: -3% (transcript date approximation); QQQ drawdown: single-digit percent
- Mega-cap drawdowns: Microsoft -31%, Tesla -38%, Netflix -46%
- FOMC rate-hike probability shift: 13% one week ago, 34% as of video recording
- S&P 500 level: weekly equilibrium consolidation if price holds above 7357 for a weekly higher low
- Tesla monthly/ weekly/ daily all downtrend; last confirmed monthly downtrend was end of 2023
- Financial sector (XLF): all-time-high weekly close; healthcare (XLV): second-highest weekly close ever
- Gold resistance line: daily uptrend confirmation needed; silver: inverse head-and-shoulders attempt with left shoulder lower low
- Semiconductor ETF (SMH): weekly stairstep drop for one month, weekly inside bar printed
- Software ETF (IGV): weekly higher low less probable than MAGS due to less space -
Technical Levels & Setups OR Macro Drivers (📌):
- Mega-cap earnings (Microsoft, Meta, Apple, Google) expected to provide capex data for AI spending, directly affecting semis
- Semis/memory: the creator is watching for a daily higher low on Monday/Tuesday; failure would shift focus to daily oversold conditions as a potential monthly higher-low formation
- Nasdaq hourly trend: bear control with hourly EMA 12 resistance; RSI contained in a range, not yet oversold
- XLF: head-and-shoulders vs. weekly bull flag decision point; XLV: daily equilibrium near 164 break; IYT/IYJ: weekly bull flag potential
- Metals: gold daily uptrend confirmation pending FOMC; correlation shift away from NASDAQ noted
- Oil (WTI): 4-hour and 12-hour RSI over 80, reaching resistance zone; has space for a weekly higher low even after rejection
- Observable relationship: semis inverse to XLF, XLV, and tranports; NASDAQ-to-Tesla correlation "gone for a year"
- Bear-goggles methodology: the creator uses hourly rising wedge patterns to counter-trade, e.g., MU short from hourly wedge at the highs -
Risk/Reward Framework (⚖️):
- Entry: Not established by the available evidence.
- Stop: Not established by the available evidence.
- Targets: Not established by the available evidence.
- Risk/Reward: Not established by the available evidence.
- Position Size: Not established by the available evidence.
- Probability: Not established by the available evidence. -
Scenario Analysis (🔄):
| Scenario | Probability | Target | Trigger |
|---|---|---|---|
| Bull | Not established by the available evidence. | S&P 500 new all-time highs (stated: if all smashed names regain half their drawdown, indexes clearly at new highs); Nasdaq daily higher low and weekly bounce | Semis/memory form daily higher lows Monday/Tuesday with a close above that level; MAGS and IGV set weekly higher lows into August; XLF holds as a weekly bull flag; gold confirms daily uptrend; FOMC/Earnings produce a bullish reaction |
| Base | Not established by the available evidence. | S&P 500 weekly equilibrium (above 7357) and continued sector rotation; Nasdaq consolidates month-range between current support and previous all-time high | Semis/memory fail to form higher lows but do not hit daily oversold; MAGS/IGV tighten but hold support; S&P 500 holds 7357; XLF/XLV remain in daily equilibria |
| Bear | Not established by the available evidence. | Not established by the available evidence. | Semis/memory fail to form daily higher lows Monday/Tuesday and break below recent lows; MAGS/IGV break weekly support to confirm weekly downtrend; XLF prints a daily head-and-shoulders breakdown; Nasdaq daily falls into daily oversold with no bounce | -
Risk Factors (⚠️):
- Creator's stated swing trades have been stopping out at breakeven frequently, indicating the consolidation environment is challenging for longer-term positioning
- FOMC and mega-cap earnings events could produce sharp gap moves contrary to the creator's anticipated daily higher-low formation
- Correlation shifts under the hood (e.g., semis vs. financials/healthcare) are observed to be disruptive and may require more complex monitoring than standard index analysis
- Creator notes that his own failed Tesla descending triangle short was stopped out 30 cents from the high, illustrating execution risk in volatile conditions
- The thesis that semis will form a daily higher low is contingent on Monday/Tuesday action; if that fails the next nearest support zone is distant -
Actionable Trading/Allocation Plan (🎯):
- Verify whether SMH, MU, and DRAM establish a daily higher low on the chart by Monday/Tuesday close relative to Friday's low
- Monitor FOMC statement and rate-hike probability changes from 34% as a catalyst for metals and broader index direction
- Track MAGS and IGV for weekly higher-low formation into August as a signal that Nasdaq tightening remains intact
- Watch XLF for a break below neckline if the head-and-shoulders pattern completes, versus a continuation of a weekly bull flag
- Check gold for daily uptrend confirmation (close above recent high) as a proxy for the metals' correlation shift
- Track daily RSI on QQQ and SMH to detect any move into daily oversold territory, which the creator would use to plan bounce trades

-
Creator Horizon Category (⏱️): Long-Horizon Macro — The creator frames the erosion of private property rights as a long-term structural transition toward tyranny, not a short-term market event.
-
One-Line Thesis (💡): The creator claims that increasing tolerance for eviction-related violence and socialist principles represents a cascading erosion of private property rights, which they argue is the foundational liberty of the United States, and that this shift will inevitably lead to a tyrannical system resembling a 'great American politburo.'
-
Key Data Points (📊):
- JQA quote: 'The moment the idea is admitted into society that property is not as sacred as the laws of God, and that there is not a force of law and public justice to protect it, anarchy and tyranny commence.'
- Creator states: 'Private property rights are the foundations of liberty in America.'
- Creator states: 'All anarchies end up in tyranny.'
- Creator labels the policy framework as: 'socialist principles' and 'this kind of great American politburo.'
- Creator identifies the justification: 'The first framing is that the private property owner is evil, and that the private property owner has committed an act of injustice.' -
Technical Levels & Setups OR Macro Drivers (📌):
- The creator identifies 'the Mom and Daddy administration emboldening us' as a policy driver that reduces tolerance for evictions as 'business as usual.'
- The creator argues that moralistic framing ('we are good, you are bad') is the catalyst used to justify property confiscation.
- The creator asserts that even tiny erosions of private property rights create a 'cascading effect' toward tyranny. -
Risk/Reward Framework (⚖️):
- Entry: Not established by the available evidence.
- Stop: Not established by the available evidence.
- Targets: Not established by the available evidence.
- Risk/Reward: Not established by the available evidence.
- Position Size: Not established by the available evidence.
- Probability: Not established by the available evidence. -
Scenario Analysis (🔄):
| Scenario | Probability | Target | Trigger |
|---|---|---|---|
| Bull | Not established by the available evidence. | Not established by the available evidence. | Evidence that the 'Mom and Daddy administration' reverses policies that tolerate eviction violence, and private property rights are restored. |
| Base | Not established by the available evidence. | Not established by the available evidence. | The current policy trajectory continues with incremental erosion of property rights via moralistic justifications, consistent with the creator's narrative. |
| Bear | Not established by the available evidence. | Not established by the available evidence. | Outright confiscation of private property escalates into the 'great American politburo' described, fulfilling the creator's worst-case projection. | -
Risk Factors (⚠️):
- The evidence contains no data on actual eviction violence rates, property confiscation policies, or legislative actions, making the claim unverifiable.
- The creator's reliance on a John Quincy Adams quote is an appeal to authority without contemporary context or source verification.
- The thesis conflates anecdotal acts of violence with systematic government policy, a claim not supported by the evidence presented.
- No specific tickers, asset classes, or market instruments are mentioned, limiting direct financial applicability. -
Actionable Trading/Allocation Plan (🎯):
- Cross-reference the John Quincy Adams quote for exact date and document context to verify accuracy of attribution.
- Identify specific eviction-related policies proposed or enacted by the 'Mom and Daddy administration' (likely the Biden administration) and track their legislative status.
- Monitor data on eviction violence incidents from credible sources (e.g., HUD reports, local law enforcement statistics) to assess whether the claimed emboldening is measurable.
- Track any proposed legislation that redefines or limits private property rights at state or federal level to gauge alignment with the creator's 'transition' narrative.

-
Creator Horizon Category (⏱️): Short-Term Technical — The podcast centers on an ongoing policy debate (White House considering banning Chinese open-source AI models) and immediate market reactions, with a Polymarket probability of 45% for a ban in 2026.
-
One-Line Thesis (💡): The All-In Podcast claims that U.S. frontier labs (Anthropic, OpenAI) are using regulatory-capture arguments about Chinese distillation to pressure the government into banning open-source models, which the hosts argue would harm U.S. competitiveness and the broader AI ecosystem.
-
Key Data Points (📊):
- Kimmy K3 (Moonshot AI) is an open-source model with performance "on par" with Opus 4.8 and GPT 5.6, at "about 50% cheaper" — claim.
- Polymarket market: 45% chance U.S. government bans an open-source model in 2026 (started at 22% days prior) — claimed.
- Anthropic ARR: $10B at start of year, now over $70B ARR (mid-year), forecast to reach $100B by year-end — claim by host Sax.
- Anthropic settled AI copyright lawsuit for $1.5 billion, largest copyright settlement in U.S. history — claim.
- Google Cloud on $100B run rate; Google capex forecast $195–205B for current year — claim.
- Tesla capex surged 140% YoY; expects $25B in capex — claim.
- China has 200 billion sq ft of manufacturing capacity; U.S. has 10 billion sq ft — claim by host Freeberg. -
Technical Levels & Setups OR Macro Drivers (📌):
- White House internal debate: Axios reported consideration of banning Chinese open-source models; Howard Letic (Wired) reportedly opposes a ban — claim.
- Anthropic's blog post in February coined 'industrial-scale distillation attacks' — claim by host Sax.
- Anthropic's claim that Moonshot AI distilled from its Fable model — claimed by Michael Katzio (friend of the show).
- Host Freeberg argues that open-source AI will diffuse economic value broadly, preventing wealth concentration in a few companies — claim. -
Risk/Reward Framework (⚖️):
- Entry: Not established by the available evidence.
- Stop: Not established by the available evidence.
- Targets: Not established by the available evidence.
- Risk/Reward: Not established by the available evidence.
- Position Size: Not established by the available evidence.
- Probability: Not established by the available evidence. -
Scenario Analysis (🔄):
| Scenario | Probability | Target | Trigger |
|---|---|---|---|
| Bull | Not established by the available evidence. | Not established by the available evidence. | If the White House decides against banning open-source models, as host Sax expects based on Trump's 'lighter regulation' instincts. |
| Base | Not established by the available evidence. | Not established by the available evidence. | If the debate continues without immediate action, with Polymarket probability at 45% for a 2026 ban and ongoing 'palace intrigue' inside the White House. |
| Bear | Not established by the available evidence. | Not established by the available evidence. | Verify the trigger against the source evidence. | -
Risk Factors (⚠️):
- Key claims (e.g., model performance parity, revenue figures) are based on third-party estimates or host statements, not independently verified data.
- The hosts have potential conflicts: Chamath is CEO of 8090 (an AI infrastructure company that benefits from open-source adoption); their views may reflect personal financial interests.
- The claim that Anthropic and OpenAI did not publicly label Chinese distillation as IP theft for legal consistency is an inference by host Sax, not a confirmed fact.
- The Polymarket probability (45% ban in 2026) is a speculative market, not a verified forecast. -
Actionable Trading/Allocation Plan (🎯):
- Monitor White House statements and official policy proposals regarding Chinese open-source AI models.
- Verify Anthropic and OpenAI revenue claims against any publicly reported financial statements or SEC filings.
- Track the outcome of copyright lawsuits (e.g., New York Times vs. OpenAI, music industry cases) to assess legal precedents for AI training data use.
- Observe the Polymarket probability on an open-source ban in 2026 for sentiment shifts.
- Independently assess whether Kimmy K3's performance benchmarks match the claims of parity with Opus 4.8 and GPT 5.6 using public third-party evaluations.

-
Creator Horizon Category (⏱️): Short-Term Technical — The video title references 'weekly resistance' and recent price action on BTC, NASDAQ, and altcoins, indicating a short-term technical focus.
-
One-Line Thesis (💡): BTC rejected from a key weekly resistance level, and the video assesses current standing in NASDAQ, BTC, and altcoins in the context of that rejection.
-
Key Data Points (📊):
- BTC rejected initially from key resistance
- BTC weekly resistance is a central focus of the video
- NASDAQ and altcoins are also mentioned as part of the market check -
Technical Levels & Setups OR Macro Drivers (📌):
- BTC price action at weekly resistance level
- NASDAQ performance as a potential macro influence
- Altcoin market dynamics as part of the broader crypto assessment -
Risk/Reward Framework (⚖️):
- Entry: Not established by the available evidence.
- Stop: Not established by the available evidence.
- Targets: Not established by the available evidence.
- Risk/Reward: Not established by the available evidence.
- Position Size: Not established by the available evidence.
- Probability: Not established by the available evidence. -
Scenario Analysis (🔄):
| Scenario | Probability | Target | Trigger |
|---|---|---|---|
| Bull | Not established by the available evidence. | Not established by the available evidence. | BTC holds above or reclaims the key weekly resistance level |
| Bear | Not established by the available evidence. | Not established by the available evidence. | BTC continues to reject from weekly resistance and breaks below a support level | -
Risk Factors (⚠️):
- The creator's claim of a 'key weekly resistance' level is not defined numerically in the evidence, making independent verification of the precise level impossible.
- No specific altcoin names or price levels are given, limiting verification of the altcoin portion of the analysis.
- The NASDAQ relationship is asserted but no specific index level or correlation metric is provided. -
Actionable Trading/Allocation Plan (🎯):
- Monitor BTC price action around the weekly resistance level mentioned by the creator; the exact price must be identified from the video visual or subsequent data.
- Review NASDAQ index price behavior for any divergence or confirmation relative to BTC.
- Track altcoin market capitalization or specific high-cap altcoins for alignment with the creator's assessment.

-
Creator Horizon Category (⏱️): Long-Horizon Macro — Baron's stated horizon is 5-10 years and the discussion centers on multi-decade holdings in Tesla, SpaceX, and other long-duration growth equities.
-
One-Line Thesis (💡): Baron Capital's long-term, buy-and-hold investment philosophy driven by proprietary research, conviction in visionary founders (especially Elon Musk), and a portfolio structure that blends concentrated high-conviction bets with steady-growth compounders is claimed to have produced top-decile relative returns and $70 billion in client profits over four decades.
-
Key Data Points (📊):
- 15 funds representing 96.2% of Baron Funds AUM have outperformed their benchmarks; 13 funds (95.4% of AUM) rank in the top 20% of Morningstar categories. — Host citing fund data
- Tesla investment (2014-2016, average cost ~$14 split-adjusted) produced $7.7 billion in profit on $400 million invested. — Baron
- The firm added $5 billion in software positions over the past year, including FactSet (FDS), whose stock fell from 500 to 200 and is now ~250. — Baron
- Grok's model usage is 65% cheaper than Anthropic's Claude. — Baron
- Portfolio turnover is <10% across virtually all funds; Partners Fund turnover <5%. — Baron
- Baron and family own approximately 11-12% of the funds' assets. — Baron -
Technical Levels & Setups OR Macro Drivers (📌):
- Tesla vertical integration and mission shift from hardware (EVs) to software (robotaxi, Optimus robots): capacity for 10M-100M robots/year in Texas. — Baron
- FactSet: new CEO (former JPMorgan executive) embedding services into client workflows, with proprietary data sets that AI LLMs may need to license. — Baron
- Grok catching up to Anthropic in model capability within 5-6 months, while being 65% cheaper. — Baron
- Baron Capital's underweight in mega-cap tech relative to broad market indexes, emphasizing non-correlated growth holdings (e.g., homebuilding, hotels, animal health, uniform rental). — Baron -
Risk/Reward Framework (⚖️):
- Entry: Not established by the available evidence.
- Stop: Not established by the available evidence.
- Targets: Henry Fernandez (MSCI) personal view: $100 million loan would be worth $400-500 million in 10 years.
- Risk/Reward: Not established by the available evidence.
- Position Size: Not established by the available evidence.
- Probability: Not established by the available evidence. -
Scenario Analysis (🔄):
| Scenario | Probability | Target | Trigger |
|---|---|---|---|
| Bull | Not established by the available evidence. | Not established by the available evidence. | Verify the trigger against the source evidence. |
| Base | Not established by the available evidence. | Not established by the available evidence. | Tesla maintains ~5M vehicle/year run-rate with gradual robotaxi adoption; SpaceX continues to win fixed-price government contracts and grow Starlink revenue; Baron's software holdings (FactSet, MSCI) recover to previous highs as AI fears moderate. |
| Bear | Not established by the available evidence. | Not established by the available evidence. | Elon Musk's government role or public persona creates regulatory/political headwinds for Tesla/SpaceX; competition from Chinese EVs erodes Tesla's margin; a major Starship failure or loss of compute revenue; systemic AI disruption to FactSet/MSCI's data moat. | -
Risk Factors (⚠️):
- Valuation risk: Baron's $20-40 trillion SpaceX target implies a market cap exceeding the entire S&P 500 (currently ~$70-80 trillion), without evidence of a plausible path to that scale within 15 years.
- Liquidity risk: SpaceX remains largely private; Baron could not exit fully even if desired, as evidenced by its history of buying in 27 tenders.
- FactSet and MSCI face potential AI disruption that Baron's proprietary-data moat argument may not fully counter; the stocks have already declined significantly (FactSet from 500 to 200).
- Baron's long-horizon strategy is not suited for investors requiring near-term liquidity; turnover rates <5% mean the fund may not adapt quickly to regime changes.
- The Colossus compute cluster revenue projections ($25-30B annualized) are based on current customer contracts that could be renegotiated or not renewed.
- The firm's AUM and performance data are self-reported; the host's fund data citations should be cross-referenced with independent Morningstar and SEC filings.
- No stop-loss or risk-management framework is disclosed; the investment process relies entirely on conviction and long-term holding. -
Actionable Trading/Allocation Plan (🎯):
- Confirm Baron Capital's AUM ($70B) and performance rankings via latest Morningstar and SEC filings (N-PORT, NPX).
- Track FactSet (FDS) quarterly earnings for evidence of data-embedding and AI-related contract wins after new CEO transition.
- Monitor Colossus compute cluster revenue disclosures by Anthropic and Google; verify pricing premium claims against CoreWeave or AWS pricing.
- Review Baron's annual 13F-HR for changes in top holdings (especially MSCI, FactSet) and verify turnover rate consistency.
-
Creator Horizon Category (⏱️): Short-Term Technical — The video is explicitly described as a pre-market technical analysis for futures and options traders, with a live format for that trading day.
-
One-Line Thesis (💡): The creator claims that Intel earnings are 'CURSED By Cramer' and that markets are opening flat, with the session intended for pre-market technical analysis.
-
Key Data Points (📊):
- Title states 'Intel Earnings CURSED By Cramer' – no further details on the claim.
- Title states 'Markets Open Flat' – no specific index or level provided.
- The video is for 'pre market technical analysis for futures traders and options traders'.
- Description includes a disclaimer that the information is for informational purposes only and not financial or legal advice. -
Technical Levels & Setups OR Macro Drivers (📌):
- Intel earnings event is cited as a market driver, though no specific data on earnings results or the nature of the 'curse' is provided.
- Creator frames the market state as 'flat' without specifying indices or price levels. -
Risk/Reward Framework (⚖️):
- Entry: Not established by the available evidence.
- Stop: Not established by the available evidence.
- Targets: Not established by the available evidence.
- Risk/Reward: Not established by the available evidence.
- Position Size: Not established by the available evidence.
- Probability: Not established by the available evidence. -
Scenario Analysis (🔄):
| Scenario | Probability | Target | Trigger |
|---|---|---|---|
| Bull | Not established by the available evidence. | Not established by the available evidence. | Not established by the available evidence. |
| Base | Not established by the available evidence. | Not established by the available evidence. | Not established by the available evidence. |
| Bear | Not established by the available evidence. | Not established by the available evidence. | Not established by the available evidence. | -
Risk Factors (⚠️):
- The claim about Intel earnings being 'cursed' by Cramer is unsupported by any evidence in the video or description, making it unverifiable.
- No specific market index, price levels, or technical patterns are provided, reducing actionable detail.
- The video is live and unstructured, so any quantitative claims about market direction or trade setups are absent from the provided metadata-only evidence. -
Actionable Trading/Allocation Plan (🎯):
- Review the full video to extract any specific levels, strategies, or trade setups the creator may have discussed beyond the title and description.
- Verify the actual Intel earnings release and any commentary from Jim Cramer referenced, if possible, to assess the validity of the 'cursed' claim.
- Monitor market open action on the publication date to compare with the creator's 'markets open flat' description for any deviation.

-
Creator Horizon Category (⏱️): Short-Term Technical — The video is a live trading stream focused on intraday market movements and the immediate impact of Intel's news, oil volatility, and rate hike odds ahead of the Fed meeting next week.
-
One-Line Thesis (💡): Intel's positive momentum temporarily buoyed the market, but oil volatility and rising rate hike odds are adding pressure across sectors ahead of the Federal Reserve meeting next week.
-
Key Data Points (📊):
- Title claims Intel (INTC) 'saved the market' for an hour on July 24.
- Description cites 'INTC keeps the momentum AI dream alive' as a catalyst.
- Description notes 'oil volatility and rate hike odds add pressure' across markets ahead of the Fed next week.
- Disclaimer states the stream is for educational purposes only and that options trading is risky, with potential loss of most or all initial investment. -
Technical Levels & Setups OR Macro Drivers (📌):
- INTC news/price action maintaining the AI momentum narrative.
- Oil volatility creating cross-asset pressure.
- Increasing odds of a rate hike ahead of the Fed meeting next week. -
Risk/Reward Framework (⚖️):
- Entry: Not established by the available evidence.
- Stop: Not established by the available evidence.
- Targets: Not established by the available evidence.
- Risk/Reward: Not established by the available evidence.
- Position Size: Not established by the available evidence.
- Probability: Not established by the available evidence. -
Scenario Analysis (🔄):
| Scenario | Probability | Target | Trigger |
|---|---|---|---|
| Bull | Not established by the available evidence. | Not established by the available evidence. | Sustained INTC strength on AI momentum outweighing macro headwinds. |
| Base | Not established by the available evidence. | Not established by the available evidence. | Market remains range-bound as oil volatility and rate-hike fears offset Intel-led optimism. |
| Bear | Not established by the available evidence. | Not established by the available evidence. | Oil volatility intensifies or rate hike odds increase significantly, overwhelming INTC-driven gains. | -
Risk Factors (⚠️):
- INTC's positive effect on the market is described as lasting only one hour, suggesting fleeting impact.
- Oil volatility is an unspecified risk that could quickly shift market direction.
- Rate hike odds are a known but unquantified headwind ahead of the Fed meeting.
- The video's title is exaggerated ("saved the market") and may not reflect sustained market conditions. -
Actionable Trading/Allocation Plan (🎯):
- Monitor INTC price action and news flow for continuation of AI-momentum catalyst.
- Track crude oil prices and volatility indices for signs of oil-driven market stress.
- Watch Fed meeting expectations via CME FedWatch or similar tools to assess rate hike probability changes.
- Verify the claim that Intel's move 'saved the market' by comparing INTC's intraday performance to broad market indices (e.g., SPX, NDX) on July 24.

-
Creator Horizon Category (⏱️): Long-Horizon Macro — The creator asserts an ongoing structural shift to fiscal dominance and a structurally more inflationary era, not a short-term tactical call.
-
One-Line Thesis (💡): The creator claims the market has entered an era of fiscal dominance where rate scares replace growth scares, making bonds unattractive because the implied inflation breakeven of 2.3% is too low relative to a rising 5-year inflation rate.
-
Key Data Points (📊):
- Break-even spread / implied inflation rate at 2.3% -
Technical Levels & Setups OR Macro Drivers (📌):
- Fiscal dominance: fiscal policy, not monetary policy, now drives rate moves. -
Risk/Reward Framework (⚖️):
- Entry: Not established by the available evidence.
- Stop: Not established by the available evidence.
- Targets: Not established by the available evidence.
- Risk/Reward: Not established by the available evidence.
- Position Size: Not established by the available evidence.
- Probability: Not established by the available evidence. -
Scenario Analysis (🔄):
| Scenario | Probability | Target | Trigger |
|---|---|---|---|
| Base | Not established by the available evidence. | Not established by the available evidence. | Verify the trigger against the source evidence. |
| Bear | Not established by the available evidence. | Not established by the available evidence. | Verify the trigger against the source evidence. |
| Bull | Not established by the available evidence. | Not established by the available evidence. | Verify the trigger against the source evidence. | -
Risk Factors (⚠️):
- The creator's view depends on the 'fiscal dominance' framework; if fiscal policy shifts toward austerity or monetary policy regains primacy, the thesis invalidates.
- The 5-year inflation rate is a trailing average; forward-looking surveys or market-based inflation expectations could fall, making the 2.3% breakeven plausible.
- The creator does not provide specific catalysts or timing for when inflation will force a repricing of breakevens; the thesis lacks a concrete trigger.
- No explicit asset, ticker, or trade structure is named, only a macro view on real and nominal yields. -
Actionable Trading/Allocation Plan (🎯):
- Track the 5-year breakeven inflation rate and compare it to the 5-year trailing inflation rate to assess whether the market is pricing in the creator's implied 'too low' level.
- Follow TIPS real yields to see if the current 2.3% real yield declines or continues to rise, indicating a change in real growth or inflation expectations.

-
Creator Horizon Category (⏱️): Long-Horizon Macro / Structural — The discussion focuses on a long-term shift in the growth-stock classification of major AI players, not a short-term technical trade.
-
One-Line Thesis (💡): The creators endorse a 19-year-old investor's view that Microsoft and Nvidia no longer qualify as aggressive high-risk growth stocks, implying a structural maturation or rotation out of mega-cap AI leaders.
-
Key Data Points (📊):
- Davis Cantrell, a 19-year-old college student near Atlanta, has invested for roughly two years and trimmed his Microsoft holdings.
- Davis Cantrell said: 'I just don't see Microsoft and Nvidia fitting into that category anymore' (the category being aggressive, high-risk growth stocks). -
Technical Levels & Setups OR Macro Drivers (📌):
- Shift in growth-stage classification: The creators agree that Microsoft and Nvidia no longer fit the aggressive high-risk growth stock label, suggesting a secular move toward lower-growth, more stable profiles. -
Risk/Reward Framework (⚖️):
- Entry: Not established by the available evidence.
- Stop: Not established by the available evidence.
- Targets: Not established by the available evidence.
- Risk/Reward: Not established by the available evidence.
- Position Size: Not established by the available evidence.
- Probability: Not established by the available evidence. -
Scenario Analysis (🔄):
| Scenario | Probability | Target | Trigger |
|---|---|---|---|
| Bull | Not established by the available evidence. | Not established by the available evidence. | Further rotation out of mega-cap AI names (MSFT, NVDA) into smaller, higher-risk growth stocks accelerates, confirming the creators' endorsement of Davis Cantrell's thesis. |
| Base | Not established by the available evidence. | Not established by the available evidence. | The market re-rates MSFT and NVDA as core holdings with moderate growth, and the creators' agreement with the classification shift stands without additional price action or active portfolio changes. |
| Bear | Not established by the available evidence. | Not established by the available evidence. | MSFT or NVDA resume outsized growth or regain high-risk-premium status (e.g., via new breakthrough products or earnings acceleration), contradicting the claim that they no longer fit the aggressive-growth category. | -
Risk Factors (⚠️):
- The evidence is a single quote from an unnamed source (Davis Cantrell) read and discussed; the creators do not present independent financial analysis or verification of the claim's accuracy.
- No specific ticker, valuation, or earnings data is provided to support the thesis that MSFT and NVDA are no longer aggressive high-risk growth stocks.
- The transcript includes one creator's joke 'It sounds like this was AI' — introducing a potential credibility ambiguity about whether the quote was real or fabricated; another creator confirms 'that's a real guy,' but the verification is only conversational.
- No timeframe, catalyst, or entry/exit criteria are given; the thesis is purely qualitative. -
Actionable Trading/Allocation Plan (🎯):
- Monitor forward revenue growth rates and R&D spending ratios for MSFT and NVDA relative to smaller AI-focused companies to assess whether the growth-stage classification shift is quantitatively supported.
- Track institutional positioning data (e.g., 13F filings) for MSFT and NVDA to see if a rotation out of these names into higher-beta AI plays is actually occurring.
- Verify the identity and portfolio history of Davis Cantrell via public sources (e.g., social media, interviews) to confirm the quote's authenticity and context.
-
Creator Horizon Category (⏱️): Short-Term Technical — The creator discusses a recent market rotation and margin wipeout in May and June, with immediate follow through seen in the rally of former leaders, indicating a short-term technical resolution.
-
One-Line Thesis (💡): The creator argues that the simultaneous selloff of the leading, most speculative sector alongside a broad market that did not decline, followed by a rally in former leaders, is an extremely bullish resolution of leverage and concentration risk.
-
Key Data Points (📊):
- The leadership group pukes — creator claims the largest sector, with the most speculative activity, 'gets absolutely taken to the cleaners.'
- The S&P 500 index doesn't budge — creator claims there was so much buying in almost all other sectors that the market held up.
- Margin wipeout occurred in May and June — creator says 'the crush from the Microns, the Intels. They sold the Ciena finally. They wiped out all of the hottest stocks.'
- The rally in former leaders resumed — creator states 'we go through a margin wipeout and then come out of the other side with a rally in the former leaders once again.'
- Specific sectors that bought the market: 'Energy stocks, staples, the drug makers, the biotechs, the banks.'
- Specific stocks mentioned as sold: 'Microns' (likely Micron Technology, MU), 'Intels' (likely Intel, INTC), 'Ciena' (CIEN). -
Technical Levels & Setups OR Macro Drivers (📌):
- The creator identifies the rotation out of the hottest tech/speculative names and into non-tech sectors (energy, staples, drug makers, biotechs, banks) as the mechanism that kept the S&P 500 flat.
- The creator describes the sequence as a 'bullish resolution' of leverage built up in a narrow area that had become 'the whole market' in May and June.
- The creator invokes the 'Avengers Infinity War' analogy: the original leaders are temporarily out of the game, then a 'cavalry' of other sectors arrives, and finally the former leaders rally again. -
Risk/Reward Framework (⚖️):
- Entry: Not established by the available evidence.
- Stop: Not established by the available evidence.
- Targets: Not established by the available evidence.
- Risk/Reward: Not established by the available evidence.
- Position Size: Not established by the available evidence.
- Probability: Not established by the available evidence. -
Scenario Analysis (🔄):
| Scenario | Probability | Target | Trigger |
|---|---|---|---|
| Bull | Not established by the available evidence. | Not established by the available evidence. | The creator's central thesis: if the market internals have broadened, margin was wiped out, and former leaders rally again, then the setup is extremely bullish. No specific invalidation trigger for the bull case is given. |
| Base | Not established by the available evidence. | Not established by the available evidence. | Not established by the available evidence. |
| Bear | Not established by the available evidence. | Not established by the available evidence. | The creator rhetorically questions anyone who would view the described events as bearish, implying that a bearish interpretation would require a different reading of the same data. No explicit bear trigger is provided. | -
Risk Factors (⚠️):
- The quoted evidence is purely interpretive and retrospective — no forward-looking prices, levels, or timeframes are given to falsify the claim.
- The creator uses rhetorical questions and analogies rather than data to support the bullish thesis — the claim that the S&P 500 did not budge is unverified and may rely on a specific lookback window.
- The terms 'margin wipeout,' 'leadership group pukes,' and 'rally in former leaders' are not quantified by the creator — no specific stock prices or index levels are cited.
- The creator's claim that the rotation was broad across 'almost all of the other sectors' is not supported by sector-level data in the evidence. -
Actionable Trading/Allocation Plan (🎯):
- Identify the specific stocks and sectors the creator refers to as 'the largest sector' and 'hottest stocks' (e.g., semiconductors, AI hardware) and measure their drawdown during the alleged wipeout.
- Track subsequent performance of the 'former leaders' (Micron, Intel, Ciena) and the listed cavalry sectors (energy, staples, biotechs, banks) to see if the rally described occurred.
-
Creator Horizon Category (⏱️): Short-Term Technical — The video is a pre-market technical analysis session for futures and options traders, focused on the upcoming trading day.
-
One-Line Thesis (💡): Trade Brigade presents a live pre-market preparation session emphasizing a gap-down scenario linked to earnings and CAPEX punishment, with Intel (INTC) highlighted as a key event after-hours that day.
-
Key Data Points (📊):
- Title includes 'GAP DOWN – Earnings CAPEX Punishment... INTC Tonight'
- Description states the video provides 'pre market technical analysis for futures traders and options traders'.
- Video is live every trading day at 8:00 AM EST.
- The channel offers a technical analysis course, trading scripts, and a swing trade newsletter.
- The disclaimer states the content is for informational purposes only, not financial or legal advice. -
Technical Levels & Setups OR Macro Drivers (📌):
- Earnings and CAPEX punishment cited as a catalyst for a gap-down open.
- Intel (INTC) is mentioned as reporting earnings 'Tonight' (the day of the video). -
Risk/Reward Framework (⚖️):
- Entry: Not established by the available evidence.
- Stop: Not established by the available evidence.
- Targets: Not established by the available evidence.
- Risk/Reward: Not established by the available evidence.
- Position Size: Not established by the available evidence.
- Probability: Not established by the available evidence. -
Scenario Analysis (🔄):
| Scenario | Probability | Target | Trigger |
|---|---|---|---|
| Bear | Not established by the available evidence. | Not established by the available evidence. | A gap down pre-market open attributed to earnings and CAPEX punishment is explicitly cited by the creator as the current setup. | -
Risk Factors (⚠️):
- The video is purely a live pre-market technical analysis session; no specific price levels, entry/exit plans, or risk parameters are provided in the evidence.
- The headline 'GAP DOWN – Earnings CAPEX Punishment' is a directional claim without supporting data on magnitude or duration in the metadata.
- No verification of actual pre-market price action or Intel's earnings results is available from the evidence alone. -
Actionable Trading/Allocation Plan (🎯):
- Monitor pre-market price action and volume for the gap-down condition cited by the creator.
- Verify Intel's (INTC) earnings report and any CAPEX-related guidance after the close on the publication date.
- Review the creator's technical analysis course and trading scripts for additional context on their analytical framework.

-
Creator Horizon Category (⏱️): Short-Term Technical — The creator focuses on intraday and daily price action, sector rotations, and immediate reactions to earnings and capex guidance.
-
One-Line Thesis (💡): The S&P 500 (SPY) and Nasdaq (QQQ) are in neutral-to-bearish daily trends post-earnings, with rejected breakouts and overhead supply, making a 'less is more' approach appropriate until clearer directional confirmation emerges.
-
Key Data Points (📊):
- SPY daily trend is neutral; it is not in a daily uptrend and has set a potential lower high inside a range while still above the daily 20 SMA and 50 SMA.
- QQQ is in a downtrend with a lower low on the daily chart; it remains below a flattening 50 SMA and a declining 20 SMA.
- S&P 500 key support level is 739.65 (top end of the Korea gap); the market has not broken substantially below this level.
- S&P 500 intraday anchored VWAP from the 'ceasefire over situation' (3 weeks ago) is overhead; a cluster of anchored VWAPs sits below price.
- Google (GOOGL) reported 82% cloud growth but is trading lower post-earnings on higher capex guidance; Tesla (TSLA) gapped down after citing massive capex.
- Semiconductor ETF (SMH) shows a potential 'oopsy daisies' pattern reclaiming the breakdown neckline; Nvidia (NVDA) is a key watch.
- Financials (XLF) show a bull flag; JPMorgan, Goldman Sachs, and Bank of America are highlighted as winners.
- MSTR is a potential long on relative Bitcoin strength, with a possible ascending triangle breakout near equal highs.
- Irene (IREN) is a short setup under two equal lows, rejecting the 20 SMA; Wolf (WOLF) is a similar short setup targeting the 200 SMA.
- Market internals in SPY and QQQ show weak cumulative tick, weak advance/decline lines, and volume outflows on the day.
- Market profile: SPY value tried to progress higher but failed to stay at highs; QQQs value area is overlapping to down.
- Fed expectations point to 'higher for longer,' with inverted ZT rates indicating no near-term rate cuts.
- Crude oil sensitivity to Middle East headlines makes energy (XLE) a sector the creator avoids.
- Software names (CRM, WDAY, ORCL) are described as underperforming; cybersecurity names like CRWD and PANW show breakdowns.
- Bitcoin is showing relative strength compared to the Nasdaq during the downdraft. -
Technical Levels & Setups OR Macro Drivers (📌):
- MAG7 components (especially GOOGL and TSLA) are heavy index weights; their post-earnings weakness pressures the S&P 500 and QQQ.
- Semiconductor strength (MU, SMH, NVDA) may offset MAG7 weakness but is not sufficient alone to lift the broad market.
- Financials (XLF, JPM, GS, BAC) are showing bullish structure and may help buoy the S&P 500.
- Daily trend for SPY is now neutral; failing breakouts and rejection of overhead supply suggest cautious positioning.
- QQQ is in a downtrend with a potential lower high; a reclaim of 700 (missing context: likely QQQ level, but creator states 'over 700' and '707' as key) is needed for constructive momentum.
- MSTR: potential ascending triangle breakout on hourly higher lows above equal highs, driven by Bitcoin relative strength.
- Irene (IREN): short setup under equal lows after rally rejection at the 20 SMA; Google's use of third-party data centers may be a catalyst.
- Wolf (WOLF): short setup on rallies into 20 SMA and the $22 round number, targeting the 200 SMA.
- Tesla (TSLA): post-earnings gap down; creator looks for gap-fill reversal short if a rally rejects 368.
- Google (GOOGL): post-earnings gap down; creator notes gap rules will be in play, looking for potential double bottom or failure at the overnight low. -
Risk/Reward Framework (⚖️):
- Entry: Not established by the available evidence.
- Stop: Not established by the available evidence.
- Targets: Not established by the available evidence.
- Risk/Reward: Not established by the available evidence.
- Position Size: Not established by the available evidence.
- Probability: Not established by the available evidence. -
Scenario Analysis (🔄):
| Scenario | Probability | Target | Trigger |
|---|---|---|---|
| Bull | Not established by the available evidence. | Not established by the available evidence. | SPY finds acceptance over 749s (from creator: 'if the market can finally find acceptance over 749s'); or QQQ reclaims 700/707 and builds hourly higher lows to reverse the downtrend. |
| Base | Not established by the available evidence. | Not established by the available evidence. | SPY remains between the rock (overhead supply) and the hard place (support at 739.65) without a decisive break in either direction, and QQQ continues to trade in a balancing range. |
| Bear | Not established by the available evidence. | Not established by the available evidence. | Verify the trigger against the source evidence. | -
Risk Factors (⚠️):
- Overhead supply rejection in SPY and QQQ may lead to further downside if the market fails to reclaim key levels.
- MAG7 earnings disappointment (especially GOOGL, TSLA) could continue to weigh on indices despite strength in semiconductors.
- Higher-for-longer Fed expectations and rising rates (inverted ZT) may dampen risk appetite, creating a headwind for equities.
- Geopolitical tensions in the Middle East impact energy and broader market sentiment; crude oil sensitivity makes XLE difficult to trade.
- Market breadth is weak; cumulative tick, advance/decline lines, and volume flows do not support a sustainable rally at current levels.
- Neutral trend and low volatility (VIX complacency) create risk of a volatility expansion (sharp move) to either side, invalidating the neutral stance. -
Actionable Trading/Allocation Plan (🎯):
- Monitor SPY's price action relative to 739.65 support; a breakdown below this level would confirm a bearish tilt.
- Watch QQQ for a reclaim of the 700/707 level; inability to hold these would signal continued downtrend pressure.
- Track GOOGL and TSLA post-earnings price action to assess whether MAG7 selling persists or stabilizes.
- Monitor MSTR for a breakout above its equal highs; Bitcoin's relative strength vs. the QQQ is a supporting condition.
- Track IREN and WOLF for short entries on rallies to 20 SMA/resistance levels, targeting the 200 SMA.
- Review Thursday morning jobless claims and Friday PMIs for impact on rate expectations and market direction.
- Check VIX and futures curve structure for signs of volatility expansion, which could precede a directional move.

-
Creator Horizon Category (⏱️): Short-Term Technical — The stream covers live trading and immediate reaction to GOOGL earnings and guides, plus INTC earnings due after hours the same day.
-
One-Line Thesis (💡): The creator claims that GOOGL's earnings beat and guidance for higher capital expenditure is sending chip stocks higher, yet those stocks remain under pressure as investors decide whether to reward the demand chase.
-
Key Data Points (📊):
- GOOGL beats and guides CAPEX higher — as stated in the video description.
- INTC reports earnings after hours on July 23 — as stated in the video description.
- Stock Market Live stream title includes "CAPEX CONTINUES - INTC EARNINGS LIVE" indicating the focus on capital expenditure trends and Intel's upcoming report.
- Creator trades on three platforms: E*TRADE Pro (screen shown), ThinkOrSwim (long-term investing), Fidelity (long-term) — as stated in the stream description. -
Technical Levels & Setups OR Macro Drivers (📌):
- GOOGL earnings beat and higher CAPEX guidance is a macro driver for semiconductor stocks, with the creator noting shares are still under pressure from investor indecision on rewarding the demand chase.
- INTC earnings after hours on July 23 is a major catalyst for the session and for chip sector sentiment. -
Risk/Reward Framework (⚖️):
- Entry: Not established by the available evidence.
- Stop: Not established by the available evidence.
- Targets: Not established by the available evidence.
- Risk/Reward: Not established by the available evidence.
- Position Size: Not established by the available evidence.
- Probability: Not established by the available evidence. -
Scenario Analysis (🔄):
| Scenario | Probability | Target | Trigger |
|---|---|---|---|
| Bull | Not established by the available evidence. | Not established by the available evidence. | If investors broadly decide to reward the demand chase from GOOGL's CAPEX guide, chip stocks could rally and break the current pressure. |
| Base | Not established by the available evidence. | Not established by the available evidence. | Chip stocks continue to move higher but remain under pressure as the market digests the GOOGL CAPEX guide and awaits INTC earnings. |
| Bear | Not established by the available evidence. | Not established by the available evidence. | Investors decide not to reward the demand chase, causing chip stocks to reverse and decline further, particularly if INTC earnings disappoint. | -
Risk Factors (⚠️):
- The creator's claim that chip stocks are 'under pressure' lacks specific price levels or technical support/resistance to verify.
- No quantification of the GOOGL earnings beat or CAPEX guidance amount is provided.
- No specific trade plan, entry, stop, or target for any position is disclosed for INTC or any ticker.
- The creator warns viewers not to copy trades, indicating that the live stream actions may not be suitable for others and carry risk. -
Actionable Trading/Allocation Plan (🎯):
- Verify GOOGL's actual EPS, revenue, and CAPEX guidance figures against the creator's claim of a beat and higher capex.
- Monitor INTC earnings release after hours on July 23 for actual results and forward guidance.
- Track the price action of major semiconductor ETFs (e.g., SMH) and individual chip stocks (INTC, NVDA, AMD) to confirm whether the 'under pressure' condition persists or resolves.
- Review the creator's longer-term investing content on the main channel for any structural theses about the capex cycle.

-
Creator Horizon Category (⏱️): Short-Term Technical — The creator focuses on daily and weekly EMA levels, rotation patterns, and immediate support/resistance levels for indices and individual securities, indicating a short-term trading horizon.
-
One-Line Thesis (💡): Rotation between semiconductors, financials, and healthcare is keeping the S&P 500 healthy, but semiconductors are in a contested zone where bears have not been able to turn prior support into resistance, and a weekly bounce for metals is starting to gain traction as the gold/ES ratio has broken above its daily 12 EMA for the first time in months.
-
Key Data Points (📊):
- S&P 500: 4-hour rising wedge being watched as a potential bearish pattern.
- QQQ: Clean double bottom with key support at 68637.
- SMH: Most important resistance at 61817.
- XLF/SPY ratio: At monthly 12 EMA, looking for a lower high.
- XLV: Daily EQ (higher low, lower high) wedge, bull flag potential above.
- IGV: Broke bearish today with 'big time downside' across software.
- MAGS: Weekly lower high set, macro rising wedge but room for weekly higher low.
- Microsoft, Palantir, Apple: Described as 'quite smoked' intraday.
- Google: After-hours down to new consolidation lows.
- Tesla: QQQ ratio rejected off weekly 12 EMA, back in doghouse; price near support at mid-330s.
- Gold: Bounced off demand area (value area low), pushed over 2-day 12 EMA.
- GDX/GLD ratio: Bullish ratio divergence (higher lows forming).
- Gold/Silver ratio: Double top at monthly resistance; daily stair step down.
- Palladium: Two-day uptrend confirmed, weekly inverse head and shoulders on deck.
- Silver: Falling wedge pattern.
- CVX: Swing report entry zone 180s-161, target 204 (now coming into play).
- INTC: Earnings tomorrow; prior support acting as resistance.
- LRCX: Support acting as resistance best among names.
- NVDA: Inverse head and shoulders, resistance at 215.
- AMD: Near all-time highs, continuing intra-sector rotation.
- AVGO: Bouncing from monthly 12 EMA, 2-day EQ pattern.
- Bitcoin: Rejecting weekly 12 EMA, weak 4-week corrective bounce.
- ETH: Yearly higher low forming vs BTC; quarterly 12 EMA resistance on ratio.
- Oil: Bounce from monthly 12 EMA; CVX swing report example.
- Gold/ES ratio break above daily 12 EMA: 'a large one for metals' – creator's words. -
Technical Levels & Setups OR Macro Drivers (📌):
- Rotation between XLF, XLV, and SMH is keeping S&P 500 in balance.
- Semiconductor (SMH) daily bounce after gap fill; bears failed to turn prior support into resistance.
- Gold/ES ratio up over daily 12 EMA signals metals rotation in favor of bulls.
- GDX/GLD bullish ratio divergence with higher lows on ratio despite lower lows on price.
- Gold/Silver ratio double top at monthly resistance, confirming technical boundaries.
- Palladium weakest off the top, now forming bottom with confirmed two-day uptrend.
- IGV daily EQ bear break increasing odds of weekly downtrend confirmation.
- Tesla QQQ ratio rejection off weekly 12 EMA keeps it in relative weakness.
- INTC earnings tomorrow a catalyst for semiconductor direction.
- LRCX and INTC showing prior support acting as resistance, bearish structural clue.
- NVDA inverse head and shoulders pattern deja vu with Google's prior failed neckline break.
- Bitcoin and Ethereum bounces described as weak, no weekly uptrend confirmed.
- Oil reactive approach: 12 EMA rider on multiple timeframes, waiting for weekly higher low. -
Risk/Reward Framework (⚖️):
- Entry: Not established by the available evidence.
- Stop: Not established by the available evidence.
- Targets: Not established by the available evidence.
- Risk/Reward: Not established by the available evidence.
- Position Size: Not established by the available evidence.
- Probability: Not established by the available evidence. -
Scenario Analysis (🔄):
| Scenario | Probability | Target | Trigger |
|---|---|---|---|
| Bull | Not established by the available evidence. | Not established by the available evidence. | Semiconductors form daily higher low and daily uptrend; SMH breaks 61817; metals get over 2-day 12 EMA; QQQ holds 68637 double bottom. |
| Bear | Not established by the available evidence. | Not established by the available evidence. | Semiconductor flush lows break; QQQ double bottom at 68637 breaks; IGV confirms weekly downtrend; XLF/SPY ratio loses daily 12 EMA; Google and Tesla continue to new lows. |
| Base | Not established by the available evidence. | Not established by the available evidence. | S&P 500 remains in balance (short off highs, long off lows); SMH and semiconductors chop in daily tightening range; metals fail to sustain daily uptrend but hold support. | -
Risk Factors (⚠️):
- INTC earnings tomorrow could shift semiconductor direction abruptly.
- Rotational dynamics may keep indices in balance, making directional trades low conviction.
- Gold/ES ratio break above daily 12 EMA is first domino in months but requires follow-through.
- Semiconductor bounce may fail if daily uptrend does not confirm; creator notes patience rather than early adoption.
- Bitcoin and Ethereum bounces described as weak; no weekly uptrend yet.
- Creator's gold/silver ratio double top at monthly resistance may break either way.
- Earnings season for semiconductors (INTC, LRCX, TSM, AMD) adds event risk.
- Creator explicitly states he is 'not bullish on semiconductors in the intermediate term' despite recent bounce. -
Actionable Trading/Allocation Plan (🎯):
- Monitor SMH daily for follow-through above 61817 or breakdown of flush lows.
- Watch QQQ 68637 level as double bottom support.
- Track gold/ES ratio for sustained daily 12 EMA hold.
- Monitor gold and silver for daily uptrend confirmation and sustained hold above 2-day 12 EMA.
- Watch IGV for confirmation of weekly downtrend (monthly lower high set).
- Monitor XLF/SPY ratio for loss of daily 12 EMA indicating relative weakness return.
- Follow INTC and LRCX earnings for directional catalyst in semiconductors.
- Track Bitcoin weekly 12 EMA for potential trend change signal; note creator's skepticism.
- Verify gold/silver ratio action: watch for daily lower high formation or breakdown.
- Assess Palladium two-day uptrend for confirmation of larger pivot.

-
Creator Horizon Category (⏱️): Short-Term Technical — The creator explicitly states the video focuses on 'technicals' and is published in real time during Tesla's Q2 earnings, indicating an intraday/short-term trading horizon for futures and options traders.
-
One-Line Thesis (💡): Trade Brigade provides live pre-market technical analysis for Tesla's Q2 earnings event, including the earnings call with Elon Musk, targeting futures and options traders with technical setups.
-
Key Data Points (📊):
- Title: '[LIVE] TESLA Q2 EARNINGS – Technicals & Elon Conference Call' — creator claims to analyze technicals during the earnings event.
- Description states 'We are live every trading day at 8:00 AM EST providing the best pre market technical analysis for futures traders and options traders.' — frames content as pre-market technical analysis.
- Offers a Technical Analysis Course and Trading Scripts at referenced URLs — signals a technical bias but no specific levels are given in the video metadata or description. -
Technical Levels & Setups OR Macro Drivers (📌):
- Tesla Q2 earnings release and Elon Musk's conference call are the core catalysts for the analysis.
- Pre-market technical analysis for futures and options traders is the claimed framework, though no specific technical levels (support, resistance, pattern) are mentioned in the available metadata. -
Risk/Reward Framework (⚖️):
- Entry: Not established by the available evidence.
- Stop: Not established by the available evidence.
- Targets: Not established by the available evidence.
- Risk/Reward: Not established by the available evidence.
- Position Size: Not established by the available evidence.
- Probability: Not established by the available evidence. -
Scenario Analysis (🔄):
| Scenario | Probability | Target | Trigger |
|---|---|---|---|
| Bull | Not established by the available evidence. | Not established by the available evidence. | Earnings report beats expectations and/or bullish commentary from Elon Musk on the conference call. |
| Base | Not established by the available evidence. | Not established by the available evidence. | Earnings results and conference call produce no strong directional catalyst, leading to range-bound technical action. |
| Bear | Not established by the available evidence. | Not established by the available evidence. | Earnings report misses expectations and/or bearish tone from Elon Musk on the conference call. | -
Risk Factors (⚠️):
- No specific technical levels, price targets, or risk parameters are stated in the available evidence, making the analysis unverifiable from metadata alone.
- The video is live and the description provides no ex-ante trade parameters; any claims made during the broadcast are not captured in the static metadata.
- Creator's disclaimer states the video is for informational purposes only and not financial advice, reinforcing that no actionable trade plan is documented here. -
Actionable Trading/Allocation Plan (🎯):
- Review the full video transcript or recording to extract any technical levels, entry/stop/target figures, or probability assessments mentioned during the stream.
- Compare the creator's pre-market technical analysis against actual post-earnings price action to assess predictive value.
- Monitor credible financial news sources for Tesla Q2 earnings results and conference call highlights to independently verify the catalyst-driven scenarios.

-
Creator Horizon Category (⏱️): Long-Horizon Macro / Structural — The claim concerns a potential future regulatory action (banning open-source models) based on observed rhetoric and policy positioning, implying a structural shift in the AI industry landscape rather than a short-term technical move.
-
One-Line Thesis (💡): The creator claims that ongoing rhetoric about the dangers of open-source AI models, notably from Anthropic, is part of a coordinated effort to build a public-record justification for an eventual ban on open-source models.
-
Key Data Points (📊):
- Rhetoric that models need guard rails, and open-source models can have guard rails removed, making them 'dangerous'
- Anthropic blog posts that take shots at open-source models when describing threats
- Intent to create predicate facts in the public record to justify later action -
Technical Levels & Setups OR Macro Drivers (📌):
- Evolving regulatory dialogue around open-source AI safety
- Anthropic's published positions that frame open-source models as dangerous due to removable guardrails
- Increasing pressure from some policymakers and industry players for tighter AI controls -
Risk/Reward Framework (⚖️):
- Entry: Not established by the available evidence.
- Stop: Not established by the available evidence.
- Targets: Not established by the available evidence.
- Risk/Reward: Not established by the available evidence.
- Position Size: Not established by the available evidence.
- Probability: Not established by the available evidence. -
Scenario Analysis (🔄):
| Scenario | Probability | Target | Trigger |
|---|---|---|---|
| Bull | Not established by the available evidence. | Not established by the available evidence. | A clear statement by a major AI company or regulator endorsing open-source model availability. |
| Base | Not established by the available evidence. | Not established by the available evidence. | Continued buildup of 'dangerous open-source' rhetoric without formal legislative proposal. |
| Bear | Not established by the available evidence. | Not established by the available evidence. | Introduction of draft legislation or explicit regulatory proposal to restrict or ban open-source AI model distribution. | -
Risk Factors (⚠️):
- The claim is based on interpretation of blog-post rhetoric rather than direct evidence of a coordinated ban effort
- Regulatory outcomes remain uncertain and may not lead to any ban
- The creator's analysis may conflate safety advocacy with an intent to ban -
Actionable Trading/Allocation Plan (🎯):
- Monitor official statements and blog posts from Anthropic and other major AI labs for further mentions of open-source model dangers
- Track legislative or regulatory filings at U.S. federal and state levels regarding AI model openness
- Review public testimony and policy papers from AI-policy organizations for references to open-source model restrictions

-
Creator Horizon Category (⏱️): Long-Horizon Macro / Structural — The creator discusses a multi-year governance and capital allocation failure at Intel, implying structural changes over several years.
-
One-Line Thesis (💡): The creator claims Intel's decline was caused by a shift from technical to business leadership, leading to $100 billion in shareholder distributions instead of reinvestment in fabrication capacity and EUV machines.
-
Key Data Points (📊):
- 34 years spent at Intel by the speaker
- 15 of 20 executive staff members were PhDs when the speaker joined
- Intel gave $100 billion to shareholders in the five-to-six years before the speaker returned
- Intel had not built a new factory in the decade prior to the speaker's return -
Technical Levels & Setups OR Macro Drivers (📌):
- Transition from technical leadership (PhD-heavy executive staff) to business/finance leadership as a root cause
- Failure to purchase EUV machines despite technological necessity
- Prioritization of stock buybacks and dividends over capital expenditure on new factories -
Risk/Reward Framework (⚖️):
- Entry: Not established by the available evidence.
- Stop: Not established by the available evidence.
- Targets: Not established by the available evidence.
- Risk/Reward: Not established by the available evidence.
- Position Size: Not established by the available evidence.
- Probability: Not established by the available evidence. -
Scenario Analysis (🔄):
| Scenario | Probability | Target | Trigger |
|---|---|---|---|
| Bull | Not established by the available evidence. | Not established by the available evidence. | Intel re-hires technically deep executives and restarts factory construction with EUV adoption. |
| Base | Not established by the available evidence. | Not established by the available evidence. | Intel continues to balance shareholder returns with measured capital investment but remains behind process leaders. |
| Bear | Not established by the available evidence. | Not established by the available evidence. | Intel continues to be run by finance-focused leadership and underinvests in fabs and EUV, further eroding competitive position. | -
Risk Factors (⚠️):
- The claim that Intel gave $100 billion to shareholders in five-to-six years is not independently verified; actual buyback and dividend data from Intel's financial statements would need to be checked.
- The creator asserts that a non-technical leadership team was the cause of underinvestment, but causation is not proven by the evidence alone.
- No specific dates, financial documents, or executive names are provided to allow direct verification. -
Actionable Trading/Allocation Plan (🎯):
- Cross-check Intel's capital expenditure on new fab construction and EUV lithography purchases during that period against the claim of no new factory in a decade.
- Review the educational and career backgrounds of Intel's executive staff during the claimed period to confirm the shift from PhD-heavy technical staff to business/finance leadership.

-
Creator Horizon Category (⏱️): Other — The creator discusses general trading philosophy and community benefits without specifying a time-bound forecast or trade horizon.
-
One-Line Thesis (💡): The creator argues that trading is a team game where dozens or hundreds of eyes scanning the market, properly moderated to filter noise and irrelevant chat, can surface new trading ideas and provide psychological support akin to a mini therapist.
-
Key Data Points (📊):
- Trading is a team game — creator's repeated phrase.
- Dozens, hundreds of eyes scanning the market — claimed benefit of community.
- Moderation with no noise, no chitchat, only pertinent useful information — stated requirement.
- Example: finding a stock never heard of, liking the setup, then actively trading it months later. -
Technical Levels & Setups OR Macro Drivers (📌):
- Community moderation to filter noise and chitchat is presented as a driver of idea quality.
- Multiple eyes scanning the market are claimed to help discover new setups. -
Risk/Reward Framework (⚖️):
- Entry: Not established by the available evidence.
- Stop: Not established by the available evidence.
- Targets: Not established by the available evidence.
- Risk/Reward: Not established by the available evidence.
- Position Size: Not established by the available evidence.
- Probability: Not established by the available evidence. -
Scenario Analysis (🔄):
| Scenario | Probability | Target | Trigger |
|---|---|---|---|
| Bull | Not established by the available evidence. | Not established by the available evidence. | A trader using a well-moderated community could discover new stocks and setups that become actively traded months later. |
| Base | Not established by the available evidence. | Not established by the available evidence. | No evidence-based trigger provided for a base scenario. |
| Bear | Not established by the available evidence. | Not established by the available evidence. | If moderation fails and noise/chitchat dominates, the claimed benefits of community scanning are lost. | -
Risk Factors (⚠️):
- The claimed benefits of community scanning are contingent on strict moderation, which may fail in practice.
- No specific stock, setup, price level, or catalyst is provided, making the thesis untestable for direct trading decisions.
- The evidence does not verify that the creator's community actually produces consistent profitable setups. -
Actionable Trading/Allocation Plan (🎯):
- Monitor the creator's community for specific examples of stocks discovered through crowd scanning that later became actively traded.
- Verify whether the community moderation process described (no noise, no chitchat) is consistently enforced and results in actionable setups.
- Track the creator's own trading results from such community-driven ideas over multiple months to assess claimed effectiveness.

-
Creator Horizon Category (⏱️): Long-Horizon Macro / Structural — The hosts discuss long-term shifts in market structure, such as the impact of zero-days-to-expiry and single-stock leveraged ETFs, the structural changes in housing demand due to wealthy boomers not downsizing, and the ongoing transformation of the AI and tech industry.
-
One-Line Thesis (💡): The market is experiencing a violent separation between winners and losers, with many high-profile tech and consumer stocks in a 'blood bath' while the overall market remains near all-time highs; this is not a broad bubble but a normalizing environment where policy and innovation have reduced recession frequency and compressed forward P/E multiples outside of the most crowded trades.
-
Key Data Points (📊):
- S&P 500 is down about 2% from all-time highs.
- 66% of stocks are positive year-to-date in the US stock market; median return is 12.6%.
- Oracle is more than 60% off the highs.
- Ethereum is 60% off the highs, Bitcoin is 50% off the highs.
- Netflix is 50% off the highs.
- South Korea ETF (EWY) is down 26%; 30-day Kospi volatility surged to its highest ever.
- Nike is down 75% from the highs; Lululemon is down 80%; Under Armour is down 84%.
- Netflix's forward P/E is at a market multiple; its operating income is about to pass Disney's.
- Disney spent $129 billion acquiring assets; market cap is $169 billion.
- Netflix has a 50% drawdown from highs.
- More than 300 S&P 500 names (61% of names, 40% of market cap) trade at a forward P/E under 20 times.
- Forward P/E multiple gap between semis and the S&P 500 is at the lowest levels of this AI era.
- Unemployment has been below the Fed's 4.5% estimate for a record-tying 57 months.
- KFC closed 207 US restaurants between January 2025 and March 31st.
- Share of US households with paid AI subscriptions is 2%.
- Domestic box office hit $2.99 billion in Q2 2026, highest second quarter in seven years.
- The Odyssey did $124 million domestic opening; IMAX had 24% of tickets for its opening. -
Technical Levels & Setups OR Macro Drivers (📌):
- Money goes to where it is treated best; 66% of stocks are positive year-to-date while megacap tech names are selling off.
- Leveraged ETF AUM ($198 billion total) is concentrated in technology, with semiconductors at $53 billion, contributing to violent swings in memory names.
- Retail remains the strongest structural buyer of US equities, with no net sell day on Citadel's cash equities platform in July 2026.
- Policy makers have managed to reduce the frequency of recessions; the unemployment rate has been under 5% for nearly a decade (excluding COVID).
- Boomers are not downsizing; they account for 42% of home buyers and often buy with cash.
- AI adoption is early (2% of US households have paid subscriptions), but the growth runway is perceived to be long.
- The 'wall of worry' has emerged after a sharp drawdown in AI-related and tech names. -
Risk/Reward Framework (⚖️):
- Entry: Not established by the available evidence.
- Stop: Not established by the available evidence.
- Targets: Not established by the available evidence.
- Risk/Reward: Not established by the available evidence.
- Position Size: Not established by the available evidence.
- Probability: Not established by the available evidence. -
Scenario Analysis (🔄):
| Scenario | Probability | Target | Trigger |
|---|---|---|---|
| Bull | Not established by the available evidence. | Not established by the available evidence. | If the forward P/E compression continues to reflect the market's skepticism about unsustainable earnings, and AI demand continues to grow from a 2% household adoption base, the broader market can grind higher with a wall of worry intact. |
| Base | Not established by the available evidence. | Not established by the available evidence. | The current environment of 'violent separation' persists: the names that are working continue to work, while crowded and speculative trades (e.g., memory, South Korean stocks) remain under pressure, consistent with a normalizing economy and a normal correction. |
| Bear | Not established by the available evidence. | Not established by the available evidence. | If the leveraged ETF unwind accelerates or if a recession materializes (which the hosts argue is unlikely given policy and structural changes), the market could experience a deeper correction than the current 2% pullback from all-time highs. | -
Risk Factors (⚠️):
- The hosts' thesis that 'this is a normal market environment' could be invalidated by a sudden, broad-based recession that they currently dismiss as improbable.
- Retail investors piling into leveraged ETFs and single-stock derivatives could exacerbate a selloff if liquidity dries up, increasing tail risk beyond what the hosts' 'normalization' frame captures.
- Structural drivers like AI adoption or the decline of recession frequency could face an external shock (e.g., geopolitical event, policy mistake) not anticipated by the hosts.
- The 'violent separation' between winners and losers could pivot to encompass the broader market if the current profit leaders (e.g., AI players) disappoint, leading to a more synchronized drawdown. -
Actionable Trading/Allocation Plan (🎯):
- Monitor the Citadel retail flows data and leveraged ETF AUM to gauge if the structural buying trend persists or shows signs of exhaustion.
- Verify the forward P/E compression trend for S&P 500 sectors against the hosts' claim that the market is pricing in unsustainable earnings, using actual sector-level P/E data from sources like Goldman Sachs (Peter Callahan).
- Track unemployment rate and NBER recession data to test the hosts' assertion that recessions have become less frequent due to policy and technological efficiency.
- Correlate the Kospi volatility and retail flow data from South Korea with broader US market drawdowns to assess spillover risk from leveraged international retail speculation.
- Validate the claim that 66% of stocks are positive year-to-date with a median return of 12.6% by sourcing the exact Russell 3000 composition and performance data referenced by the hosts.
-
Creator Horizon Category (⏱️): Other — The evidence consists only of metadata (title, description, and timestamp) with no transcript or explicit trading thesis; therefore the horizon cannot be determined from the available evidence.
-
One-Line Thesis (💡): No trading thesis is provided in the available evidence beyond the generic title reference to a 'MASSIVE TEST' involving war escalations and semiconductor higher lows.
-
Key Data Points (📊):
- Title: '[LIVE] Pre-Market Prep – MASSIVE TEST – War Escalations & Semiconductor Higher Lows'
- Source URL: https://www.youtube.com/watch?v=08lMWbE5B1k
- The creator states the video is 'live every trading day at 8:00 AM EST providing the best pre market technical analysis for futures traders and options traders.'
- The description includes affiliate links for TradeZella (20% off using code 'TB') and links to a technical analysis course, trading scripts, a swing trade newsletter, a Discord server, and an X/Twitter account. -
Technical Levels & Setups OR Macro Drivers (📌):
- The creator references 'War Escalations' as a macro catalyst in the title.
- The creator references 'Semiconductor Higher Lows' as a technical setup in the title. -
Risk/Reward Framework (⚖️):
- Entry: Not established by the available evidence.
- Stop: Not established by the available evidence.
- Targets: Not established by the available evidence.
- Risk/Reward: Not established by the available evidence.
- Position Size: Not established by the available evidence.
- Probability: Not established by the available evidence. -
Scenario Analysis (🔄):
| Scenario | Probability | Target | Trigger |
|---|---|---|---|
| Base | Not established by the available evidence. | Not established by the available evidence. | No specific trigger is provided in the metadata-only evidence. | -
Risk Factors (⚠️):
- The evidence does not contain any specific level, price, stop-loss, or verification condition because only metadata is available.
- The disclaimer states the content is 'for informational purposes only' and that trading financial instruments 'carries risk.' -
Actionable Trading/Allocation Plan (🎯):
- Watch the full video on YouTube to extract the specific technical levels, entry/stop/target parameters, and probabilistic scenarios the creator discusses.
- Verify the referenced 'Semiconductor Higher Lows' by reviewing a chart of the sector (e.g., SMH or SOX index) as of the publication date.
- Monitor news sources for the 'War Escalations' catalyst the creator cites in the title.
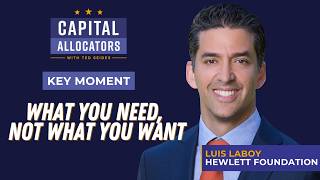
-
Creator Horizon Category (⏱️): Long-Horizon Macro / Structural — The discussion centers on a long-term, ongoing framework for manager selection and monitoring (kill lists and key debates) rather than short-term market timing or macro events.
-
One-Line Thesis (💡): Lois advocates for a disciplined, criteria-driven manager selection and monitoring process using kill lists and key debates to avoid biases and ensure redemptions are based on fundamental alignment rather than chasing performance.
-
Key Data Points (📊):
- Kill lists and key debates are maintained for every manager in the book.
- Criteria for manager selection shift over time with the opportunity set.
- Redemptions occur primarily due to strategic shifts (market environment changes) rather than manager performance chasing. -
Technical Levels & Setups OR Macro Drivers (📌):
- Use of a predefined set of selection criteria to counteract the 'shiny object' bias and factor risk of personal biases.
- Kill lists borrowed from Annie Duke's book 'Quit' to formally track reasons to move on from a manager.
- Cadence of decision-making in manager selection is described as 'so different' from typical investment decisions. -
Risk/Reward Framework (⚖️):
- Entry: Not established by the available evidence.
- Stop: Not established by the available evidence.
- Targets: Not established by the available evidence.
- Risk/Reward: Not established by the available evidence.
- Position Size: Not established by the available evidence.
- Probability: Not established by the available evidence. -
Scenario Analysis (🔄):
| Scenario | Probability | Target | Trigger |
|---|---|---|---|
| Base | Not established by the available evidence. | Not established by the available evidence. | Manager continues to meet evolving criteria and kill list items are not triggered. |
| Bear | Not established by the available evidence. | Not established by the available evidence. | Kill list items accumulate or a strategic shift in the portfolio eliminates alignment with a manager's strategy. | -
Risk Factors (⚠️):
- The kill list framework itself may miss critical non-fundamental reasons to redeem (e.g., liquidity constraints).
- The criteria are 'constantly looking forward', creating potential for backward-looking confirmation bias if historical data is not properly integrated.
- No evidence provided on the specific criteria or kill-list items, making verification of the framework's effectiveness impossible. -
Actionable Trading/Allocation Plan (🎯):
- Verify whether the kill list items are documented and reviewed at a set cadence for each manager.
- Cross-reference Lois's statement that redemptions are 'never' performance-based with observable redemption patterns at her firm.
- Request specific kill list examples (e.g., personnel departure, strategy drift) to test the framework's concreteness.

-
Creator Horizon Category (⏱️): Short-Term Technical — The content is a daily pre-market analysis stream focused on intraday setups and market-open preparation, implying a short-term technical horizon.
-
One-Line Thesis (💡): TheChartGuys demonstrate their daily pre-market preparation process by analyzing various market sectors and breaking down key setups ahead of market open.
-
Key Data Points (📊):
- Description states: 'Get an inside look at how we prep for the trading day.'
- Description states: 'We'll break down key setups and get ready for market open.'
- Video is a public stream offered as a sample of daily private membership content. -
Technical Levels & Setups OR Macro Drivers (📌):
- Creator claims to analyze 'various market sectors' to identify setups, though no specific sectors or tickers are named in the evidence. -
Risk/Reward Framework (⚖️):
- Entry: Not established by the available evidence.
- Stop: Not established by the available evidence.
- Targets: Not established by the available evidence.
- Risk/Reward: Not established by the available evidence.
- Position Size: Not established by the available evidence.
- Probability: Not established by the available evidence. -
Scenario Analysis (🔄):
| Scenario | Probability | Target | Trigger |
|---|---|---|---|
| Base | Not established by the available evidence. | Not established by the available evidence. | Creator will provide pre-market analysis and sector breakdown as described in the title and description. | -
Risk Factors (⚠️):
- No specific tickers, price levels, entry/exit criteria, or risk parameters are provided in the available evidence, making the analysis untestable from metadata alone.
- The video description emphasizes membership upsell, potentially biasing the content toward highlighting only favorable setups.
- Evidence does not include any actual analysis content, only metadata and promotional copy. -
Actionable Trading/Allocation Plan (🎯):
- Monitor the video content to extract any stated tickers, key levels, sector classifications, and trade setups.
- Cross-reference any tickers or sectors mentioned with current price action and volume to verify claims independently.
- Compare the creator's market-open preparation methodology with observable market outcomes on the analysis date (July 27).

-
Creator Horizon Category (⏱️): Short-Term Technical — The evidence supports this horizon classification.
-
One-Line Thesis (💡): The creator positions the day's trading session as the 'big day of earnings' for TSLA, GOOGL, NOW, IBM, and TXN, with the thesis that after 'momentum stocks had their best day in years,' the key question is whether that momentum will persist following the after-hours reports.
-
Key Data Points (📊):
- Momentum stocks had their best day in years prior to this stream.
- Creator trades on Etrade pro (screen shown), ThinkOrSwim (long term investing), Fidelity (long term). -
Technical Levels & Setups OR Macro Drivers (📌):
- Prior day's momentum rally described as 'best day in years' for momentum stocks. -
Risk/Reward Framework (⚖️):
- Entry: Not established by the available evidence.
- Stop: Not established by the available evidence.
- Targets: Not established by the available evidence.
- Risk/Reward: Not established by the available evidence.
- Position Size: Not established by the available evidence.
- Probability: Not established by the available evidence. -
Scenario Analysis (🔄):
| Scenario | Probability | Target | Trigger |
|---|---|---|---|
| Bull | Not established by the available evidence. | Not established by the available evidence. | Momentum continues after the after-hours earnings reports for TSLA, GOOGL, NOW, IBM, and TXN. |
| Base | Not established by the available evidence. | Not established by the available evidence. | Earnings reports result in mixed or neutral price action, with no clear continuation or reversal of prior day's momentum. |
| Bear | Not established by the available evidence. | Not established by the available evidence. | Earnings reports fail to sustain the prior day's momentum, leading to a reversal or pullback. | -
Risk Factors (⚠️):
- Creator's disclaimer states that option trading is 'really risky' and viewers 'are more than likely going to lose your money copying anything you see on this stream or channel.'
- No specific invalidation criteria, stop levels, or risk parameters are provided for any of the named tickers.
- The stream is described as educational, and the creator explicitly advises not to copy trades, meaning no actionable trade plan is disclosed. -
Actionable Trading/Allocation Plan (🎯):
- Compare the prior day's momentum index breadth with next-day market open to verify the creator's thesis of continued momentum.
- Cross-reference each company's earnings results with published financial statements to confirm that actual data aligns with market reaction.

-
Creator Horizon Category (⏱️): Long-Horizon Macro — The creator discusses structural energy and supply-chain vulnerabilities in Taiwan, implying a multi-year strategic risk rather than a tactical trade.
-
One-Line Thesis (💡): The All-In Podcast claims that Taiwan has less than 3 weeks of energy reserves, that a subsequent brownout would disable semiconductor fabs for 90 days, and that such an economic impact would exceed the Great Depression, while noting China has blockaded the Taiwan Straits seven times in four years.
-
Key Data Points (📊):
- Taiwan has less than 3 weeks of energy reserves.
- A fab that is turned off does not come back online for 90 days.
- The economic impact of a brownout in Taiwan is claimed to be greater than the Great Depression.
- China has blockaded the Taiwan Straits seven times over the last four years. -
Technical Levels & Setups OR Macro Drivers (📌):
- Taiwan's low energy reserves act as a structural vulnerability that could lead to a forced brownout.
- The lengthy restart time for semiconductor fabs (90 days) amplifies supply-chain disruption.
- Repeated Chinese blockades of the Taiwan Straits signal persistent geopolitical intent, per the creators.
- The scenario of no energy for three weeks is presented as a catalyst that could occur without any shots being fired. -
Risk/Reward Framework (⚖️):
- Entry: Not established by the available evidence.
- Stop: Not established by the available evidence.
- Targets: Not established by the available evidence.
- Risk/Reward: Not established by the available evidence.
- Position Size: Not established by the available evidence.
- Probability: Not established by the available evidence. -
Scenario Analysis (🔄):
| Scenario | Probability | Target | Trigger |
|---|---|---|---|
| Bull | Not established by the available evidence. | Not established by the available evidence. | Verification that Taiwan's energy reserves have been increased well beyond 3 weeks, or that fab restart times have been reduced. |
| Base | Not established by the available evidence. | Not established by the available evidence. | Continued periodic blockades or drills without actual energy cut-off; supply chains remain strained but functioning. |
| Bear | Not established by the available evidence. | Not established by the available evidence. | A confirmed energy blockade that depletes Taiwan's reserves and forces a brownout affecting semiconductor fabs. | -
Risk Factors (⚠️):
- The claim 'less than 3 weeks of energy reserves' is unverified; independent data on Taiwan's energy stockpiles and import dependencies must be checked.
- The 90-day fab restart figure is not sourced; actual restart times may vary by fab type and preparedness.
- The comparison to the Great Depression is a qualitative claim with no quantified economic impact provided.
- The assertion of seven blockades in four years is not independently confirmed in the evidence; specific dates and definitions of 'blockade' are missing.
- Geopolitical outcomes are inherently unpredictable; the creators' timeline and triggers are assumed, not demonstrated. -
Actionable Trading/Allocation Plan (🎯):
- Cross-check Taiwan's official energy reserve data from the Bureau of Energy, Ministry of Economic Affairs.
- Verify semiconductor fab restart timelines from industry sources such as TSMC or SEMI.
- Monitor for any official Chinese statements or PLA exercises that specify energy disruption as a tactic.
- Track semiconductor supply-chain diversification efforts and their timelines relative to the 90-day fab restart window.

-
Creator Horizon Category (⏱️): Long-Horizon Macro — The entire discussion concerns multi-year return outcomes from buy-and-hold versus market-timing strategies, anchored to the period 1990-present.
-
One-Line Thesis (💡): The compound creator argues that the 'miss the 10 best days' warning is misleading because the best and worst trading days cluster together, so a long-term buy-and-hold strategy (epitomized by 'Bob') naturally captures both sets of days, whereas trying to avoid worst days by selling causes investors to miss the best days that follow closely.
-
Key Data Points (📊):
- From 1990, $1 invested in the S&P 500 if you missed the 25 worst days turned into $236.
- From 1990, $1 invested in the S&P 500 if you missed the 25 best days turned into $8.
- From 1990, $1 invested in the S&P 500 in all days (buy and hold) turned into a substantial but unspecified multiple.
- From 1990, $1 invested in the S&P 500 if you missed the 25 best AND 25 worst days resulted in returns 'marginally better than the buy and hold'.
- Best and worst days since 1990 clustered around 2008 and 2020, according to the creator's chart. -
Technical Levels & Setups OR Macro Drivers (📌):
- The creator states that the best and worst days happen together because when the market is in a downtrend, people panic buy and panic sell.
- The creator references the parable of 'Bob, the world's worst market timer' to illustrate the power of compounding and never selling, even with disastrous entry points. -
Risk/Reward Framework (⚖️):
- Entry: Not established by the available evidence.
- Stop: Not established by the available evidence.
- Targets: Not established by the available evidence.
- Risk/Reward: Not established by the available evidence.
- Position Size: Not established by the available evidence.
- Probability: Not established by the available evidence. -
Scenario Analysis (🔄):
| Scenario | Probability | Target | Trigger |
|---|---|---|---|
| Base | Not established by the available evidence. | Not established by the available evidence. | The creator's buy-and-hold strategy continues to capture both best and worst days, yielding compound returns roughly in line with the S&P 500's long-term average. |
| Bear | Not established by the available evidence. | Not established by the available evidence. | The creator explicitly states 'if Bob bought at the peak and then sold at the bottom … obviously he'd be broke' – a scenario of panic selling that misses the best rebound days. |
| Bull | Not established by the available evidence. | Not established by the available evidence. | The creator's chart shows that missing only the 25 worst days results in $236 from $1, implying extraordinary outperformance for an investor who could avoid selloffs while staying invested. | -
Risk Factors (⚠️):
- The 'miss the best days' statistic is frequently cited (attributed to Tom Lee) and may be misunderstood if investors treat it as a warning to never sell, potentially ignoring proper risk management.
- The creator's analysis relies on data from 1990 onward; different outcomes could occur in periods with different volatility clustering.
- The parable of 'Bob' assumes the investor never sells, which may not be realistic for individuals with liquidity needs or emotional distress during crashes. -
Actionable Trading/Allocation Plan (🎯):
- Verify the JP Morgan chart and the creator's own chart showing $1 invested in the S&P 500 from 1990 under the scenarios listed (miss 25 worst, miss 25 best, miss both, all days).
- Cross-reference the dates of the 25 best and 25 worst S&P 500 days since 1990 to confirm they cluster around the 2008 financial crisis and 2020 COVID crash as claimed.
- Backtest a 'Bob' strategy (buying at market peaks, never selling) versus a strategy that buys at peaks but sells at troughs to quantify the creator's claim that the latter results in being 'broke'.

-
Creator Horizon Category (⏱️): Long-Horizon Macro — The discussion focuses on structural multi-year capital allocation risks in AI/data center buildout, private credit, and potential IPO trends, not short-term price action.
-
One-Line Thesis (💡): The current AI investment wave exhibits bubble-like behavior concentrated in private markets (VC/PE) and large-cap capex borrowing, not the retail-driven dot-com pattern, posing risk to funds and lead firms but not most US households.
-
Key Data Points (📊):
- Companies going public with valuations up 50-100% and no revenue/traffic characterized the dot-com bubble, but that pattern is absent today.
- VC/PE are described as 'going all in' and 'all in Anthropic and getting their outcomes and SpaceX.'
- Angel investors used to get into deals at $5M–$10M valuations; now requests are $40M–$60M pre-launch.
- Market leaders (Google, Meta) are borrowing 'hundreds of millions, billions of dollars' while spending cash on CapEx.
- A 'private credit problem' is said to already exist.
- AI is 'a lot harder to implement than anybody expected' and requires forward-deployed engineers (e.g., Microsoft hiring 6,000).
- Lovable is creating 770,000 applications per week; 30% of business is US, 20% of users are engineers.
- AI agents on OpenClaw and Claude Co-work break/hallucinate; 'every single motherfucking business plan ever written is wrong.'
- E-commerce case via ad platform: one cookware brand went from $4M to $16M, turned profitable, on pace for $80M this year.
- Data centers may become obsolete: 'a lot of data centers are going to be turned into pickleball courts' due to tech breakthroughs (like fiber dark fiber). -
Technical Levels & Setups OR Macro Drivers (📌):
- Massive private capital deployment into AI firms (OpenAI, Anthropic, SpaceX) at high entry prices.
- Large tech companies borrowing to fund CapEx while cash flow is consumed by capex.
- Potential technological breakthroughs in AI price/performance could strand data center investments.
- Private credit stress layering onto already-levered positions in AI funds.
- Shift in M&A environment after four years of FTC/DOJ inaction under Lina Khan; willingness to acquire could create IPO demand as currency for future deals. -
Risk/Reward Framework (⚖️):
- Entry: Not established by the available evidence.
- Stop: Not established by the available evidence.
- Targets: Not established by the available evidence.
- Risk/Reward: Not established by the available evidence.
- Position Size: Not established by the available evidence.
- Probability: Not established by the available evidence. -
Scenario Analysis (🔄):
| Scenario | Probability | Target | Trigger |
|---|---|---|---|
| Bear | Not established by the available evidence. | Not established by the available evidence. | AI price/performance improves faster than expected, making current data-center capacity redundant; private credit / VC funds that deployed at the peak face impairment. |
| Base | Not established by the available evidence. | Not established by the available evidence. | AI continues to be harder to implement at enterprise scale; forward-deployed engineers remain necessary; private-company liquidity event window (small IPOs) reopens to provide currency for M&A. |
| Bull | Not established by the available evidence. | Not established by the available evidence. | AI agents and tools (e.g., Lovable) continue rapid iteration; video/robotics dramatically increase token consumption, justifying data center buildout; large cap borrowing is validated by cash-flow returns. | -
Risk Factors (⚠️):
- Claim that current wave differs from dot-com bubble is unsupported by any comparative data on private-market leverage or concentration.
- Prediction that data centers become obsolete depends on unspecified technological breakthroughs; no timeline or mechanism is provided.
- Assertion that AI is 'hard to implement' and won't displace 50% of white-collar jobs relies on anecdotal evidence of agent brittleness, not systematic survey or employment data.
- No verification of private credit stress magnitude or which specific funds/firms are at risk.
- The 'pricing to perfection' thesis for AI infrastructure lacks valuation multiples or asset-level cash flow analysis. -
Actionable Trading/Allocation Plan (🎯):
- Monitor quarterly capex disclosures and bond issuance volumes from Meta and Alphabet for evidence of borrowing that exceeds free cash flow.
- Track IPO filing pipeline for companies with $50M-$100M raises to gauge revival of small-cap public offerings.
- Verify the cookware brand case study (unnamed) cited in the ad segment to assess representativeness of ROI claims.
- Follow third-party benchmarks on enterprise AI agent failure rates (e.g., hallucination, drift) to validate the claim that AI is 'a lot harder to implement.'
- Check SEC filings or press releases from Lovable, Synthesia, and other portfolio companies for revenue and user growth metrics that corroborate the 770k apps/week figure.
-
Creator Horizon Category (⏱️): Short-Term Technical — The video is explicitly a pre-market technical analysis live stream for futures and options traders, with no reference to long-term fundamental or macro horizons.
-
One-Line Thesis (💡): Trade Brigade claims a semiconductor recovery is starting, based on pre-market technical analysis.
-
Key Data Points (📊):
- Semiconductor recovery starting — creator claim in title and description -
Technical Levels & Setups OR Macro Drivers (📌):
- Pre-market technical analysis for futures and options traders
- Live squawk available at tradebrigade.co/live-squawk -
Risk/Reward Framework (⚖️):
- Entry: Not established by the available evidence.
- Stop: Not established by the available evidence.
- Targets: Not established by the available evidence.
- Risk/Reward: Not established by the available evidence.
- Position Size: Not established by the available evidence.
- Probability: Not established by the available evidence. -
Scenario Analysis (🔄):
| Scenario | Probability | Target | Trigger |
|---|---|---|---|
| Bull | Not established by the available evidence. | Not established by the available evidence. | If the semiconductor recovery thesis is supported by subsequent price action as per the creator's technical analysis |
| Bear | Not established by the available evidence. | Not established by the available evidence. | If price action invalidates the claimed semiconductor recovery | -
Risk Factors (⚠️):
- No specific tickers, price levels, or entry/exit parameters are provided in the evidence to test the thesis
- The title contains an exclamation “OOPS!” implying a possible error or reversal that is not defined in the evidence
- No risk management or stop-loss levels are stated
- The claim of a semiconductor recovery starting cannot be verified from metadata alone -
Actionable Trading/Allocation Plan (🎯):
- Review the full video transcript or livestream replay to extract specific tickers, price levels, and technical setups
- Check the live squawk feed for real-time commentary referenced in the description
- Monitor semiconductor indices (e.g., SOX) and leading semiconductor ETFs (e.g., SMH) for confirmation of the claimed recovery
- Verify any trades or setups discussed in the associated newsletter or Discord

-
Creator Horizon Category (⏱️): Short-Term Technical — The evidence supports this horizon classification.
-
One-Line Thesis (💡): The creator claims that traders returning after a weekend of 'war and Chinese AI headlines' must assess whether those geopolitical and sector-specific headlines disrupt the focus on major earnings reports from GOOGL, INTC, TSLA, and NOW scheduled for that week.
-
Key Data Points (📊):
- Earnings week for GOOGL, INTC, TSLA, and NOW – the creator explicitly lists these tickers as the 'big earnings' for the week.
- Weekend headlines described as 'war and Chinese AI headlines' – the creator claims these are potential market-moving factors.
- Platforms used: Etrade pro (screen shown), ThinkOrSwim (long-term investing), Fidelity (long term).
- Disclaimer states options trading is risky and one is 'more than likely going to lose your money copying anything you see on this stream or channel.' -
Technical Levels & Setups OR Macro Drivers (📌):
- Earnings catalysts: GOOGL, INTC, TSLA, and NOW reporting this week – the creator claims these are a core driver of market action.
- Geopolitical risk: 'war' headlines from the weekend – the creator claims this could create tension.
- Sector-specific risk: 'Chinese AI headlines' – the creator claims this could affect tech/semiconductor sentiment.
- Pre-market and open flow: The stream is titled 'Stock Market LIVE, Live Trading' – the creator's setup is to react to real-time price action on these catalysts. -
Risk/Reward Framework (⚖️):
- Entry: Not established by the available evidence.
- Stop: Not established by the available evidence.
- Targets: Not established by the available evidence.
- Risk/Reward: Not established by the available evidence.
- Position Size: Not established by the available evidence.
- Probability: Not established by the available evidence. -
Scenario Analysis (🔄):
| Scenario | Probability | Target | Trigger |
|---|---|---|---|
| Bull | Not established by the available evidence. | Not established by the available evidence. | Earnings beats from GOOGL, INTC, TSLA, and/or NOW overcoming negative weekend headlines (war, Chinese AI). |
| Bear | Not established by the available evidence. | Not established by the available evidence. | Weekend 'war and Chinese AI headlines' disrupt or overshadow earnings, leading to a risk-off tone. | -
Risk Factors (⚠️):
- The creator provides no specific price levels, stops, targets, probabilities, or position sizes, making the analysis purely qualitative.
- The description offers no data on the magnitude or nature of the 'war' or 'Chinese AI' headlines, making them unverifiable without external sources.
- The creator does not state any specific trading thesis, entry, or exit for any of the named tickers (GOOGL, INTC, TSLA, NOW).
- The disclaimer explicitly warns that copying trades is likely to result in a total loss, indicating high risk with no structured risk management provided. -
Actionable Trading/Allocation Plan (🎯):
- Monitor earnings reports this week for GOOGL, INTC, TSLA, and NOW to see if they confirm or contradict the creator's assumption that they are the primary market drivers.

-
Creator Horizon Category (⏱️): Long-Horizon Macro — The creator discusses multi-decade demographic trends (baby boomers, 70 million plus) and the likely increase in death and estate planning needs over the coming years.
-
One-Line Thesis (💡): Estate planning will become increasingly important due to the large baby boomer cohort, and financial advisors can add value by facilitating difficult conversations and projecting portfolio growth over 20-30 years that may reveal larger-than-expected estates.
-
Key Data Points (📊):
- 70 million plus baby boomers — claimed size of the demographic cohort driving future estate planning demand
- 20, 30 years — typical projection horizon used by the firm to show portfolio growth and potential bequests -
Technical Levels & Setups OR Macro Drivers (📌):
- Demographic wave: 70 million-plus baby boomers entering late-life stages, increasing the frequency of estates and inheritances.
- Behavioral reluctance: Clients avoid discussing mortality, creating a role for a third-party advisor to initiate and manage estate planning conversations.
- Portfolio surprisal: Projecting portfolio growth over 20-30 years may show clients that more wealth will remain for heirs than they expect, motivating planning. -
Risk/Reward Framework (⚖️):
- Entry: Not established by the available evidence.
- Stop: Not established by the available evidence.
- Targets: Not established by the available evidence.
- Risk/Reward: Not established by the available evidence.
- Position Size: Not established by the available evidence.
- Probability: Not established by the available evidence. -
Scenario Analysis (🔄):
| Scenario | Probability | Target | Trigger |
|---|---|---|---|
| Base | Not established by the available evidence. | Not established by the available evidence. | Estate planning demand increases as baby boomers age and die, and advisors who engage clients in these conversations capture the associated business. |
| Bear | Not established by the available evidence. | Not established by the available evidence. | Clients continue to avoid estate planning despite advisor intervention, leaving asset transfer to chance or courts, or portfolio projections fail to motivate action. | -
Risk Factors (⚠️):
- Sustained client taboo around mortality may limit adoption of estate planning even if demographic need exists.
- The actual number of baby boomers and their estate-planning behavior may differ from the quoted 70 million-plus claim (requires demographic data verification).
- The claim that portfolio projections over 20-30 years will surprise clients relies on specific market return assumptions that may not hold. -
Actionable Trading/Allocation Plan (🎯):
- Verify the U.S. Census Bureau estimate for the baby boomer population to confirm the '70 million plus' figure.
- Track advisor-client conversation data or AUM growth in estate-planning-related services as a proxy for demand validation.

-
Creator Horizon Category (⏱️): Short-Term Technical — The title and description focus on identifying whether the current market phase is a bubble or a melt-up, a near-term tactical question.
-
One-Line Thesis (💡): The creator questions whether the current market rally is a sustainable melt-up or an unsustainable bubble, using the underperformance of the Magnificent 7, IPO/buyback activity, earnings growth duration, and gold vs. bitcoin vs. semis as key indicators.
-
Key Data Points (📊):
- Mag 7 underperformance relative to the broader market is discussed as a potential signal of market narrowing or exhaustion.
- IPOs and buybacks are analyzed as indicators of corporate sentiment and liquidity flow.
- Earnings growth duration is questioned as a sustainability factor for current valuations.
- Gold, Bitcoin, and Semis are compared as competing asset classes reflecting different risk-on/risk-off preferences. -
Technical Levels & Setups OR Macro Drivers (📌):
- Underperformance of the Magnificent 7 is discussed as a possible sign that the market leaders are losing momentum, which could signal a broader rotation or exhaustion.
- The level of IPO and buyback activity is used as a proxy for corporate optimism and capital allocation trends.
- The sustainability of earnings growth is examined as a fundamental driver that could determine whether the rally continues or reverses.
- Gold vs. Bitcoin vs. Semis comparison highlights diverging investor narratives around inflation, technology, and store-of-value. -
Risk/Reward Framework (⚖️):
- Entry: Not established by the available evidence.
- Stop: Not established by the available evidence.
- Targets: Not established by the available evidence.
- Risk/Reward: Not established by the available evidence.
- Position Size: Not established by the available evidence.
- Probability: Not established by the available evidence. -
Scenario Analysis (🔄):
| Scenario | Probability | Target | Trigger |
|---|---|---|---|
| Bull | Not established by the available evidence. | Not established by the available evidence. | If the Mag 7 resumes leadership and earnings growth proves durable, the melt-up thesis would gain support. |
| Base | Not established by the available evidence. | Not established by the available evidence. | If IPO/buyback activity remains moderate and gold competes with semis, the market may continue in a choppy consolidation. |
| Bear | Not established by the available evidence. | Not established by the available evidence. | If the Mag 7 continues to lag, earnings growth decelerates, and gold outperforms risk assets, a bubble pop scenario would become more likely. | -
Risk Factors (⚠️):
- The episode title and metadata provide no specific price levels, valuations, or timing for the bubble/melt-up thesis, making it impossible to falsify or verify concretely.
- No quantitative thresholds are offered for what constitutes 'underperformance' of the Mag 7 or 'sustainable' earnings growth.
- The comparative analysis of gold vs. bitcoin vs. semis lacks a clear framework or historical analogy that can be tested with current data. -
Actionable Trading/Allocation Plan (🎯):
- Track IPO filing activity and total announced buyback volumes for the next quarter to assess corporate sentiment.
- Plot gold prices, bitcoin prices, and the PHLX Semiconductor Sector Index (SOX) on a single chart to observe divergences or convergence.
-
Creator Horizon Category (⏱️): Short-Term Technical — The episode title and description indicate a daily market commentary format ('WAYT? 7-21-2026') focused on current earnings and intra-market dynamics rather than long-term structural shifts.
-
One-Line Thesis (💡): Josh Brown and Michael Batnick discuss Google earnings, 'Inside the Market' topics, and a segment titled 'K-Shaped Myth Busting', suggesting they are analyzing recent market data and dispelling certain narratives around uneven recovery.
-
Key Data Points (📊):
- Episode title includes 'WAYT? 7-21-2026' indicating the recording date is July 21, 2026.
- Sponsorship mention of Calamos and ticker CAIE, the Calamos Autocallable Income ETF.
- Episode segments include 'Google Earnings', 'Inside the Market', 'K-Shaped Myth Busting', and 'Make The Case/Mystery Chart'.
- Josh Brown and Michael Batnick are employees of Ritholtz Wealth Management and may maintain positions in securities discussed.
- The episode is part of The Compound Media's 'What Are Your Thoughts' series. -
Technical Levels & Setups OR Macro Drivers (📌):
- Google earnings results are a catalyst for market discussion on the episode.
- 'Inside the Market' segment likely provides commentary on current market internals and technical conditions.
- 'K-Shaped Myth Busting' segment indicates the creators intend to challenge or reinterpret the widely-used 'K-shaped recovery' narrative. -
Risk/Reward Framework (⚖️):
- Entry: Not established by the available evidence.
- Stop: Not established by the available evidence.
- Targets: Not established by the available evidence.
- Risk/Reward: Not established by the available evidence.
- Position Size: Not established by the available evidence.
- Probability: Not established by the available evidence. -
Scenario Analysis (🔄):
| Scenario | Probability | Target | Trigger |
|---|---|---|---|
| Base | Not established by the available evidence. | Not established by the available evidence. | The creators' discussion of Google earnings and market internals sets the baseline for their market assessment. | -
Risk Factors (⚠️):
- No specific price levels, targets, or probabilities are provided in the metadata; any substantive analysis requires viewing the video content.
- The creators may maintain positions in securities discussed, creating potential for undisclosed bias beyond the provided disclaimer.
- The video is a sponsored episode, and the sponsor product (Calamos Autocallable Income ETF) is presented without independent verification.
- Narrative-dispelling segments (e.g., 'K-Shaped Myth Busting') may lack supporting data referenced only in the full video. -
Actionable Trading/Allocation Plan (🎯):
- Verify the actual Google earnings report date and consensus vs. results for the period around July 21, 2026, to assess the timeliness of the creators' commentary.
- Review the full video to extract any specific market levels, valuations, or positions referenced in the 'Inside the Market' and 'Make The Case/Mystery Chart' segments.
- Cross-reference the 'K-Shaped Myth Busting' segment with current economic data on wage growth, sector performance, and income distribution to evaluate the creators' claims.

-
Creator Horizon Category (⏱️): Short-Term Technical — The creator is focused on immediate market moves, daily sector rotations, and the upcoming earnings week (July 20, 2026), with no discussion of a multi-year structural horizon.
-
One-Line Thesis (💡): The creator claims the week of July 20, 2026, is the start of a major earnings period for big tech and chips (Tesla, Google, Intel, ServiceNow), with AI being the dominant theme and the market waiting for a durable theme out of AI after a recent momentum selloff.
-
Key Data Points (📊):
- Date: July 20, 2026 — the first real big week of earnings, followed by an even busier next two weeks.
- Apple is the biggest outperformer against the broader market in 20 years — evidence for this specific claim not provided.
- ServiceNow short interest is 'higher than ever' despite the stock being widely pumped by retail and institutional investors — creator cites this as a contradictory data point.
- Oil price key intraday level of $82 (WTI); the creator treats a sustained break above $82 as a risk-on catalyst for energy and a bearish risk for tech/momentum.
- Kimmy K3 AI model (Chinese) advanced on the AI agent leaderboard to #4, matching Claude, but prediction markets did not react (creator claims this is suspicious and different from the prior DeepSeek episode that moved trillions).
- Apple down ~2% on the day (July 20) from its all-time high, Nvidia briefly turned red, chips overall closing barely green after the fade.
- Health care (XLV), staples (XLP), and financials (XLF) are lagging; the creator notes no clear rotation into these sectors today.
- The creator mentions a '10-day ceasefire' deal in Iran that was confirmed by Iran, causing oil to gap down early, but tensions escalated again later.
- Intel earnings expected Thursday, ServiceNow earnings this week, Google and Tesla earnings this week.
- Creator mentions 'Apple is down 13' (likely price level) and 'Nvidia up 2.8' (small move compared to prior 5-6% swings).
- AMC (AMC Entertainment) up 25% on the day; the creator jokes about adding it to the long-term portfolio.
- United Rentals (URI) and USR — critical mineral plays — popped after Trump signed an EO on domestic critical mineral supply chains.
- Alcoa (AA) moved on a separate Trump proclamation offering reduced aluminum tariffs for onshoring.
- Oracle 52-week low hit intraday; the creator notes an Information hit piece about data center delays and overbudget claims, with Oracle not having denied it by 10:00 AM ET.
- Kinder Morgan (KMI) mentioned as an energy play moving higher.
- The creator claims to have made $1,000+ from Bradley Frizzle's consistent superchat donations.
- The creator states Apple is the 'biggest outperformance against the broader market in 20 years' — no source provided.
- Microsoft deployed AMD's next-generation chips and announced a Kimmy K3 partnership for co-pilot/ Azure.
- The creator cites a Bloomberg interview with Holly Newman Croft (Baron's #3 advisor) who recommends maintaining appropriate risk profile and not panic-selling during volatility.
- The creator cites a philosopher/speaker Jim Rohn on 'let the future be the greatest pull on your life.' -
Technical Levels & Setups OR Macro Drivers (📌):
- Earnings catalysts: Intel (Thursday), Google, Tesla, ServiceNow this week; creator expects earnings-driven price reactions.
- Oil at key pivot level ($82 WTI): sustained break above signals escalation in Iran conflict, bullish for energy, bearish for tech/momentum.
- AI narrative shift: Kimmy K3's rise on agent leaderboards and China AI's potential to deflate AI capex returns is a key risk to chip stocks.
- Apple's 2% drop from ATH: creator sees it as a technical drag on the index, but not necessarily fundamental.
- Oracle CDS blowout to new high: credit risk rising, creator warns of binary outcome (succeed or fail).
- No clear rotation from tech to value/defensives today; creator interprets as lack of conviction in any sector. -
Risk/Reward Framework (⚖️):
- Entry: Not established by the available evidence.
- Stop: Not established by the available evidence.
- Targets: Not established by the available evidence.
- Risk/Reward: Not established by the available evidence.
- Position Size: Not established by the available evidence.
- Probability: Not established by the available evidence. -
Scenario Analysis (🔄):
| Scenario | Probability | Target | Trigger |
|---|---|---|---|
| Bull | Not established by the available evidence. | Not established by the available evidence. | Chips (especially Nvidia) sustain a recovery above Friday's close, oil stays below $82, and AI model competition fears (Kimmy) fade without impacting capex plans. |
| Base | Not established by the available evidence. | Not established by the available evidence. | Market continues to range between Friday's panic lows and today's intraday highs, with earnings providing near-term direction but no breakout in either direction. |
| Bear | Not established by the available evidence. | Not established by the available evidence. | Oil breaks and holds above $82, chips break below Friday's low, or Oracle's CDS spike leads to a broader credit event; Kimmy/AI model competition confirms deflationary pressure on AI capex. | -
Risk Factors (⚠️):
- No verified source for the claim 'Apple is the biggest outperformance against the broader market in 20 years.' Need 20-year performance data.
- The Iran '10-day ceasefire' deal is unconfirmed; escalation risk remains high (Trump threat of retaliation for killing of Americans).
- Oracle's CDS spike and the Information report are unverified; the creator expects Oracle to deny it but it had not denied by 10:00 AM ET.
- Kimmy K3's impact on capex is disputed: prediction markets did not move, but creator's interpretation of 'Wall Street being weird' is subjective.
- No evidence of the creator's actual trade entries, stops, or position sizing for the long-term or short-term plays mentioned.
- No evidence for the claim that 'Korea chips are down a lot from the highs' or specific magnitude.
- No evidence of the creator's alleged 6 bathroom episodes; included as anecdotal color.
- No evidence for the '1,000%' option trade claimed; no trade confirmation provided. -
Actionable Trading/Allocation Plan (🎯):
- Monitor oil (WTI) for sustained break above $82; verify if that triggers a sector rotation from tech to energy.
- Verify Oracle's denial of the Information report; check Oracle CDS levels at close.
- Verify the Kimmy K3 leaderboard position and compare to prediction market odds (Polymarket, Kalshi) for AI model leadership.
- Check earnings reports for Intel (Thursday), Google, Tesla, and ServiceNow for forward guidance on capex and AI spending.
- Verify the Apple '20-year outperformance' claim with historical data (S&P 500 vs. Apple total return).
- Monitor the Trumps 'Truth Social' post on Iran retaliation and any subsequent military escalation.
-
Creator Horizon Category (⏱️): Long-Horizon Macro / Structural — The creators discuss a multi-quarter or multi-year trend of surging token spend and its eventual impact on corporate earnings and CFO behavior, implying a structural shift in enterprise AI cost management.
-
One-Line Thesis (💡): The All-In Podcast creators claim that token spend among 'ramp customers' has grown 21× year-over-year, which, if unmanaged, will lead to public company CFOs missing earnings due to uncontrolled operating expenses from engineer-led AI model usage.
-
Key Data Points (📊):
- Token spend among ramp customers grew 21 times over the last year (not 21%).
- Engineers are described as 'ripping through million tokens at 56 bucks' in an unguided system.
- Eric (presumably Eric Yuan or a Ramp executive) released a ramp product to help CFOs control spend.
- The creators assert that for 95% of tasks, a lower-cost model costing 1/100 of the latest model is sufficient. -
Technical Levels & Setups OR Macro Drivers (📌):
- Uncontrolled engineer-driven AI spend is a setup for future CFO earnings misses and increased demand for cost-management tools.
- CFOs turning on rate-limiting features on platform spend is a driver of operational discipline and potential vendor consolidation. -
Risk/Reward Framework (⚖️):
- Entry: Not established by the available evidence.
- Stop: Not established by the available evidence.
- Targets: Not established by the available evidence.
- Risk/Reward: Not established by the available evidence.
- Position Size: Not established by the available evidence.
- Probability: Not established by the available evidence. -
Scenario Analysis (🔄):
| Scenario | Probability | Target | Trigger |
|---|---|---|---|
| Bear | Not established by the available evidence. | Not established by the available evidence. | If CFOs fail to implement spend controls and token spend continues to 21× every few months, a wave of earnings misses will hit public markets. |
| Base | Not established by the available evidence. | Not established by the available evidence. | CFOs adopt rate-limiting tools (like Ramp's product), slowing token spend growth and preventing systemic earnings misses, but still incurring higher OpEx than historical levels. |
| Bull | Not established by the available evidence. | Not established by the available evidence. | Enterprises optimize model selection (95% of tasks on cheaper models), token spend growth stabilizes, and AI investment produces measurable ROI that justifies the spend. | -
Risk Factors (⚠️):
- The claim of 21× token spend growth is attributed to a single source ('looked at the stats this morning') and is not independently verified.
- The assumption that engineers 'don't care about ROI' may not hold across all organizations or over time.
- The claim that 95% of tasks can use a cheaper model is an unsubstantiated estimate and may not reflect real workload distributions.
- The creators conflate Ramp's product release with CFO inability to control spend, but causation is not established in the evidence. -
Actionable Trading/Allocation Plan (🎯):
- Verify the 21× token spend growth figure by sourcing independent data from enterprise AI cost management platforms (e.g., Ramp, CloudZero, Vantage).
- Track enterprise adoption announcements or earnings from Ramp and similar spend-control tools to gauge CFO urgency.
- Cross-reference the claim that 95% of AI tasks can be done with cheaper models against model cost/performance benchmarks (e.g., from OpenAI, Anthropic, open-source leaderboards).

-
Creator Horizon Category (⏱️): Other — The transcript describes a celebrity wedding event with no financial or market content; the horizon is not applicable.
-
One-Line Thesis (💡): The creator describes attending a celebrity wedding officiated by Adam Sandler and featuring performances by Taylor Swift, Paul McCartney, and Stevie Nicks, with no financial investment thesis presented.
-
Key Data Points (📊):
- Adam Sandler officiated the wedding — claim by creator
- Sandler spoke for 20 or 30 minutes — claim by creator
- Sandler sang during the officiating — claim by creator
- Sandler said, 'You're not going to have to worry about that' (referencing 'for richer for poorer') — claim by creator
- Sandler's key message: 'Kiss each other' every day — claim by creator
- Travis's vows lasted about 30 minutes — claim by creator
- Taylor's vows lasted about 30 minutes — claim by creator
- The ceremony was held in Madison Square Garden, built to look like a massive castle — claim by creator
- Performances: Taylor and Paul McCartney sang, then Taylor and Stevie Nicks sang — claim by creator
- Creator danced near Paul McCartney, Brad Pitt, and Cindy Crawford at the event — claim by creator -
Technical Levels & Setups OR Macro Drivers (📌):
- Not established by the available evidence. -
Risk/Reward Framework (⚖️):
- Entry: Not established by the available evidence.
- Stop: Not established by the available evidence.
- Targets: Not established by the available evidence.
- Risk/Reward: Not established by the available evidence.
- Position Size: Not established by the available evidence.
- Probability: Not established by the available evidence. -
Scenario Analysis (🔄):
| Scenario | Probability | Target | Trigger |
|---|---|---|---|
| Bull | Not established by the available evidence. | Not established by the available evidence. | Not established by the available evidence. | -
Risk Factors (⚠️):
- The entire transcript is anecdotal and lacks any financial or market data, making it unsuitable for investment analysis.
- No verification of the event details, attendee claims, or durations is possible from the source alone. -
Actionable Trading/Allocation Plan (🎯):
- This transcript contains no financial content; no verification or monitoring steps are warranted.

-
Creator Horizon Category (⏱️): Long-Horizon Macro — The creator (Juan Luis Perez) discusses structural shifts in market dynamics, portfolio concentration over multi-year arcs, and long-term manager selection cycles at Huelet, a long-time-horizon endowment/foundation LP.
-
One-Line Thesis (💡): The creator argues that all markets now carry emerging-market-like risks (geopolitical, policy, social polarization, market structure change), so investors should abandon static checklists and instead dynamically question their portfolio biases, focusing on managers that explicitly manage disruption risk across technology, regulation, and value chains.
-
Key Data Points (📊):
- Luis spent 15 years at Everest Capital, investing across equities, debt, commodities, and currencies in emerging markets, and moved from nearly being fired to partner within 12 months after a successful Brazil options trade. — Key experience
- Luis has been at Huelet for 10 years, initially taking over a mature public equity portfolio built by Anna Marshall, then concentrating the roster and later adding a "next generation" carve-out to lower the confidence hurdle for new managers. — Portfolio structure evolution
- During COVID, Luis reduced exposure to value managers and shifted toward a quality-compounding portfolio, based on deep-dive portfolio analysis. — Macro-driven portfolio shift
- Luis uses a 'kill list' (borrowed from Annie Duke’s book Quit) for every manager, with key debates and pre-set criteria to avoid redemption driven by performance chasing. — Manager monitoring framework
- Luis sent Anna a side-by-side statistical comparison of F1 drivers Ayrton Senna and Alain Prost, using manager-evaluation language, as an example of applying investment frameworks to non-investment contexts. — Investment approach metaphor -
Technical Levels & Setups OR Macro Drivers (📌):
- Transition in economies and markets perceived during COVID led to reducing value exposure in favor of quality compounding. — Portfolio catalyst
- Japan opportunity was identified through technical analysis (breakout in markets) and then researched like emerging markets; Huelet ultimately invested after extensive groundwork. — Opportunity workflow
- All markets now face geopolitical risk, political uncertainty, social polarization, policy risk, and changing market structure, blurring the old emerging/developed distinction. — Structural driver
- Disruption risks highlighted: technology (especially AI acceleration), regulatory risk, government intervention, value-chain risk, and macro uncertainty. — Risk factor list -
Risk/Reward Framework (⚖️):
- Entry: Not established by the available evidence.
- Stop: Not established by the available evidence.
- Targets: Not established by the available evidence.
- Risk/Reward: Not established by the available evidence.
- Position Size: Not established by the available evidence.
- Probability: Not established by the available evidence. -
Scenario Analysis (🔄):
| Scenario | Probability | Target | Trigger |
|---|---|---|---|
| Bull | Not established by the available evidence. | Not established by the available evidence. | Huelet’s manager selection criteria successfully identify next-generation quality-compounding managers that navigate disruption risks; the portfolio concentration and explore/exploit balance produce consistent outperformance. |
| Base | Not established by the available evidence. | Not established by the available evidence. | The current quality-focused portfolio continues to perform in line with expectations as market dynamics evolve; manager turnover remains steady as per the kill-list framework, and no fundamental misalignment emerges. |
| Bear | Not established by the available evidence. | Not established by the available evidence. | A new structural shift (e.g., technology disruption or regulatory change) makes the current quality/compounding framework obsolete; the confidence hurdle for next-generation managers becomes too high to replenish the portfolio, leading to stagnation. | -
Risk Factors (⚠️):
- The creator’s framework heavily relies on subjective qualitative assessments (e.g., "how it feels to be in the seat") and empathy-based questioning, which may not scale or produce consistent outputs across different allocators.
- The 'kill list' and pre-set criteria may become outdated if the opportunity set evolves faster than expected, leading to false negatives in manager evaluations.
- The shift from a concentrated core to a next-generation carve-out introduces a higher churn, which could degrade long-term compounding if the lower confidence hurdle admits subpar managers.
- No specific tickers, valuations, entry/exit prices, or risk/reward ratios are provided, so the thesis is entirely qualitative and cannot be back-tested or monitored with conventional metrics. -
Actionable Trading/Allocation Plan (🎯):
- Track the velocity of new manager additions to the 'next generation' carve-out; compare with the stated intention of maintaining a high hurdle for quality.
- Observe whether Luis publicly references the 'kill list' framework in subsequent interviews or writings as evidence of its persistent use.
- Verify whether the Japan investment thesis is revisited or expanded in future allocator discussions; this would confirm the repeatability of the top-down + technical analysis approach.
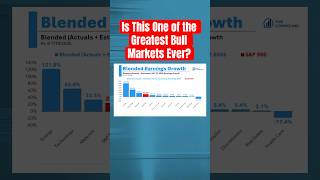
-
Creator Horizon Category (⏱️): Long-Horizon Macro — The creator discusses broad macro conditions (economy, labor, inflation, consumer) and forward guidance on earnings and AI, implying a multi-quarter or longer horizon for the thesis.
-
One-Line Thesis (💡): The creator argues the current bull market, driven by resilient macro conditions and strong earnings growth even outside the Magnificent Seven, is among the great bull markets and shows no signs of imminent correction.
-
Key Data Points (📊):
- Excluding the Mag 7, earnings are still expected to grow 20.9%.
- 10 of 11 sectors will grow earnings this quarter.
- Technology sector contributes 65% of earnings growth year over year.
- Technology earnings growth year over year is 65%.
- The creator describes the month-over-month inflation drop as the biggest single month drop in 6 years, attributable to the oil shock and temporary ceasefire.
- The creator cites a Centrini report suggesting a doom-and-gloom outlook for AI's impact on the labor market.
- The creator mentions uncertainty around AI's ultimate effect on the labor market. -
Technical Levels & Setups OR Macro Drivers (📌):
- Economic resilience despite disruptions: war, tariffs, new Fed chairman, iffy labor market, and AI uncertainty.
- Consumer strength, especially on the high end, continues to earn and spend.
- Broad earnings growth across 10 of 11 sectors, supported by tech at 65% growth year over year. -
Risk/Reward Framework (⚖️):
- Entry: Not established by the available evidence.
- Stop: Not established by the available evidence.
- Targets: Not established by the available evidence.
- Risk/Reward: Not established by the available evidence.
- Position Size: Not established by the available evidence.
- Probability: Not established by the available evidence. -
Scenario Analysis (🔄):
| Scenario | Probability | Target | Trigger |
|---|---|---|---|
| Bull | Not established by the available evidence. | Not established by the available evidence. | Economy remains resilient, inflation continues to moderate, consumer spending holds up, and earnings grow across sectors including non-Mag 7. |
| Base | Not established by the available evidence. | Not established by the available evidence. | Steady-as-she-goes environment as described by the creator for the back half of the year and beyond. |
| Bear | Not established by the available evidence. | Not established by the available evidence. | A significant negative AI-driven labor market disruption (as per Centrini report), renewed inflation spike, or a major economic downturn. | -
Risk Factors (⚠️):
- Inflation may not continue to moderate as the oil shock and temporary ceasefire effects fade.
- Labor market weakness could deepen, undermining consumer spending.
- AI-driven labor disruption (Centrini report) could materialize faster or more severely than expected.
- Uncertainty around the new Fed chairman's policy direction could create volatility.
- Tariff and war disruptions could escalate, hurting economic resilience.
- Earnings growth concentrated in tech may not sustain, and other sectors may fail to deliver. -
Actionable Trading/Allocation Plan (🎯):
- Track earnings reports across all 11 sectors to confirm 10 of 11 grow earnings as claimed.
- Watch for updates from the Fed and the new chairman's statements for policy clarity.
- Follow the Centrini report and other labor-market AI studies for signs of disruption.
- Observe high-end consumer spending data and labor market indicators for resilience.

-
Creator Horizon Category (⏱️): Long-Horizon Macro / Structural — The creator discusses a potential structural shift in AI model adoption and spending, not a short-term technical or macro catalyst.
-
One-Line Thesis (💡): The creator argues that a step-function increase in AI efficiency leads to more overall spending, not less, and that an open-weight model catching fire (analogous to Linux) could disrupt the pricing of frontier AI models, altering earnings expectations for companies like OpenAI and Anthropic.
-
Key Data Points (📊):
- "With every step function increase in the efficiency ... people are spending way more not less" — creator's claim that efficiency gains increase total spend.
- "Open weight model catches fire. Linux is a great example" — creator analogizes potential open-weight AI model adoption to Linux displacing Microsoft.
- "If they decide ... use these open weight models for 95% of the workflows and only send the most critical 5% to the more expensive frontier models" — creator describes a specific workflow split that would disrupt earnings expectations.
- "It's a long shot" — creator's characterization of the probability that the described disruption occurs.
- "These are like very expensive models to train. ... somebody's just going to spin this up. It just seems very far-fetched" — creator's skepticism about the viability of a cheaper model competitor. -
Technical Levels & Setups OR Macro Drivers (📌):
- Efficiency gains in AI models historically drive more spending, not less.
- Adoption of open-weight models for 95% of workflows could shift spending away from frontier models.
- Historical precedent of Linux displacing Microsoft is cited as evidence of a similar tech disruption pattern. -
Risk/Reward Framework (⚖️):
- Entry: Not established by the available evidence.
- Stop: Not established by the available evidence.
- Targets: Not established by the available evidence.
- Risk/Reward: Not established by the available evidence.
- Position Size: Not established by the available evidence.
- Probability: Not established by the available evidence. -
Scenario Analysis (🔄):
| Scenario | Probability | Target | Trigger |
|---|---|---|---|
| Bull | Not established by the available evidence. | Not established by the available evidence. | Evidence of an open-weight model catching fire and being adopted for 95% of workflows, diverting spending away from frontier models. |
| Base | Not established by the available evidence. | Not established by the available evidence. | Efficiency gains in AI continue but total spending on AI models increases rather than decreases, as the creator argues is the historical pattern. |
| Bear | Not established by the available evidence. | Not established by the available evidence. | Open-weight models fail to gain significant adoption, and the cost of frontier models remains high with no competitive pricing pressure. | -
Risk Factors (⚠️):
- The creator is not a scientist, as stated, and lacks technical expertise to assess the cost and efficiency of AI model training.
- The cost of training deep seek (or a comparable cheap model) is not disclosed in the evidence, making the viability of a low-cost competitor unverifiable.
- Historical analogies (Linux vs. Microsoft) may not directly map to the AI industry due to differences in economics, network effects, and capital intensity. -
Actionable Trading/Allocation Plan (🎯):
- Monitor reports on total enterprise AI spending trends to verify whether efficiency gains correlate with increased or decreased expenditure.
- Track adoption rates of open-weight models in production workflows, particularly any shift toward using them for the majority (95%) of tasks.
- Review earnings reports and guidance from major AI companies (e.g., Anthropic, OpenAI) for signs of pricing pressure or margin compression potentially caused by cheaper alternatives.
-
Creator Horizon Category (⏱️): Short-Term Technical — The creator focuses on weekly, daily, and hourly charts with near-term levels and expected move bounds for the upcoming week.
-
One-Line Thesis (💡): The S&P 500 is neutral-to-bearish after losing its uptrend tailwind, with a critical must-hold level at 739.65, while the NASDAQ 100 is actively slipping into a downtrend with lower highs and lower lows.
-
Key Data Points (📊):
- SPY weekly: red bodied bar, equal high, slightly higher low, closed inside previous week's range lower third, no expansion of range
- QQQ weekly: solid red bar, bar-to-bar lower high and lower low, closed outside and underneath previous week's range
- IWM weekly: very mild pullback, small range compression, weekly flag structure
- S&P 500 daily: lost 20-day and 50-day SMA, gap-down gap-fill reversal, closed weak
- Must-hold level on S&P 500: 739.65 (line in the sand due to Korea gap-down)
- If S&P accepts back above 749 (all recent lows), could develop short-term balance range and head to all-time highs
- NASDAQ 100 daily: sustained downtrend, never broke out above resistance trend line, lower low on gap-down Friday
- NASDAQ 100 hourly: failed bull flag breakout, overhead supply at 707, bears in control under 699, gap target below
- S&P 500 internals: volume outflows not substantial (under -300M), cumulative tick closed at -4,400 (not beneath -5,000)
- NASDAQ internals: volume outflows more substantial, cumulative tick moderate, advance/decline line closed over trend lower zone at 1,500
- Sector rotation: Energy up (crude oil headlines), Real Estate slow drift up, Consumer Staples gap-up sold on Friday, XLF squatting after bank earnings
- DRAM (memory ETF): highest volume ever on Friday session, 190% of 20-day average, not yet capitulation
- SMH: head-and-shoulders neckline break, price has 'oops' higher before; key level 568; 20% pullback from all-time high to Friday low
- IGV (software): not bad, possible footing, relative strength on Friday
- XLK: breaking trend, lower highs
- XLC: wide and loose, gaps extreme, not trending
- MAG 7: inverted head and shoulders breaking neckline lower, higher low potential; reclaim of Friday's high back through gap would be bullish
- XLU: balance range, not much to read
- Nvidia: looked below and failed 200, closed gap then squatted into close; sellers stepped in twice
- Apple: bullish three-bar play, defensive tech, extended from 50 SMA on double run
- Microsoft: fake break over range high, rejecting 50 SMA, under 200 SMA, weak
- Google: earnings this week, missed Gemini milestones, gap-down Friday, on ice
- AMD: impressive reversal on Friday; reclaim of 507 would be compelling
- Intel: rally rejections of 100; overhead supply; weak relative to NASDAQ -
Technical Levels & Setups OR Macro Drivers (📌):
- S&P 500: lost daily 20 and 50 SMA, gap-down gap-fill reversal, neutral-to-bearish; key level 739.65 must hold to avoid deeper pullback
- NASDAQ 100: sustained downtrend with lower highs and lower lows; hourly failed bull flag; overhead supply at 707; bears in control under 699
- Semiconductors (SMH): repeated head-and-shoulders pattern that faked out; 568 is key level; 20% pullback from high; highest volume not yet capitulation
- Memory (DRAM): highest volume ever on Friday, possible capitulation but not confirmed
- Software (IGV) and Cyber Security (CIVR): relative strength; potential for higher low and rotation into defensive tech
- Energy sector: driven by Middle East headlines, inside a range; not recommended for trading due to headline risk
- Financials (XLF): squatting after bank earnings, could pull back to test daily 20 and set higher low
- Apple: defensive tech bullish three-bar play; breakout target overnight high -
Risk/Reward Framework (⚖️):
- Entry: Not established by the available evidence.
- Stop: Not established by the available evidence.
- Targets: Not established by the available evidence.
- Risk/Reward: Not established by the available evidence.
- Position Size: Not established by the available evidence.
- Probability: Not established by the available evidence. -
Scenario Analysis (🔄):
| Scenario | Probability | Target | Trigger |
|---|---|---|---|
| Bull | Not established by the available evidence. | Not established by the available evidence. | Verify the trigger against the source evidence. |
| Bear | Not established by the available evidence. | Not established by the available evidence. | Verify the trigger against the source evidence. |
| Base | Not established by the available evidence. | Not established by the available evidence. | Verify the trigger against the source evidence. | -
Risk Factors (⚠️):
- Loss of S&P 500 level 739.65 could open door to deeper pullback
- NASDAQ 100 sustained downtrend may accelerate if lower bound of weekly expected move (672.99) is breached
- Semiconductor head-and-shoulders pattern may fail again (as it has historically) leading to false breakdown
- Energy sector is subject to headline risk from Middle East, making it unreliable for trading
- Earnings reports for Google, Tesla, Intel, and others could invalidate all technical analysis
- Market volatility (gaps, gap-fill reversals) makes swing trading difficult, especially in XLC -
Actionable Trading/Allocation Plan (🎯):
- Monitor S&P 500 for daily close relative to 739.65 and 749 to determine direction
- Monitor NASDAQ 100 for hourly action around 699 and 707 to confirm bearish or bullish reversal
- Watch SMH for acceptance above or below 568 to gauge semiconductor trend
- Watch DRM volume levels to see if Friday's high volume is followed by capitulation (300%+ of 20-day avg) or reversal
- Track sector rotation: software (IGV), cyber security (CIVR), financials (XLF), and defensive tech (Apple) for relative strength
- Review overnight Korean markets for Samsung and SK Hynix ADR impact on memory stocks
- Check earnings calendar for Google, Tesla, Intel, and related names for catalyst-driven moves

-
Creator Horizon Category (⏱️): Long-Horizon Macro / Structural — The creator asserts that markets are undergoing a structural shift from manias-panics-crashes to bubbles-parabolas-speed-crashes, driven by AI agents, tokenization, and leverage, which will permanently change market structure.
-
One-Line Thesis (💡): The creator claims that AI-related equities are in an AI mid-cycle slowdown and digestion period following a parabolic move, but the structural bull market in AI remains intact, with the real risk being repeated speed crashes due to crowded momentum trades and AI-agent-driven leverage.
-
Key Data Points (📊):
- Morgan Stanley Tech Momentum Factor Index 18-day rate of change at -40% — the worst unwind since data back to 1998.
- Micron (MU) bought at levels higher than the creator's average sell price, but some buys were slightly lower than the highest sale price.
- Thematic portfolio correction currently around 40% from its peak.
- Marvell (MRVL) down sharply, the creator's biggest position after Eli Lilly.
- Silver had a 40% fall in five days.
- Bitcoin typically gets 40% drawdowns in 18 days.
- JP Morgan earnings surprise 34% and stock traded up 10% near all-time highs.
- Goldman Sachs beat by 45% and jumped to all-time high.
- S&P 500 year-over-year positive — no recession signal.
- S&P 500 equal weight made new all-time highs this week.
- 60-day volatility (tech) at 92 while S&P 500 vol is low — a record disparity for optimized portfolios.
- Core CPI and sticky core from Atlanta Fed at new lows.
- Japan reclassified Bitcoin and crypto as financial assets this week.
- South Korea moved to allow spot Bitcoin ETFs.
- Stripe put in a bid for PayPal (stablecoin/ecosystem signal). -
Technical Levels & Setups OR Macro Drivers (📌):
- V-control (volatility control) strategies and leverage are forcing systematic unwinds — the tech momentum factor witnessed unprecedented unwind.
- Corporate earnings are strong (e.g., JP Morgan +10%, Goldman +45%) and recession signals absent (S&P 500 year-over-year positive).
- Creator cites Demis Hassabis (DeepMind) writing that AGI is only a few short years away — a civilization-scale event.
- Consumer agents expected within 6 months; enterprise agents are already active; crypto ecosystem (Ethereum, tokenized assets) seen as the purest AI trade because it cannot be disrupted by AI.
- Creator is releasing a paper on the 800-volt DC / Vera Rubin side — a step-up function for about 25 companies (not in current thematic portfolio). -
Risk/Reward Framework (⚖️):
- Entry: Not established by the available evidence.
- Stop: Not established by the available evidence.
- Targets: Not established by the available evidence.
- Risk/Reward: Not established by the available evidence.
- Position Size: Not established by the available evidence.
- Probability: Not established by the available evidence. -
Scenario Analysis (🔄):
| Scenario | Probability | Target | Trigger |
|---|---|---|---|
| Bull | Not established by the available evidence. | Not established by the available evidence. | Verify the trigger against the source evidence. |
| Base | Not established by the available evidence. | Not established by the available evidence. | The AI digestion period continues with a correction of 50% of the move from Opus 4.5 (around current levels) and then stabilizes without a massive bounce; volatility remains elevated; the S&P 500 continues to rotate into non-tech sectors. |
| Bear | Not established by the available evidence. | Not established by the available evidence. | If the tech momentum unwind extends further and the S&P 500 year-over-year turns negative (a recession signal), the correction deepens beyond 50% retracement; systematic funds deleverage further; corporate earnings disappoint despite strong expectations. | -
Risk Factors (⚠️):
- The creator claims the correction could extend further before a turn; a 50% retracement of the Opus 4.5 move is plausible.
- The creator notes that Adobe and Salesforce have downward-sloping 200-day moving averages — software names may be 'toast' and disrupt the broader AI trade.
- Debt-to-equity of hyperscalers is low, but models like OpenAI and Anthropic are not included; creator dismisses debt concerns as 'no worries' but acknowledges Zero Hedge-style panic.
- The creator warns that speed crashes will become more frequent due to AI-agent-driven momentum and leverage — a structural risk of faster, more violent unwinds.
- If the Clarity Act in the US fails (currently at 40% chance), it could cause knee-jerk weakness in crypto, but creator downplays this as non-critical.
- Creator explicitly says 'I don't think we're going to necessarily break through the 200 day moving average before October, November' — so near-term crypto breakout is not expected. -
Actionable Trading/Allocation Plan (🎯):
- Monitor the Morgan Stanley Tech Momentum Factor Index for any stabilization or further decline beyond -40% on an 18-day rate of change.
- Track Ethereum/Bitcoin cross ratio for a break above the 200-day moving average, which would confirm the agent-led crypto rotation thesis.
- Track the 60-day volatility of tech (currently 92) against S&P 500 vol (low) — if tech vol declines faster than S&P vol, leverage may return.
- Monitor bank earnings (JPM, GS) and forward guidance for sustained 'good as it gets' comments; any material negative surprise would invalidate the non-recession thesis.
- Watch for the release of the creator's Vera Rubin / 800-volt DC paper and its constituent stocks for step-up function earnings signals.

-
Creator Horizon Category (⏱️): Long-Horizon Macro / Structural — The podcast discusses the structural relationship between AI data center buildout, energy policy, and regulatory moratoria, with no reference to short-term price actions or technical setups.
-
One-Line Thesis (💡): All-In Podcast creators argue that critiques of hyperscale data centers regarding power consumption, land use, noise, water use, and pollution are largely false or manageable, and that the optimal policy is to allow data centers to build behind the meter with their own power generation, as advocated by the U.S. president.
-
Key Data Points (📊):
- New York Governor Kathy Hochul announced the nation's first-ever statewide moratorium on hyperscale data centers — claimed as false accusation against data centers.
- Claim: Data centers connecting to the grid without producing more power can drive up utility prices and force competition with residential ratepayers.
- Claim: Allowing data centers to build 'behind the meter' with their own power is the solution advocated by the president and Chamath.
- Claim: Data centers are 'a model of land use efficiency' and the U.S. has 'a ton of land'.
- Claim: Noise pollution from data centers is 'largely made up' and can be mitigated by distance from residential areas.
- Claim: Water consumption by modern data centers is 'a total hoax' because they recirculate water.
- Claim: Natural gas, which powers most data centers, is 'one of the most clean burning sources of power that we have'.
- Claim: Data centers are 'one of the best things we can be building as a nation' when comparing economic impact to other factors. -
Technical Levels & Setups OR Macro Drivers (📌):
- New York's statewide moratorium on hyperscale data centers acts as a regulatory headwind that the creators believe is based on false claims.
- The president's policy advocacy for AI companies to become power companies and build behind the meter is presented as a key catalyst for solving energy and utility problems.
- The creators frame public angst about AI as being misplaced onto data centers, implying that broader public sentiment could drive further regulatory or political risks. -
Risk/Reward Framework (⚖️):
- Entry: Not established by the available evidence.
- Stop: Not established by the available evidence.
- Targets: Not established by the available evidence.
- Risk/Reward: Not established by the available evidence.
- Position Size: Not established by the available evidence.
- Probability: Not established by the available evidence. -
Scenario Analysis (🔄):
| Scenario | Probability | Target | Trigger |
|---|---|---|---|
| Base | Not established by the available evidence. | Not established by the available evidence. | If the 'behind the meter' policy advocated by the president is adopted, the creators suggest the energy and utility issues would be resolved, enabling continued data center buildout. |
| Bear | Not established by the available evidence. | Not established by the available evidence. | If state-level moratoria like New York's become more widespread and/or if public angst about AI leads to additional restrictions on data center construction, the buildout could be constrained. |
| Bull | Not established by the available evidence. | Not established by the available evidence. | If the creators' assertions that data centers are land-efficient, low-noise, water-efficient, clean-powered, and economically beneficial become widely accepted by regulators and the public, policy headwinds could recede and accelerate development. | -
Risk Factors (⚠️):
- The evidence provided is a partisan podcast transcript; actual data on data center water recycling rates, noise impact studies, land use efficiency metrics, and the carbon intensity of natural-gas-powered data centers are not provided and need independent verification.
- New York's moratorium may be based on detailed legislative findings that contradict the creators' assertions; no evidence is given to assess the balance of those findings.
- The claim that natural gas is 'one of the most clean burning sources' omits methane leakage and lifecycle greenhouse gas comparisons, which could materially alter the pollution assessment.
- The claim that water consumption is 'a total hoax' contradicts documented water usage in many data centers; verification of cooling system designs and regional water stress is required. -
Actionable Trading/Allocation Plan (🎯):
- Obtain the full text of New York's statewide moratorium on hyperscale data centers to compare the creators' claims about power, land, noise, water, and pollution against the legislative rationale.
- Verify the president's policy statements regarding allowing AI companies to become power companies and build behind the meter, including any executive orders or proposed legislation.
- Cross-reference industry data on data center water usage (evaporative vs. recirculating systems) and noise studies near residential areas to assess the 'hoax' and 'largely made up' characterizations.
- Review EPA or DOE analyses comparing the lifecycle emissions of natural-gas-powered data centers versus grid average or renewable-powered alternatives.
- Monitor other states for similar moratoria or policy proposals to gauge the risk of a broader regulatory trend.
-
Creator Horizon Category (⏱️): Long-Horizon Macro — The creator argues that the market tends to be higher over multi-decade intervals, making the thesis inherently long-horizon.
-
One-Line Thesis (💡): The creator claims that buying a broad market index when it is down is generally a good idea because, over 10–30 years, the market is likely to be higher, while individual stocks can go to zero.
-
Key Data Points (📊):
- buying the stock market today – the creator refers to buying a broad market index
- 10, 20, 30 years from now – the claimed horizon for higher market values
- individual stock could possibly go to zero – claim about idiosyncratic risk -
Technical Levels & Setups OR Macro Drivers (📌):
- Market timing on broad index drawdowns is presented as a setup, supported by the idea that odds favor a higher market over multi-decade periods. -
Risk/Reward Framework (⚖️):
- Entry: Not established by the available evidence.
- Stop: Not established by the available evidence.
- Targets: Not established by the available evidence.
- Risk/Reward: Not established by the available evidence.
- Position Size: Not established by the available evidence.
- Probability: "the odds are pretty pretty in your favor" – no specific probability stated -
Scenario Analysis (🔄):
| Scenario | Probability | Target | Trigger |
|---|---|---|---|
| Base | Not established by the available evidence. | Not established by the available evidence. | Buying a broad market index when it is down and holding for 10–30 years yields a higher value. |
| Bear | Not established by the available evidence. | Not established by the available evidence. | An individual stock bought today goes to zero, illustrating the necessity of diversification through an index. | -
Risk Factors (⚠️):
- The claim that the market will be higher 10-30 years from now is not supported by specific historical data or failure scenarios in the evidence.
- No explicit stop-loss, rebalancing regime, or risk of catastrophic market non-recovery is discussed.
- The recommendation to buy an index when down lacks a defined metric for 'down' (e.g., percent drawdown). -
Actionable Trading/Allocation Plan (🎯):
- Monitor the performance of the chosen index versus the creator's implied 10–30 year holding period without active management.
- Cross-reference the creator's claim with academic literature or long-term total return data sets to confirm the probability statement.

-
Creator Horizon Category (⏱️): Short-Term Technical — The creator is focusing on daily/weekly bounces, immediate earnings catalysts (Tesla/big tech late July), and a decision on monthly consolidation in the NASDAQ within the next week or two.
-
One-Line Thesis (💡): The creator argues that semiconductor and memory selloffs are a normal, inevitable correction in a prolonged euphoric uptrend, with the S&P 500 still healthy due to rotation into financials and transports, but the NASDAQ is at a critical support level that will determine whether a monthly consolidation phase begins.
-
Key Data Points (📊):
- DRRAM entry in $49s, sold half in $50s, break even under $48.
- SMH bounced to about 50% retracement on the day.
- Semiconductor selloff currently only 31% (versus a typical 40%+ pullback the creator expects).
- RGTI (quantum) dropped 78% in a few months, cited as a contrast.
- S&P 500 weekly EMA 12 support is holding; NASDAQ has a double top at all-time high and is testing consolidation low.
- Financial sector (XLF) hit new all-time highs; Transportation (IYT) hit new all-time highs.
- Apple cup-and-handle daily breakout on weekly higher low.
- Amazon highest level in over a month on Thursday.
- Meta had a big breakout.
- Cannabis (MSOS): Monthly lower high set, equilibrium expected to break Q3/Q4, rescheduling catalyst potentially late August.
- Gold still testing the low, possible daily falling wedge; Silver already made a lower low.
- Oil/Energy: monthly higher low most likely scenario; weekly lower high most likely result of current bounce.
- VIX spike on Friday; prior to that (Mon–Wed) VIX not spiking despite NASDAQ weakness. -
Technical Levels & Setups OR Macro Drivers (📌):
- Semiconductor/memory downtrend: bears in full control of the short-term daily timeframe; daily lower highs are the most likely initial result of any bounce.
- Rotation from semis into financials, transports, and mags (software) has been the primary offset; this inverse relationship shifted in the last two days (all dropping together), magnifying NASDAQ weakness.
- Key verification: next weekly bounce in semis – does it achieve a 50%+ bounce retracement or confirm a weekly downtrend?
- Bullish scenario for NASDAQ: establishing the consolidation low as a support trench (double bottom) leading to sideways consolidation.
- Bearish scenario for NASDAQ: monthly consolidation officially underway, next target monthly EMA 12 at prior all-time highs.
- S&P 500 weekly higher low break would be the first red flag.
- Major red flag for broader market: financials, healthcare, and NASDAQ all dropping together – has not happened yet.
- Copper: 'potential weekly bull flag' after a double bottom on daily; bears need to lose weekly EMA 12 for the megaphone pattern to continue. -
Risk/Reward Framework (⚖️):
- Entry: Not established by the available evidence.
- Stop: Not established by the available evidence.
- Targets: Not established by the available evidence.
- Risk/Reward: Not established by the available evidence.
- Position Size: Not established by the available evidence.
- Probability: Not established by the available evidence. -
Scenario Analysis (🔄):
| Scenario | Probability | Target | Trigger |
|---|---|---|---|
| Bear | Not established by the available evidence. | Monthly EMA 12 on the NASDAQ (prior all-time highs) – creator states 'would be a potential target' if weakness continues. | CONVINCING breakdown of the NASDAQ consolidation low with more downside; weekly downtrend confirmed on the next bounce. |
| Bull | Not established by the available evidence. | Not established by the available evidence. | Bulls confirm an hourly uptrend on Monday, break Friday's high, then the daily lower high becomes the most likely initial result; weekly bounce eventually sets a weekly higher low. |
| Base | Not established by the available evidence. | Not established by the available evidence. | NASDAQ establishes the current consolidation low as support and trades sideways for several weeks; semis find a sideways range and financials/transports continue uptrends. | -
Risk Factors (⚠️):
- Fundamental backdrop of memory names may be different this cycle (proven track records) but does not prevent a 40%+ pullback.
- The creator's bounce trading relies on identifying short-term extremes; if the selloff continues without a weekly bounce in the next couple of weeks, his strategy of 'failing small' could accumulate losses.
- The inverse relationship between semis and other sectors could shift permanently (all sectors falling together), which would be a major VIX spike signal.
- Earnings (Tesla next week, big tech late July) could act as a positive or negative catalyst not currently priced in.
- The creator admits 'we are not at crushed RSI levels' – so further another leg down remains possible. -
Actionable Trading/Allocation Plan (🎯):
- Monitor the NASDAQ consolidation low level for a convincing break (monthly consolidation) vs. a double bottom bounce.
- Watch for the next weekly bounce in semiconductors (SMH) – track whether it achieves a 50%+ retracement or confirms a weekly lower high.
- Track the inverse relationship between semis and financials/transports/healthcare – note if they all drop together (red flag) or if rotation continues.
- Check VIX behavior: a sustained spike above recent levels would corroborate a broader market selloff.
- Observe DRRAM/SNDK/MU for a daily uptrend confirmation or continued daily lower highs.
- Watch Korea (Kospi) for signs of a capitulation bottom from forced selling (margin calls).
- Keep an eye on cannabis (MSOS) for a potential monthly higher low and the rescheduling catalyst in late August.
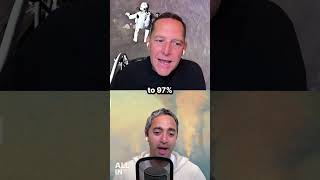
-
Creator Horizon Category (⏱️): Long-Horizon Macro / Structural — The creator describes a foundational breakthrough in molecular biology and aging reversal that would underwrite a long-duration structural market thesis for the underlying technology and related products.
-
One-Line Thesis (💡): The creator claims that a novel enzyme, designed using AlphaFold and directed evolution to degrade the advanced glycation end-product CML, has been demonstrated on elderly human skin ex vivo to reverse biological age to that of a 31-year-old, representing a 'groundbreaking demonstration' that could underpin a structural market opportunity.
-
Key Data Points (📊):
- CML (carboxymethyl-lysine) is described as 'the predominant molecule' driving aging through accumulation in the extracellular matrix, with no natural breakdown mechanism.
- Several degradation sites showed over 90% CML removal.
- Application of the enzyme to actual elderly human skin eliminated '55% of the CML on the skin', reversing the skin's age to that of a 31-year-old from donors aged 'greater than 70'.
- Creators claim the market for a topical cream formulation could be '$2 trillion' (one creator states 'It will be a trillion-dollar market' and another responds 'That alone is $2 trillion'). -
Technical Levels & Setups OR Macro Drivers (📌):
- Enzyme design using AlphaFold and directed evolution as a platform proof-of-concept for targeting aging biomarkers not addressed by existing consumer or therapeutic products.
- Demonstration of ex vivo dermal age reversal as a catalyst for potential drug or cosmetic regulatory pathways and licensing deals.
- High-throughput screening-enabled optimization of a 'novel protein that doesn't exist in nature today' creates a defensible IP moat. -
Risk/Reward Framework (⚖️):
- Entry: Not established by the available evidence.
- Stop: Not established by the available evidence.
- Targets: Not established by the available evidence.
- Risk/Reward: Not established by the available evidence.
- Position Size: Not established by the available evidence.
- Probability: Not established by the available evidence. -
Scenario Analysis (🔄):
| Scenario | Probability | Target | Trigger |
|---|---|---|---|
| Bull | Not established by the available evidence. | Not established by the available evidence. | Successful replication of ex vivo results in in vivo human trials and FDA or regulatory clearance for topical anti-aging product (or equivalent economic monetization event). |
| Base | Not established by the available evidence. | Not established by the available evidence. | Verify the trigger against the source evidence. |
| Bear | Not established by the available evidence. | Not established by the available evidence. | Failure to reproduce CML clearance in living human subjects, safety signal from enzymatic activity on other proteins, or inability to achieve stable formulation for topical delivery. | -
Risk Factors (⚠️):
- The claim of reversing skin age to a 31-year-old is based on ex vivo tissue from a single elderly cohort (greater than 70); no in vivo human data are cited.
- No disclosure of the specific enzyme's molecular identity, half-life, immunogenicity, or delivery vehicle for dermal absorption.
- The $2 trillion market estimate (creator's own speculative figure) is not supported by any revenue model or addressable market sizing; it is cited as a humorous hyperbole within the podcast.
- The creator gives no information about the entity developing the enzyme, its stage of development, funding, or regulatory pathway.
- No peer-reviewed publication or third-party verification of the ex vivo skin results is referenced. -
Actionable Trading/Allocation Plan (🎯):
- Verify if any scientific preprint or paper matches the claimed ex vivo human skin experiment (55% CML reduction, age reversal to 31).
- Identify the company or research group named in the full podcast (not in this excerpt) and review their pipeline and SEC/regulatory filings.
- Monitor for clinical trial registrations (e.g., on ClinicalTrials.gov) involving topical CML-degrading enzymes for anti-aging indications.
- Assess whether the directed evolution and AlphaFold methodology described has been used to produce a patent for a CML-specific enzyme.

-
Creator Horizon Category (⏱️): Long-Horizon Macro / Structural — The discussion focuses on the possible creation of a self-regulatory organization for AI, state-level regulatory capture trends, and structural shifts in payments and energy that will unfold over years.
-
One-Line Thesis (💡): The All-In Podcast panel argues that a FINRA-style self-regulatory organization (SRO) for frontier AI models, as proposed by DeepMind's Demis Hassabis, is the least-bad regulatory path, provided it remains voluntary, focused on catastrophic risk, excludes open-source, and avoids becoming a stepping stone to an FAA-style agency; they simultaneously claim that Anthropic is pursuing a deliberate regulatory-capture strategy at the state level to restrict open-source and smaller competitors, and that a Stripe/Block/Advent consortium offer for PayPal could create a Visa/Mastercard competitor by combining Stripe's merchant relationships with PayPal's consumer accounts and Block's point-of-sale infrastructure.
-
Key Data Points (📊):
- Demis Hassabis proposal: US-led international AI standards body modeled on FINRA; frontier labs submit models 30 days before release; voluntary initially, then mandatory; body can coordinate a slowdown in development if the situation demands it — TRANSCRIPT-BACKED
- Elon Musk called the proposal 'thoughtful' — TRANSCRIPT-BACKED
- David Sacks' five conditions: broad industry representation including startups and open source, review only of frontier models that represent a step-change in intelligence, focus solely on catastrophic risk (cyber, CBRN), voluntary-first before mandatory, and must be a substitute for a new regulatory agency — TRANSCRIPT-BACKED
- Sacks claims Anthropic's strategy is 'one-upmanship that encourages states to impose increasingly tougher AI guard rails' per a Politico article, and that Anthropic has already won regulations in California, Illinois, New York — TRANSCRIPT-BACKED
- Stripe, Block, and Advent jointly offering to acquire PayPal for ~$60/share (small premium); Block contributing $17 billion in equity; PayPal has 439 million consumer accounts — TRANSCRIPT-BACKED
- Stripe processes ~$2 trillion annual transaction volume; PayPal processes ~$1.7 trillion — TRANSCRIPT-BACKED
- New York Governor Kathy Hochul signed 'nation's first ever statewide moratorium on hyperscale data centers' — TRANSCRIPT-BACKED -
Technical Levels & Setups OR Macro Drivers (📌):
- Regulatory overhang: The panel sees a bipartisan push toward AI regulation, with the 'Overton window' having moved to the point where an SRO is considered the least-bad option.
- Anthropic's state-level regulatory capture: Sacks cites a Politico article as evidence that Anthropic is actively pushing for tougher rules in blue states to create a patchwork that disadvantages competitors.
- PayPal acquisition rationale: The combination of Stripe's merchant APIs, PayPal's 439M consumer accounts, Block's point-of-sale, and stablecoin infrastructure (Bridge, SIUSD) could create a direct competitor to Visa/Mastercard.
- Energy bottleneck for AI compute: 40% of data-center projects are being mothballed; New York's moratorium and similar movements threaten to widen the energy deficit, potentially slowing AI model deployment.
- Foreign influence operations: The panel claims Russia and China are running influence campaigns to stoke anti-data-center sentiment in the US, referencing an OpenAI blog post about PRC-linked operations.
- Cost advantage of local compute: Sacks predicts Apple's M7 Ultra chip (supporting up to 1.5 TB RAM) will allow local execution of Opus-level models, putting downward price pressure on cloud API providers.
- AlphaFold-driven anti-aging therapy: The ability to design a novel enzyme to clear extracellular matrix glycation (CML) could open a large cosmetic and therapeutic market, but clinical delivery mechanism is unproven. -
Risk/Reward Framework (⚖️):
- Entry: Not established by the available evidence.
- Stop: Not established by the available evidence.
- Targets: Not established by the available evidence.
- Risk/Reward: Not established by the available evidence.
- Position Size: Not established by the available evidence.
- Probability: Not established by the available evidence. -
Scenario Analysis (🔄):
| Scenario | Probability | Target | Trigger |
|---|---|---|---|
| Bull | Not established by the available evidence. | Not established by the available evidence. | The SRO proposal is adopted with Sacks' five conditions intact (voluntary, catastrophic-risk only, open-source included), preempting state-level patchwork and avoiding an FAA-style agency. The Stripe/Block/Advent PayPal deal closes without antitrust challenges, creating a viable Visa/Mastercard competitor. Enterprise AI token costs collapse via local compute (Apple M7 Ultra) and open models, driving adoption. |
| Base | Not established by the available evidence. | Not established by the available evidence. | The SRO becomes mandatory over time and expands scope beyond catastrophic risk; state-level regulatory patchwork continues in blue states. The PayPal acquisition faces regulatory scrutiny but ultimately closes with concessions. Token-spend costs remain elevated for frontier models but cheaper open alternatives gain share among cost-conscious enterprises. |
| Bear | Not established by the available evidence. | Not established by the available evidence. | The SRO becomes a stepping stone to an FAA-for-AI agency, imposing multi-year certification delays and effectively halting US frontier model releases. Anthropic's state-by-state strategy leads to a de facto ban on open-source and small AI startups in multiple states. New York's moratorium on hyperscale data centers spreads to other states, choking compute supply. The PayPal acquisition is blocked on antitrust grounds or fails to deliver synergies. | -
Risk Factors (⚠️):
- Claims about Anthropic's regulatory-capture strategy are based on a single Politico article and the panel's interpretation; no independent confirmation of the alleged 'one-upmanship' strategy is provided.
- The Stripe/Block/Advent offer for PayPal is described as a breaking story with conflicting reports; the exact structure, price, and composition (whether Block is involved) is not yet confirmed.
- The Grok 4.5 data leak is described as 'quietly disabled on July 13' and data allegedly deleted; full technical audit of whether data was actually deleted is not presented.
- Apple's lawsuit against OpenAI is at the allegation stage; no court ruling or discovery outcome is cited.
- The Calico/Revel Pharma enzyme study is a preprint or early publication; in-vivo human testing and delivery method (cream vs injection vs RNA) are not yet demonstrated.
- Foreign-influence claims about anti-data-center sentiment rely on an OpenAI blog post and historical GMO analogy; specific causal evidence linking current protests to foreign actors is not provided.
- Energy deficit projections (2.5 Californias by 2050) and the claim that 40% of data-center projects are mothballed are asserted without a cited source or methodology.
- The claim that FINRA has not produced innovation is a subjective opinion, not a factual claim. -
Actionable Trading/Allocation Plan (🎯):
- Monitor the status of Demis Hassabis' SRO proposal: track endorsements from frontier labs, legislative developments (federal vs state), and any language on preemption, open-source carve-outs, and scope (catastrophic risk only).
- Verify the Politico article 'Inside Anthropic state-by-state plan to ratchet up AI rules' and cross-reference with actual state-level AI bills (CA SB53, IL, NY) to assess whether Anthropic's strategy matches the panel's characterization.
- Track the Stripe/Block/Advent offer for PayPal: confirm the exact bid price, equity contributions, and whether the deal structure includes an operational role for Stripe. Monitor DOJ/FTC reaction and how the relevant market is defined (Visa/Mastercard duopoly vs payments API).
- Monitor OpenAI's response to Apple's trade-secrets lawsuit: watch for discovery requests, internal communications from Tang Tan, and any admissions of receiving proprietary information.
- Review Calico/Revel Pharma publication for peer-reviewed status and early clinical trial plans; watch for partnerships with cosmetic or pharmaceutical companies for a topical formulation.
- Track New York's data-center moratorium and similar proposals in other states; monitor rulings on clean-air permitting for behind-the-meter gas generation (Bloom Energy, Elon Musk's approach).
- Verify the token-pricing claims by checking current listed prices for Fable, Soul, Grok, and Chinese models on their official API pricing pages.
- Monitor the All-In Podcast's future episodes for follow-up on the SRO proposal and any corporate actions from Anthropic, Stripe, or OpenAI.

-
Creator Horizon Category (⏱️): Short-Term Technical — The narrative details a specific, one-off wedding event on July 3rd in Manhattan with location released at 4:00 AM the day of the wedding, implying a short-term, event-driven focus.
-
One-Line Thesis (💡): The creator recounts that Travis Kelce and Taylor Swift sent wedding invitations exclusively via text message with multi-factor authentication, a non-disclosure agreement, and dynamic location release to prevent leaks, which the creator initially deleted and blocked as spam.
-
Key Data Points (📊):
- Wedding date: July 3rd — exact date of the event mentioned in the invitation process.
- Location: Manhattan — initial location revealed, with exact location released at 4:00 AM on the day of the wedding.
- Multi-factor authentication — required to access the initial text invitation.
- Non-disclosure agreement (NDA) via DocuSign — described as 'had teeth' to enforce confidentiality.
- Digital invitation with watermark — included the creator's name (Jonathan and Cindy Thomas) to prevent unauthorized sharing.
- Invitation delivery method: text message sent every two to three days — rationale given that invitees were never in one place. -
Technical Levels & Setups OR Macro Drivers (📌):
- Privacy and security protocols for high-profile events — the multi-factor authentication and NDA indicate a setup to control information flow.
- Dynamic location release — the exact venue was withheld until the morning of the wedding to prevent leaks. -
Risk/Reward Framework (⚖️):
- Entry: Not established by the available evidence.
- Stop: Not established by the available evidence.
- Targets: Not established by the available evidence.
- Risk/Reward: Not established by the available evidence.
- Position Size: Not established by the available evidence.
- Probability: Not established by the available evidence. -
Scenario Analysis (🔄):
| Scenario | Probability | Target | Trigger |
|---|---|---|---|
| Bull | Not established by the available evidence. | Not established by the available evidence. | The creator's story is independently verified by news outlets or official confirmation from the couple's representatives. |
| Base | Not established by the available evidence. | Not established by the available evidence. | The account remains unverifiable due to the NDA and private nature of the event, but no contradictory evidence emerges. |
| Bear | Not established by the available evidence. | Not established by the available evidence. | External reporting reveals the story is fabricated or materially inaccurate, or the creator recants the story. | -
Risk Factors (⚠️):
- The entire story is a single anecdote from the creator with no independent verification.
- The claimed NDA and multi-factor authentication process cannot be confirmed due to confidentiality.
- No third-party sources (e.g., news articles, social media posts) referenced to support the wedding details. -
Actionable Trading/Allocation Plan (🎯):
- Monitor reputable entertainment or news outlets for any reporting on Taylor Swift and Travis Kelce's wedding on July 3rd in Manhattan.
- Check public records or wedding registries for any evidence of the event or the specific security protocols described.
- Seek corroboration from other attendees mentioned in the story (e.g., other invitees who received similar text invitations).

-
Creator Horizon Category (⏱️): Other — The creator frames the claim as a near-term warning shot about enterprise SaaS spending 'for the rest of the summer' but its implications may extend to the broader enterprise tech cycle.
-
One-Line Thesis (💡): The creator argues that IBM's pre-announcement of a weak quarter reveals that enterprise SaaS spending is not a corporate priority and likely will remain weak through the summer, serving as a warning for investors.
-
Key Data Points (📊):
- IBM pre-announced a weak quarter — creator cites this as the first major tech company to do so.
- Enterprise customers are spending on compute, cybersecurity, servers, CPUs, GPUs, and memory — 'anything but what IBM sells'. -
Technical Levels & Setups OR Macro Drivers (📌):
- IBM's pre-announcement is treated as a warning shot that enterprise SaaS spending is not a priority for corporations through the summer.
- Shifting enterprise budget priorities: customers are buying compute, AI-related infrastructure (GPUs, CPUs, memory, servers), and cybersecurity, while deprioritizing enterprise software/SaaS.
- The creator identifies IBM's quarter as the 'quiet part' being said out loud regarding enterprise spending. -
Risk/Reward Framework (⚖️):
- Entry: Not established by the available evidence.
- Stop: Not established by the available evidence.
- Targets: Not established by the available evidence.
- Risk/Reward: Not established by the available evidence.
- Position Size: Not established by the available evidence.
- Probability: Not established by the available evidence. -
Scenario Analysis (🔄):
| Scenario | Probability | Target | Trigger |
|---|---|---|---|
| Bear | Not established by the available evidence. | Not established by the available evidence. | IBM's weak quarter is confirmed and followed by similar pre-announcements from other enterprise SaaS companies, indicating a broader spending pullback through the summer. | -
Risk Factors (⚠️):
- IBM's weak quarter could be company-specific, not representative of all enterprise SaaS spending (e.g., product cycle, execution issues).
- The creator's claim that spending is shifting to compute/cybersecurity may reflect a secular trend rather than a temporary summer pause in SaaS.
- No specific financial figures (revenue miss %, dollar amounts) are provided to quantify the weakness.
- The evidence does not specify which IBM segment(s) drove the pre-announcement, making it difficult to isolate SaaS exposure. -
Actionable Trading/Allocation Plan (🎯):
- Monitor IBM's next full quarterly report for segment-level revenue details to confirm the nature and magnitude of the weakness.
- Track pre-announcements and earnings calls from other enterprise SaaS names (e.g., Salesforce, Workday, SAP) over the following months to see if the pattern broadens.
- Verify whether enterprise IT spending surveys or indices (e.g., Gartner, IDC) show a near-term shift away from SaaS toward AI infrastructure.

-
Creator Horizon Category (⏱️): Other — The creator discusses intraday market rotation and positioning ahead of earnings season, which is a very short-term tactical horizon.
-
One-Line Thesis (💡): The creator argues that a new Chinese AI model (Kimmy K3) is causing a risk-off rotation out of AI-related chips and into defensive staples and cybersecurity, but he questions the durability of the move and believes institutional positioning/deleveraging is a larger factor than the model itself.
-
Key Data Points (📊):
- Creator claims the Chinese model 'Kimmy K3' is 'good enough to get Wall Street freaking out' within 24 hours.
- Creator references 'GLM' and says 'GLM was not good enough'.
- Creator states 'chips are down about 20% from the high' (referring to Korea/semiconductor index).
- Creator states 'every other earnings has actually been good so far this early into the earning season' and 'Not one miss.'
- Creator states 'SPY near the low' and 'NASDAQ is down by 2.3' at one point during the open.
- Creator mentions Apple 'surpasses Nvidia to become world's most largest company'.
- Creator states 'Intel below 90 again' and 'Intel has earnings next week'.
- Creator states 'Netflix is down seven' approximately an hour into trading.
- Creator states 'chips have made a 3% move in about 30 minutes' describing a recovery.
- Creator states 'they (chips) are down 25% from the highs on the chips. So we are in that bare market.' referring to the semiconductor index.
- Creator states 'the year-to-date laggers and just any high quality name that's down substantially' are the 'best' opportunities.
- Creator mentions specific tickers: Apple (AAPL), Walmart (WMT), Coca-Cola (KO), Colgate (CL), Estee Lauder (EL), ServiceNow (NOW), Adobe (ADBE), Checkpoint (CHKP), Oracle (ORCL), NVIDIA (NVDA), AMD (AMD), Qualcomm (QCOM), Intel (INTC), Microsoft (MSFT), Meta (META), Google (GOOGL), Amazon (AMZN), CrowdStrike (CRWD), Palo Alto (PANW), Boeing (BA), Netflix (NFLX), Tesla (TSLA), Ford (F), Freeport-McMoRan (FCX), and sector ETFs SPY, XLP, XLV, IGV, XLF, IBB, XBI.
- Creator states 'we are in a bare market' for chips after the model news.
- Creator states 'Make it free' as a core risk management principle for options: sell enough contracts to recover cost after a 100% gain, then ride the rest.
- Creator mentions a personal SpaceX options trade: 'five into 50' and '1,000%' gain executed within minutes. -
Technical Levels & Setups OR Macro Drivers (📌):
- The initial panic is driven by the claim that China can reproduce AI models more cheaply, threatening US semiconductor capex.
- The creator warns the panic is partly an excuse for existing positioning/chip weakness.
- Rotation into defensive names (staples, healthcare, cybersecurity) is noted but described as not very strong initially.
- Creator expects earnings season to provide the next major directional catalyst, especially with 'Tesla, Google, Intel' reporting next week.
- Creator expects 'Service Now' earnings to affect software sentiment.
- Creator repeatedly emphasizes that 'no bad earnings yet' is an anomaly and a potential bullish signal if it continues. -
Risk/Reward Framework (⚖️):
- Entry: Not established by the available evidence.
- Stop: Not established by the available evidence.
- Targets: Not established by the available evidence.
- Risk/Reward: Not established by the available evidence.
- Position Size: Creator states he keeps most scalping trades 'small' (e.g., '5 cents' contracts) and uses a 'make it free' strategy; no explicit position size is given for any trade.
- Probability: Not established by the available evidence. -
Scenario Analysis (🔄):
| Scenario | Probability | Target | Trigger |
|---|---|---|---|
| Bull | Not established by the available evidence. | Not established by the available evidence. | Creator says if the initial panic hold does not test fresh lows, the market used the news to 'position' and recovery follows; he also says 'if we don't touch the low again, awesome'. |
| Base | Not established by the available evidence. | Not established by the available evidence. | Creator describes the day as 'slightly risk off' with no clear rotation; if the market stays in a 'box' for the next quarter, he warns against leverage. |
| Bear | Not established by the available evidence. | Not established by the available evidence. | Creator states 'if this comes back down to chips, Korea violently sells off one more time after violently ripping, it'll be a 4% day' and that would confirm 'risk off'. | -
Risk Factors (⚠️):
- The creator's claims about the Kimmy K3 model's performance relative to US models are unverified and based on 'apparently within 24 hours' sources.
- The 'no bad earnings yet' claim is a generalization that may change as more companies report.
- The creator's specific entry/exit on the SpaceX trade is based on a news headline ('SpaceX in talks to provide compute for Pentagon') which is a single-sourced event and may not repeat.
- The creator's analysis of 'chips are in a bare market' is a characterization of price action, not a fundamental valuation claim.
- The creator's strategy relies on 'make it free' which assumes the ability to sell at a 100% gain, which may not always be possible, especially in illiquid options.
- No specific price levels or stop losses are provided for any trade, making risk/reward unquantifiable. -
Actionable Trading/Allocation Plan (🎯):
- Verify the 'Kimmy K3' model performance claims against independent benchmarks and technical reports.
- Monitor semiconductor index (e.g., SMH) for a breakdown below intraday lows mentioned (down ~20% from highs) to assess the bear scenario.
- Track earnings results for the companies mentioned (AAPL, GOOGL, TSLA, INTC, NOW) next week to confirm or deny the 'no bad earnings' narrative.
- Observe the relative performance of XLP (staples) and XLV (healthcare) vs. SMH to gauge the rotation thesis.
- For options traders, backtest the 'make it free' strategy on similar volatile days to evaluate its practicality.
- Cross-reference the creator's claim of 'chips down 25% from highs' with actual index data to confirm accuracy.
-
Creator Horizon Category (⏱️): Other — The video segment discusses a viral social-media anecdote with no identifiable market horizon, financial instrument, or economic time frame.
-
One-Line Thesis (💡): The creator claims a viral story about a husband giving a raffle-winning YSL makeup kit to a female coworker is fake, based on a tweet deletion, but offers no verifiable source or financial-investment thesis.
-
Key Data Points (📊):
- "he won like some raffle at work and the basket had everything YSL products" — claim of prize contents
- She deleted the tweet last night. My marriage was shaken over a makeup kit. — claim of tweet deletion as evidence of fakeness
- I don't I think she's reading too much into it. — creator's stated opinion that the wife's interpretation is overblown
- Bad take. — creator's assessment of an opposing view -
Technical Levels & Setups OR Macro Drivers (📌):
- The creator identifies a viral social-media narrative as a potential catalyst for attention, but provides no evidence of any financial-market setup or catalyst. -
Risk/Reward Framework (⚖️):
- Entry: Not established by the available evidence.
- Stop: Not established by the available evidence.
- Targets: Not established by the available evidence.
- Risk/Reward: Not established by the available evidence.
- Position Size: Not established by the available evidence.
- Probability: Not established by the available evidence. -
Scenario Analysis (🔄):
| Scenario | Probability | Target | Trigger |
|---|---|---|---|
| Bull | Not established by the available evidence. | Not established by the available evidence. | Verification that the tweet was actually deleted and that the story was fabricated — no market trigger exists. |
| Base | Not established by the available evidence. | Not established by the available evidence. | Continued social-media debate with no financial impact — no market trigger exists. |
| Bear | Not established by the available evidence. | Not established by the available evidence. | Verification that the story is real and the husband's action was intended to insult — no market trigger exists. | -
Risk Factors (⚠️):
- The segment contains no financial data, tickers, prices, or portfolio implications; any interpretation as market intelligence would be unfounded.
- The claim of fakeness relies solely on the creator's unsupported assertion that a tweet was deleted, which has not been independently verified.
- The evidence lacks any connection to publicly traded companies, indices, or asset valuations. -
Actionable Trading/Allocation Plan (🎯):
- Verify whether the original tweet cited in the video ("My marriage was shaken over a makeup kit") remains publicly accessible or has been deleted, and archive a screenshot for record.
- Search for the referenced viral story using the described details (husband, YSL raffle, female coworker) to confirm or refute the creator's claim that it is "fake."
- Note that no position, entry, stop, target, or probability can be derived from this evidence; categorize as non-financial content unsuitable for structured market analysis.

-
Creator Horizon Category (⏱️): Long-Horizon Macro / Structural — The creator discusses the enduring structural value of non-fiction books as a learning medium, contrasting it with the perceived inefficiency of reading in general, without referencing any market or economic horizon.
-
One-Line Thesis (💡): The creator argues that while reading books is inefficient, non-fiction books remain a superior form of learning because they distill years of the author's thinking into a concentrated set of ideas.
-
Key Data Points (📊):
- Claim: Books are not an efficient way to digest information.
- Claim: Reading is hard and not an efficient form of learning.
- Claim: A non-fiction book typically contains ideas and thoughts that have been percolating for years and years and years.
- Claim: Authors distill those ideas down into one thing, making the book valuable if the reader puts in the time. -
Technical Levels & Setups OR Macro Drivers (📌):
- The perceived inefficiency of reading as a medium for information digestion.
- The concentrated, distilled nature of long-developed ideas in non-fiction books. -
Risk/Reward Framework (⚖️):
- Entry: Not established by the available evidence.
- Stop: Not established by the available evidence.
- Targets: Not established by the available evidence.
- Risk/Reward: Not established by the available evidence.
- Position Size: Not established by the available evidence.
- Probability: Not established by the available evidence. -
Scenario Analysis (🔄):
| Scenario | Probability | Target | Trigger |
|---|---|---|---|
| Base | Not established by the available evidence. | Not established by the available evidence. | The creator states that if one puts the time into reading a non-fiction book, it remains a great form of learning due to its distilled content. | -
Risk Factors (⚠️):
- The claim that books are inefficient is not supported by any comparative data or citations within the EVIDENCE.
- The assertion about the superior learning value of non-fiction books depends on the subjective quality and reliability of the author's distillation, which is not verified. -
Actionable Trading/Allocation Plan (🎯):
- Verify the assertion that reading is inefficient by reviewing studies on information retention rates across different media.
- Monitor the creator's specific recommendations of non-fiction books and compare their distilled theses against peer-reviewed findings on the same topics.

-
Creator Horizon Category (⏱️): Long-Horizon Macro — The creator focuses on multi-year structural shifts in asset management (active ETF adoption, platform distribution, AI adopters cycle) and longer-term demographic trends.
-
One-Line Thesis (💡): Jonathan Thomas argues that active ETFs are capturing a structurally growing share of flows, that Avantis's low-cost, academically driven factor approach is differentiating and scalable, and that the AI investment cycle is transitioning from creators to adopters, broadening the market and sustaining the bull market.
-
Key Data Points (📊):
- American Century has nearly $350 billion in AUM.
- Avantis launched in 2019; its first five ETFs have an average fee of 26 bps and have outperformed their benchmarks by an average of 280 bps per year.
- American Century directs over 40% of its dividends each year to the Stowers Institute for Medical Research, totaling about $2.2-2.3 billion over time.
- Excluding the Magnificent Seven, S&P 500 earnings are still expected to grow 20.9% in the current quarter; technology sector earnings growth is 65% year-over-year.
- The S&P 493 (ex-Mag 7) has contributed more to the S&P 500's year-to-date point change than the Mag 7. -
Technical Levels & Setups OR Macro Drivers (📌):
- Active ETF adoption is accelerating due to the 2019 ETF rule change, free commission trading (Schwab/Fidelity), and investor preference for transparency and low-cost active management.
- Avantis's philosophy is applied consistently across asset classes, making it easy for advisors to adopt multiple products and build core portfolio holdings.
- The AI investment cycle is moving from 'creators' (e.g., Nvidia) to 'adopters' (companies in financials, healthcare, industrials) who benefit from productivity gains.
- The broadening of market leadership: over 50% of S&P 500 stocks are up more than 10% year-to-date, reducing concentration risk.
- Demographic tailwind: potential peak global population combined with rising productivity (AI) could support economic growth and corporate margins. -
Risk/Reward Framework (⚖️):
- Entry: Not established by the available evidence.
- Stop: Not established by the available evidence.
- Targets: Not established by the available evidence.
- Risk/Reward: Not established by the available evidence.
- Position Size: Not established by the available evidence.
- Probability: Not established by the available evidence. -
Scenario Analysis (🔄):
| Scenario | Probability | Target | Trigger |
|---|---|---|---|
| Bull | Not established by the available evidence. | Not established by the available evidence. | Productivity gains from AI adoption materialize, driving higher margins and earnings for the S&P 493, sustaining the bull market and further broadening. |
| Base | Not established by the available evidence. | Not established by the available evidence. | Verify the trigger against the source evidence. |
| Bear | Not established by the available evidence. | Not established by the available evidence. | AI capex cycle ends abruptly (circular funding collapses), leading to an 'earnings bubble' burst; Nvidia and other AI creators see earnings normalize, and the market enters a severe correction. | -
Risk Factors (⚠️):
- Competition from copycat factor ETFs and larger incumbents (BlackRock, Vanguard, DFA) could erode Avantis's growth and performance advantage.
- The AI capex cycle relies on a circular funding structure; if commitments from investors like sovereign wealth funds or private equity vanish, earnings for AI-linked companies could decline sharply.
- Semi-transparent active ETFs (first attempt) failed due to lack of market uptake, showing execution risk in new product launches.
- Mutual fund outflows remain a headwind for American Century's legacy business, potentially pressuring overall firm revenue.
- If the Fed's policy path becomes restrictive again (due to sticky inflation or labor market tightness), equity valuations could compress across the board. -
Actionable Trading/Allocation Plan (🎯):
- Monitor Avantis's five-year track record (relative performance vs. benchmarks) and AUM growth to verify the sustainability of its outperformance and scaling.
- Track the share of year-to-date ETF flows going into active ETFs (currently 40%) to assess whether the structural shift continues.
- Follow earnings reports from AI 'adopters' in financials, healthcare, and industrials to confirm productivity-driven margin expansion.
- Watch Nvidia's forward P/E and revenue growth trends to gauge if the 'creators to adopters' narrative is borne out by multiple compression and earnings deceleration.
- Verify American Century's dividend flow to the Stowers Institute (40% of dividends) in annual reports to confirm capital structure stability.

-
Creator Horizon Category (⏱️): Short-Term Technical — The creator focuses on the upcoming earnings reports and price action during the next 45 days, particularly the next week's earnings and the market positioning around them.
-
One-Line Thesis (💡): The creator argues that the market is in a slow, range-bound environment with high leverage and crowded positioning, where earnings are good but price action is vulnerable to rotation and volatility, and the next 45 days will reveal whether holding cash or deploying it was the better choice.
-
Key Data Points (📊):
- "Netflix earnings, they were a little disappointing" — claim about Netflix earnings miss.
- "July is still green" — claim that despite recent selloffs, July remains positive.
- "Inflation saw the largest monthly decline in more than six years" — claim attributed to a media report in the creator's speech.
- "Drug prices are coming down by 70, 80, and 90%" — claim about prescription drug price reductions.
- "zero illegal aliens being admitted to the United States in the past 14 months" — claim about border security.
- "Murder rate at its lowest level since 1900" — claim about crime.
- "220 million US voter files" — claim about voter data compromised by China.
- "278,000 non-citizens who are registered to vote in federal elections" — claim from DHS review.
- "Nvidia was just at like 190 something" — reference to Nvidia's recent price level.
- "Global equity volumes... chips are 20%" — claim that semiconductors make up 20% of global equity volume.
- "One in every 30 Koreans is in a margin call" — fun fact cited by the creator.
- "Momentum stocks... worst drop since 2008 2009" — claim about high-beta momentum stocks.
- "Intel is down like 40% from the highs" — claim about Intel's decline. -
Technical Levels & Setups OR Macro Drivers (📌):
- Earnings season (Netflix, then next week Tesla, Google, ServiceNow, Intel, and broader set) as key catalyst for sector rotation and market direction.
- Chip selloff despite good earnings (Micron, ASML, TSM) — divergence between fundamentals and price action.
- Market in a box/range since mid-May, near all-time highs, with leverage and positioning creating tension.
- Potential rotation from momentum/small caps to MAG 7, with Apple leading ("Apple's kind of been going insane and this is breaking out").
- Cybersecurity laggards (Checkpoint, Zscaler) — watch for dip or rip; creator likes Net (likely Netskope or similar).
- Korea "doom loop" and ALGO-driven gap up/down as short-term volatility triggers.
- Creator's personal 30-day lockup on capital from Intel covered call, with a plan to potentially deploy 2-2.3 deposits into growth, dividend, and "shitty growth" plays. -
Risk/Reward Framework (⚖️):
- Entry: Not established by the available evidence.
- Stop: Not established by the available evidence.
- Targets: Not established by the available evidence.
- Risk/Reward: Not established by the available evidence.
- Position Size: Not established by the available evidence.
- Probability: Not established by the available evidence. -
Scenario Analysis (🔄):
| Scenario | Probability | Target | Trigger |
|---|---|---|---|
| Bull | Not established by the available evidence. | Not established by the available evidence. | Earnings beat across broad set, stable or positive rotation into MAG 7, no new negative narratives (Korea, Iran), and ALGO gap up holding. |
| Base | Not established by the available evidence. | Not established by the available evidence. | Continued slow grind, mixed earnings, rotation but no breakout, market remains in range near all-time highs. |
| Bear | Not established by the available evidence. | Not established by the available evidence. | Chip selloff deepens, leverage unwinds (Korea margin calls), negative earnings surprise (e.g., Netflix guidance miss leads to further downside), and market drops 2-3% quickly. | -
Risk Factors (⚠️):
- Creator's speech includes unverified claims about election security, voter fraud, and foreign interference that may not be factual or verifiable.
- No specific entry, stop, or target prices are provided for any trade, making risk/reward assessment impossible.
- The creator's personal portfolio and cash deployment plans are not actionable for viewers.
- Market direction is highly dependent on unpredictable earnings reactions and macro narratives (Korea, oil, ALGO).
- The claim that "one in every 30 Koreans is in a margin call" is an unverified statistic. -
Actionable Trading/Allocation Plan (🎯):
- Monitor earnings reports next week (Tesla, Google, ServiceNow, Intel) and assess whether the creator's thesis of "good earnings but poor price action" continues.
- Watch for rotation into MAG 7 (especially Apple) as a potential leadership change; verify if Apple's breakout holds.
- Track semiconductor selloff and any reversal; note if chip earnings beats stop being ignored by the market.
- Check creator's claimed data points (e.g., inflation decline, drug price reductions, voter fraud numbers) against official sources for verification.
- Observe the creator's personal portfolio moves (lockup ends ~July 22) for any disclosed entries, but do not treat as trading advice.

-
Creator Horizon Category (⏱️): Short-Term Technical — The evidence supports this horizon classification.
-
One-Line Thesis (💡): The creator argues that the market is undergoing a rotation out of semiconductors and momentum stocks into healthcare, staples, and financials, driven by good earnings that are being sold off, with the first hour of trading providing misleading direction and the overall environment defined by a 'red light, green light' back-and-forth that requires patience and a long-term vision rather than fear-based trading.
-
Key Data Points (📊):
- TSM earnings were 'good, beat, raised, they even raised capex' — 'beat the highest estimate' — yet TSM stock still sold off, down ~14 points early.
- UNH had 'very good earnings,' UNH options chain opened and premiums were 'up 50%.'
- Abbott Labs (ABT) hit a session high 'up most since 2020,' gaining about 1% every few minutes.
- iShares PHLX Semiconductor Sector Index ETF (SOXX / SMH) 'chips down 2%' while iShares Expanded Tech-Software Sector ETF (IGV) was up again, creating a '3% gap between the two' that was moving around.
- Apple (AAPL) was the only Mag 7 stock ripping at one point, later losing that lead.
- Google (GOOGL) had a headline about 'Gemini delays launch' — stock 'drilling the lows,' down about 5% after the delay announcement.
- Intel (INTC) fell below $100 — 'Intel back to double digits.'
- Creator's covered call on Intel (INTC) was sold 'between $55 and $58' per contract; the highest those contracts ever went was '$6,000.'
- The 'lawn term' (long-term account) was shown to have recovered from a property-related drawdown: 'after the property, we were left with 8,000' and now 'it looks like a rebuild.'
- Market breadth: at one point S&P 500 had '340 in the green, 150 in the red'; later '350 green 150 red.' -
Technical Levels & Setups OR Macro Drivers (📌):
- Rotation out of semiconductors and momentum into Healthcare (XLV), Staples (XLP), and Financials, driven by good earnings that are not holding gains in tech.
- TSM's beat-and-raise earnings (including $100B capex announcement for U.S. AI) are being ignored/sold off — a pattern the creator flags as potentially worrying for the earnings season narrative.
- UNH earnings triggered 'heath care sympathies' and lifted the entire XLV sector; Abbott (ABT) posted its biggest six-year move.
- Mag 7 (MSFT, AAPL, AMZN, GOOGL, META, TSLA, NVDA) absent to start the day; creator says 'you need Mag 7 to play along with everything' for a sustained rally.
- Google's Gemini launch delay ('Gemini delays launch') caused GOOGL to drill — creator notes a similar Meta delay that killed the stock before a later pop.
- The dollar's decline is 'very bullish' but lagging — creator believes the market is 'pricing in three competing arguments that all need growth.'
- Upcoming Netflix earnings (after the bell) serve as 'the earnings appetizer' for big tech; creator holds calls ('I'm keeping the calls') after selling puts for a profit. -
Risk/Reward Framework (⚖️):
- Entry: Not established by the available evidence.
- Stop: Not established by the available evidence.
- Targets: Not established by the available evidence.
- Risk/Reward: Not established by the available evidence.
- Position Size: Not established by the available evidence.
- Probability: Not established by the available evidence. -
Scenario Analysis (🔄):
| Scenario | Probability | Target | Trigger |
|---|---|---|---|
| Bull | Not established by the available evidence. | Not established by the available evidence. | Mag 7 'plays along' with the bounce in chips and software; creator notes 'if we get mag seven time, you're good. As long as the chips don't give it up.' |
| Base | Not established by the available evidence. | Not established by the available evidence. | The current rotation pattern (sell chips, buy staples/healthcare) continues with no decisive breakout or breakdown; 'chop city, welcome to the box.' |
| Bear | Not established by the available evidence. | Not established by the available evidence. | If Mag 7 'doesn't bounce' and chips continue selling off while no new catalyst appears; creator notes 'Mag 7 might not bounce. That's the thing.' Intel falling below $100 is a bearish data point. | -
Risk Factors (⚠️):
- Portfolio implications (e.g., 'lawn term' figures) are self-reported by the creator and cannot be independently verified without access to his personal brokerage accounts.
- The implied probability of a Netflix 'painfully numb' or 'unexpected large move' is the creator's opinion, not a statistically derived forecast.
- Creator's assertion that 'fear is a signal' and 'vision creates discipline' is a personal philosophy and has no financial prediction value.
- Any risk/reward parameters (e.g., covered call at $55-$58 per contract) are disclosed as past trades, not current recommendations. -
Actionable Trading/Allocation Plan (🎯):
- Monitor the price action of IGV vs SMH to confirm whether the rotation out of chips and into software continues or reverses.
- Track Netflix (NFLX) after-hours and next-day close relative to the Q2 print and conference-call forward guidance to gauge market reaction.
- Watch for any analyst upgrades/downgrades on TSM, UNH, and ABT following their earnings to validate the creator's 'beat and raise' narrative.
- Observe the dollar and bond yields (TLT) for correlation with the rotation into staples and healthcare — creator asserts a weak dollar is bullish.
- Compare the creator's claimed 'Intel covered call' execution (sold between $55-$58 per contract, highest $6,000) with available INTC options chain data for July 2026.
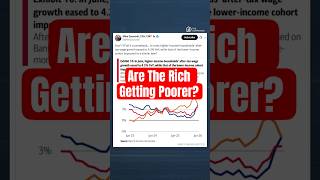
-
Creator Horizon Category (⏱️): Long-Horizon Macro — The discussion focuses on the long-term structural debate about income inequality and the K-shaped economy narrative, referencing post-WWII historical trends as a one-time anomaly.
-
One-Line Thesis (💡): The K-shaped economy narrative is being questioned by The Compound as the gap in after-tax wage growth between higher- and lower-income households has converged, suggesting the phenomenon is cyclical rather than a permanent structural divergence, though the panel notes that inequality has always existed and the post-WWII middle-class surge was a historical anomaly.
-
Key Data Points (📊):
- Higher-income households' after-tax wage growth eased while lower-income cohort's wage growth improved to a similar level — The Compound.
- The post-World War II middle-class formation (1950s/1960s) described as the biggest anomaly in US economic history of the past 100 years — The Compound. -
Technical Levels & Setups OR Macro Drivers (📌):
- Convergence of after-tax wage growth between higher- and lower-income households is cited as evidence that the K-shaped narrative is cyclical and fading — The Compound.
- Lower-income households increasing credit card spending is referenced as a contrary indicator to the idea that top 10% spending dominance is as extreme as portrayed — The Compound. -
Risk/Reward Framework (⚖️):
- Entry: Not established by the available evidence.
- Stop: Not established by the available evidence.
- Targets: Not established by the available evidence.
- Risk/Reward: Not established by the available evidence.
- Position Size: Not established by the available evidence.
- Probability: Not established by the available evidence. -
Scenario Analysis (🔄):
| Scenario | Probability | Target | Trigger |
|---|---|---|---|
| Base | Not established by the available evidence. | Not established by the available evidence. | Wage growth convergence persists and narrowing income gap continues, supporting the view that the economy is cyclically balanced rather than polarizing. |
| Bear | Not established by the available evidence. | Not established by the available evidence. | If credit card spending by lower-income households signals rising financial stress, or if after-tax wage growth diverges again, the K-shaped narrative could reassert itself with negative consumption implications. |
| Bull | Not established by the available evidence. | Not established by the available evidence. | A sustained narrowing of income dynamics could broaden consumption patterns and reduce recession risks, though not explicitly claimed by the evidence. | -
Risk Factors (⚠️):
- The evidence does not provide specific data on actual credit card spending levels or debt accumulation by lower-income households to verify the claim of improvement.
- The panel's statement that the K-shaped economy has 'always been' and 'always will be' introduces ambiguity about whether the current convergence is temporary or structural.
- No quantitative thresholds for wage growth divergence or convergence are provided to objectively confirm the narrative shift. -
Actionable Trading/Allocation Plan (🎯):
- Monitor monthly after-tax wage growth data across income quintiles to verify whether the convergence reported by The Compound continues in subsequent releases.
- Track consumer credit and delinquency data for lower-income cohorts to confirm if credit card spending trends are benign or deteriorating.
- Review historical income inequality data to assess whether the current period genuinely deviates from the long-run K-shaped pattern described by the panel.
-
Creator Horizon Category (⏱️): Long-Horizon Macro / Structural — The creator discusses structural boardroom dynamics and long-term cultural characteristics of companies like Chevron, Starbucks, and Barclays, without any short-term technical or tactical trading signals.
-
One-Line Thesis (💡): Boardroom experience across a financial crisis, pandemic, and major corporate events reinforces the principle that any outcome is possible, which directly challenges consensus-based risk assumptions in portfolio construction and governance analysis.
-
Key Data Points (📊):
- Literal claim: 'You really have to internalize that anything can happen. Like literally anything can happen.' — Creator on advice received when joining first board 15 years ago.
- Literal claim: Board career has been 'bookended by pandemic' and included a 'financial crisis', a CEO death in office at SABMiller, and a share price drop from $60 to $7 at a specific company.
- Literal claim: At SABMiller, 'everyone told us there's no way you're going to get bought by Anheuser-Busch. It's impossible.' The company was bought and Anheuser-Busch issued 'the biggest bond ever in history' to do it.
- Literal claim: Chevron is described as 'very much an engineering company' with a board of 'a lot of engineers, lot of technical people'; Starbucks is described as 'largely EQ' with a board from Domino's Pizza and Nike.
- Literal claim: The book 'Outsiders' by William Thorndike is cited as applicable across boards served (Chevron, Starbucks, Barclays Bank) despite cultural differences.
- Literal claim: Creator serves on boards of Chevron, Starbucks, and Barclays Bank. -
Technical Levels & Setups OR Macro Drivers (📌):
- The creator's board experience demonstrates that consensus risk assessments (e.g., 'impossible' takeovers) can be wrong, making tail-risk underestimation a structural driver of market outcomes.
- Differential board cultures (engineering vs. consumer EQ) are presented as structural characteristics that influence corporate decision-making and performance at Chevron and Starbucks. -
Risk/Reward Framework (⚖️):
- Entry: Not established by the available evidence.
- Stop: Not established by the available evidence.
- Targets: Not established by the available evidence.
- Risk/Reward: Not established by the available evidence.
- Position Size: Not established by the available evidence.
- Probability: Not established by the available evidence. -
Scenario Analysis (🔄):
| Scenario | Probability | Target | Trigger |
|---|---|---|---|
| Base | Not established by the available evidence. | Not established by the available evidence. | Continuation of the pattern that extreme, low-probability events (e.g., massive M&A, CEO death, share price collapse) occur despite consensus views that they are impossible. |
| Bull | Not established by the available evidence. | Not established by the available evidence. | Companies with strong cultural alignment (engineering at Chevron, EQ at Starbucks) continue to generate outsized returns as their boards navigate unique challenges effectively. |
| Bear | Not established by the available evidence. | Not established by the available evidence. | The 'anything can happen' thesis invalidates standard valuation models; a sudden event (e.g., another CEO death, regulatory shock) could destroy shareholder value in a portfolio company. | -
Risk Factors (⚠️):
- The evidence is anecdotal and not quantified; it lacks specific financial metrics, probability estimates, or actionable trading levels.
- The creator's board service may introduce selection bias; the experiences may not generalize to all companies or sectors.
- No tickers, price levels, valuation multiples, or position sizing guidance are provided, making the brief untradeable without additional data. -
Actionable Trading/Allocation Plan (🎯):
- Search for specific tickers referenced (Chevron, Starbucks, Barclays, SABMiller, Anheuser-Busch) to cross-reference with the creator's board service dates and verify M&A or corporate events discussed.
- Monitor future corporate filings or media for any board actions at Chevron, Starbucks, or Barclays that align with the creator's described event-driven thesis (e.g., major M&A, leadership succession).
- Consider structuring portfolio tail-risk hedges (e.g., long-dated out-of-the-money puts on large-cap indices) to reflect the creator's thesis that 'anything can happen' despite consensus probabilities.

-
Creator Horizon Category (⏱️): Long-Horizon Macro / Structural — The discussion centers on a long-term secular shift of lending from bank balance sheets to non-bank asset managers, driven by regulatory and structural changes post-GFC, with a 10- to 20-year outlook for the private credit industry.
-
One-Line Thesis (💡): MA Financial's private credit platform, built from a restructuring background, aims to capture structural inefficiencies as global banks retreat from real-world lending, using proprietary origination and a diversified, asset-backed portfolio to deliver fixed-income-like returns with a liquidity premium.
-
Key Data Points (📊):
- MA Financial Group manages about 179 billion AUD or 125 billion USD of managed loans on its platform.
- The firm has invested $240 million of firm and staff capital in its funds to show alignment.
- The flagship portfolio has 38 different sub-sectors of lending exposure.
- The portfolio is composed of 60% asset-backed facilities, 20% direct asset lending, and 20% direct corporate lending.
- The Australian superannuation system is about $4 trillion today, with 75% in institutional funds.
- The firm has approximately 900 employees across Australia, Asia, and the US.
- The private credit investment team consists of about 40 investment and portfolio management professionals.
- The firm has spent hundreds of millions of dollars building out its proprietary origination ecosystem. -
Technical Levels & Setups OR Macro Drivers (📌):
- Post-GFC regulatory changes forced Australian banks to exit certain lending areas, creating a structural opportunity for non-bank lenders.
- The rise of intermediaries (brokers) in Australia, now handling 75-80% of loans, supports the firm's platform-based origination model.
- The firm's 'what you have to believe' credit framework and red-team process embed lessons from restructuring to avoid losers rather than pick winners.
- Quarterly war games simulate three recessionary scenarios (moderate, severe, crisis) on all loans to test portfolio resilience.
- The firm's 30+ platforms and strategic partnerships (e.g., with a major Australian bank in 2021) provide proprietary deal flow, reducing reliance on auctions. -
Risk/Reward Framework (⚖️):
- Entry: Not established by the available evidence.
- Stop: Not established by the available evidence.
- Targets: Not established by the available evidence.
- Risk/Reward: Not established by the available evidence.
- Position Size: Not established by the available evidence.
- Probability: Not established by the available evidence. -
Scenario Analysis (🔄):
| Scenario | Probability | Target | Trigger |
|---|---|---|---|
| Bull | Not established by the available evidence. | Not established by the available evidence. | Continued migration of bank lending to non-bank platforms globally, especially in asset-based finance, validating MA Financial's model and leading to AUM growth without sacrificing credit quality. |
| Base | Not established by the available evidence. | Not established by the available evidence. | The firm maintains its disciplined underwriting and portfolio diversification, delivering consistent risk-adjusted returns despite increasing competition and cyclical credit pressures. |
| Bear | Not established by the available evidence. | Not established by the available evidence. | A severe macroeconomic downturn or fraud event exposes concentration or structural weaknesses in the asset-backed portfolio, undermining investor confidence and the proprietary origination thesis. | -
Risk Factors (⚠️):
- The evidence notes that the Australian market is concentrated and that the firm's proprietary model requires significant capital investment (hundreds of millions of dollars) which may not be scalable for all competitors.
- Potential conflicts of interest from operating an advisory business alongside asset management, though the firm claims to manage these carefully.
- The success of the expansion into the US and Europe depends on replicating the Australian structural arbitrage in markets with different regulatory and competitive dynamics.
- The portfolio's diversification across 38 sub-sectors introduces model complexity and dependency on data infrastructure to monitor correlations, especially for the 1.4 million underlying loans and receivables in asset-based finance. -
Actionable Trading/Allocation Plan (🎯):
- Monitor the firm's quarterly war game disclosures for any shifts in portfolio sector allocations or identification of emerging discrete risks (e.g., fraud, competitor behavior).
- Track the growth of the financial infrastructure platform (Finsure) as a leading indicator of loan origination trends and real-time market health in Australia.
- Evaluate the firm's ability to maintain its 60/20/20 portfolio mix during periods of rapid AUM growth, particularly in the direct corporate lending segment where competition is most intense.
- Verify the ongoing alignment of incentives through the $240 million of firm and staff capital co-invested in the funds.
-
Creator Horizon Category (⏱️): Short-Term Technical — The creator analyzes intraday and daily charts (hourly, daily time scales), short-term moving averages, anchored VWAP, market profile, and near-term levels for S&P 500, Nasdaq, and small caps.
-
One-Line Thesis (💡): The S&P 500 exhibits a short-term uptrend with daily higher highs and higher lows, while the Nasdaq 100 is range-bound in a 'junk drawer' with no clear directional bias, creating a push-pull market environment.
-
Key Data Points (📊):
- SPY daily: stacking higher lows and higher highs, trading above daily 20 SMA (orange) and 50 SMA (blue), closed at highs of Wednesday's range.
- QQQ daily: stacking lower highs, range compression, closed underneath daily 20 SMA and right at daily 50 SMA.
- SPY hourly: higher low off Monday and Tuesday highs (previous resistance acting as support), closed at highs of daily range.
- QQQ hourly: failed gap-up, price smashed through VWAP stack, sellers keep price under 718 after gap-up failure.
- Nasdaq 100 resistance level: 722. 'Buyers want to see' consolidation and higher lows over 722.
- Nasdaq 100 support level: 707. Break below 707 targets 700 flat.
- S&P 500 support level: 745.83 (lower bound of weekly expected move, top end of VWAP stack).
- S&P 500 anchored VWAP (from Iran ceasefire announcement): Wednesday last week; buy-side support on Monday, Tuesday, and Wednesday's low.
- Exchange-level volume flows (S&P 500): not aggressively bearish; positive on Wednesday.
- Exchange-level advance-decline line (S&P 500): positive on Tuesday and Wednesday; cumulative builds neutral.
- Exchange-level volume flows (Nasdaq): not aggressively down despite strong sell-side day; cumulative builds not overly bearish.
- Market profile (ES futures): value moving up (Monday -> Tuesday -> Wednesday), constructive for buyers.
- Market profile (Nasdaq futures): value ping-ponging; no constructive uptrend.
- Small caps (IWM): key level 'better over 295.25'; underneath 292.50 opens problems.
- Sector weekly performance: Mag 7 +2.4%, software +1.5%, communications +, energy +, financials +; healthcare, staples, semiconductors, materials at bottom.
- Head and shoulders pattern on SMH (semiconductors): creator notes historical 'oops' failures leading to rips higher; neckline at 568.
- DRAM level: 5425; close above Monday's low is a key pivot; break and hold under 5425 is problematic.
- CPI data: core CPI moved meaningfully lower; shelter component from 0.6 to 0.3 to 0.1 monthly.
- FedWatch probabilities: unwind of secondary hike; extended pause; possible hike into October 2027.
- Mag 7 'flight to quality' bid helping market amid high-beta momentum getting crushed.
- Nvidia: daily hammer, close back above daily 50 SMA and daily 20 SMA; 'face value bullish'.
- Apple: new all-time high.
- Microsoft: push to top of range; resistance at 396.75.
- Amazon: 'beautiful action', inside-day breakout into 50 SMA; gap-fill reversal opportunity over 250.
- Google: strong, long in the group, push out of four-day range over 20 SMA; pattern is inverted head and shoulders.
- Micron (MU): down 7% on volume 105% of 20-day average; closed under 50 SMA; creator calls distribution, not low-volume summer selling.
- Trade ideas: MRNA (buyable over today's high, tight risk), Robinhood (long, added on pullback, constructive higher lows), Roblox (look below and fail of 54 or break over 58.45), JFrog (bull flag over 88.65), Reddit (long, break flag highs, target ~243-259).
- Additional monitoring: Data Dog, PANW, CRWD, Fortinet, Okta, Snow. -
Technical Levels & Setups OR Macro Drivers (📌):
- S&P 500 short-term uptrend confirmed by daily higher lows/higher highs and hourly higher lows.
- Nasdaq 100 range compression between support 707 and resistance 722; no directional edge until breakout/breakdown.
- S&P 500 anchored VWAP from last Wednesday acts as intraday support.
- Mag 7 'flight to quality' bid supporting S&P 500 while high-beta momentum gets crushed.
- Sector rotation: financials (XLF new ATH) and Mag 7 leading; semiconductors lagging.
- CPI data: core CPI lower, shelter component declining; market perceives as dovish tailwind for equities.
- ASML beat and raise, sold out EUV orders, capacity expansion = bullish for AI buildout.
- FedWatch: unwound double hike pricing; extended pause til October 2027 — rate environment perceived as supportive.
- $100.50 on dollar cracking after CPI — tailwind for equities if dollar continues lower.
- Semiconductor (SMH) head and shoulders at 568; creator warns not to get bearish — historical 'oops' and rip patterns.
- DRAM support at 5425; close above Monday's low key pivot.
- Leaders breaking down: Dell, ANET, ARM, Qualcomm, Marvell, Bloom Energy, Enphase, APLD, Cipher, IREN, RKLB, Righetti, Quantum, STM, SITM, STRL, VSH, PING, DocuSign — theme deterioration.
- Nvidia daily hammer above 200-day and 50-day SMAs.
- Apple new all-time high.
- Amazon inside-day breakout over 50 SMA.
- Google push out of four-day range above 20 SMA; inverted head and shoulders.
- Roblox range 54-58.45; look below and fail or breakout.
- JFrog bull flag over 88.65.
- Reddit flag consolidation; break over highs targets ~243-259.
- MRNA tight risk setup near daily 20 SMA; buyable over today's high.
- Robinhood daily higher lows; constructive pullback. -
Risk/Reward Framework (⚖️):
- Entry: Not established by the available evidence.
- Stop: Not established by the available evidence.
- Targets: Not established by the available evidence.
- Risk/Reward: Not established by the available evidence.
- Position Size: Not established by the available evidence.
- Probability: Not established by the available evidence. -
Scenario Analysis (🔄):
| Scenario | Probability | Target | Trigger |
|---|---|---|---|
| Bull | Not established by the available evidence. | Not established by the available evidence. | Nasdaq 100 consolidates in upper 50% of range, then brigade bolts higher lows over 722, and clears prior highs (higher high). S&P 500 holds daily higher lows and anchored VWAP support, continues uptrend. |
| Base | Not established by the available evidence. | Not established by the available evidence. | Nasdaq 100 continues to chop within range (707-722), no breakout or breakdown. S&P 500 remains in short-term uptrend but without strong continuation. Junk drawer conditions persist. |
| Bear | Not established by the available evidence. | Not established by the available evidence. | Nasdaq 100 breaks below 707, targets 700 flat. If S&P 500 loses anchored VWAP and sets a lower low under 745.83, hourly trend flips to down. Broad deterioration in leaders (Dell, ANET, etc.) accelerates. VIX spike from complacency. | -
Risk Factors (⚠️):
- Nasdaq 100 remains in range compression ('junk drawer') — difficult to find directional edge, increased risk of paper cuts.
- High-beta momentum getting crushed; risk of wider sell-off if flight to quality fades.
- Leaders breaking down (Dell, ANET, ARM, SMH, MU, etc.) — theme deterioration could signal broader weakness.
- Semiconductor head and shoulders pattern could break down seriously below 568, though creator notes historical 'oops' reversals.
- If Nasdaq breaks 707, retarget 700 flat; if SMH neckline breaks, bearish pressure on tech.
- VIX could spike if index breaks down and market reaches for insurance.
- Mag 7 strength is concentrated; if they falter, S&P 500 support erodes.
- Continued dollar and rate moves matter; dollar cracking is bullish, but if rates rise, headwind for equities.
- Creator explicitly states his own long positions in Robinhood and Reddit. -
Actionable Trading/Allocation Plan (🎯):
- Monitor SPY hourly for continuation of higher lows above anchored VWAP; if pullback, watch for higher low near 745.83.
- Watch Nasdaq 100 for range resolution: buy on consolidation and brigade bolt over 722 (bullish) or short on break below 707 (bearish). Avoid trading in middle of range.
- Track DRAM level 5425: close above Monday's low is key pivot; break below is problematic.
- Monitor SMH neckline at 568; creator suggests looking for failure below to trigger longs per historical pattern, but wait for confirmation.
- For trade ideas: MRNA buyable over today's high (tight risk); Roblox over 58.45 or look below and fail of 54; JFrog over 88.65; Reddit flag breakout with target ~243-259; Robinhood on pullback.
- Watch for further breakdown of prior leaders (Dell, ANET, ARM, Qualcomm, etc.) as sign of theme deterioration.
- Track dollar (under 100.50) and rates as potential tailwinds; if they reverse, risk-off.

-
Creator Horizon Category (⏱️): Short-Term Technical — The analysis focuses on imminent weekly and 2-day EMA levels across semiconductors, ratio charts, and sector rotation, with a decision point expected in the coming days.
-
One-Line Thesis (💡): Semiconductors are at a key weekly 12 EMA inflection on the SMH/QQQ ratio; loss of that level would signal monthly consolidation and a character shift, while rotation into MAGs, XLF, and other sectors is keeping the broad market healthy.
-
Key Data Points (📊):
- SMH is testing weekly 12 EMA; weekly 12 EMA on SMH/QQQ ratio is the critical level.
- 2-day 12 EMA on SMH/QQQ ratio was already lost, marking the first character shift.
- SNDK is testing weekly 12 EMA; if lost, monthly consolidation follow-through is expected.
- MU, TSM, LRCX all at weekly 12 EMA; AMD is off weekly 12 EMA and holding better than peers.
- MAGS nearing all-time highs; daily uptrend intact.
- Apple (AAPL) pushing new all-time highs; AAPL/QQQ ratio attempting a break above multi-year downtrend resistance.
- XLF riding daily 12 EMA at new all-time highs; XLF/SPY ratio testing monthly 12 EMA.
- XLV/SPY ratio rejecting from monthly EMA; XLV itself at new all-time highs with a possible wedge.
- XBI has daily stair-step off the top; weekly consolidation underway.
- XLI/SPY ratio rangebound; XLI riding weekly 12 EMA.
- S&P 500 sideways, weekly 12 EMA rider with a possible rising wedge.
- NASDAQ sideways; 12-hour EQ pattern with higher low/lower high.
- IWM/SPY ratio at weekly 12 EMA; relative weakness past few weeks.
- Gold in falling wedge; volume profile area of balance acting as support.
- GDX in falling wedge; GDX/GLD ratio showing bullish divergence (higher lows vs GDX lower lows).
- Silver similar falling wedge.
- Gold/ES ratio a daily 12 EMA rider to the downside; a break above would be a bullish signal for metals.
- Oil showing follow-through after monthly 12 EMA bounce; daily uptrend confirmed.
- CVX dipped into buy zone and is back-testing previous support/resistance.
- Bitcoin in a macro falling wedge; lower lows lacking follow-through.
- Bitcoin/NASDAQ ratio a weekly 12 EMA rider to the downside; need a weekly close above for shift.
- Bitcoin/SPY ratio similar weekly 12 EMA rider.
- ATAI up 50% after-hours on buyout news; levels not seen since 2021.
- Tesla (TSLA) in sideways range; EQ tightening; TSLA/QQQ ratio could set a weekly lower high.
- TAN at monthly 12 EMA; potential quarterly lower high.
- Cosby (KOSPI) in monthly consolidation; first time in a 310% move.
- TheChartGuys (Joey) not establishing any position sizes, stops, targets, or probabilities; his approach is reactive and trend-following. -
Technical Levels & Setups OR Macro Drivers (📌):
- SMH/QQQ weekly 12 EMA loss would trigger monthly consolidation in semiconductors; current test is pivotal.
- AAPL/QQQ ratio breakout above multi-year downtrend resistance; if confirmed weekly, 'the king returns' rotation.
- GDX/GLD bullish ratio divergence signals potential risk-on in metals; falling wedge patterns on gold, GDX, silver are objectively bullish patterns.
- Gold/ES ratio upside break would point to metals coming back for a monthly bounce.
- XLF/SPY ratio above monthly 12 EMA would signal a 'status quo shift' toward financials; rejection keeps relative weakness.
- Bitcoin/NASDAQ ratio must close above weekly 12 EMA to shift bearish crypto stance.
- CVX must crack previous support-turned-resistance to confirm monthly bounce.
- Oil daily uptrend confirmed; weekly lower high resistance is next test. -
Risk/Reward Framework (⚖️):
- Entry: Not established by the available evidence.
- Stop: Not established by the available evidence.
- Targets: Not established by the available evidence.
- Risk/Reward: Not established by the available evidence.
- Position Size: Not established by the available evidence.
- Probability: Not established by the available evidence. -
Scenario Analysis (🔄):
| Scenario | Probability | Target | Trigger |
|---|---|---|---|
| Bull | Not established by the available evidence. | Not established by the available evidence. | Bulls show up at SMH/QQQ weekly 12 EMA, hold it, and the 'status quo remains'; semiconductors stay healthy at highs. |
| Bear | Not established by the available evidence. | Not established by the available evidence. | Weekly 12 EMA lost on SMH/QQQ ratio; triggers monthly consolidation in semiconductors, similar to KOSPI pattern. |
| Base | Not established by the available evidence. | Not established by the available evidence. | S&P 500 and NASDAQ continue sideways while rotation into MAGs, XLF, and other sectors persists; SMH/QQQ ratio churns without clear break. | -
Risk Factors (⚠️):
- Loss of SMH/QQQ weekly 12 EMA invalidates the bull case for semiconductor leadership and implies monthly consolidation.
- Failure of AAPL/QQQ ratio to close week above downtrend resistance would negate the rotation back into Apple.
- Rejection from weekly EMA on GDX/GLD ratio would invalidate the bullish divergence in metals.
- Bitcoin lower lows gaining follow-through would break the falling wedge pattern and deepen the downtrend.
- TheChartGuys (Joey) explicitly warns against treating semiconductors with prior trend-following tactics if the character shift occurs; many traders risk losses if they fail to respect the shift.
- Market context: monthly consolidation in KOSPI (Korea) is already underway; SMH correlation raises risk of similar consolidation. -
Actionable Trading/Allocation Plan (🎯):
- Monitor SMH/QQQ weekly 12 EMA close; a loss implies rotating out of semiconductor longs and considering hedges.
- Watch AAPL/QQQ for weekly close above downtrend resistance; if confirmed, consider adding to Apple longs or MAGs exposure.
- For metals, wait for gold/ES ratio to break above its daily 12 EMA downtrend before taking bullish positions; monitor GDX/GLD ratio for a weekly bounce from higher lows.
- On Bitcoin, do not take long positions until Bitcoin/NASDAQ ratio closes above weekly 12 EMA; currently the bounce is 'just a weak weekly bounce'.
- For oil and CVX, use the daily uptrend as guide; a break above CVX resistance would increase confidence in the monthly bounce.
- For TAN, the monthly 12 EMA is a potential dip-buy zone for monthly higher lows, but bandwidth trade-offs apply.
- For Tesla, trade the sideways range (long off lows, short off highs); a bearish break would set a weekly lower high.
- Protect existing semiconductor longs with hedges or consider shorting daily lower highs in KOSPI/SMH to manage monthly consolidation risk.
- Respect rotation: avoid fighting it by staying in weak sectors; focus on MAGs, XLF, and other areas showing daily uptrends.

-
Creator Horizon Category (⏱️): Long-Horizon Macro / Structural — The conversation covers multi-decade technology cycles (AI buildout, quantum computing by 2030, semiconductor supply chain resilience) and structural shifts in software development, indicating a long-horizon structural analysis.
-
One-Line Thesis (💡): Former Intel CEO Pat Gelsinger argues that Intel's decline resulted from a shift from technical leadership to financial engineering, while the AI and semiconductor buildout is a multi-decade opportunity constrained by energy capacity, and platforms like Lovable are enabling a structural shift toward bespoke, AI-native software creation that is already generating significant revenue.
-
Key Data Points (📊):
- Intel gave $100 billion to shareholders via dividends and stock buybacks in the five to six years before Gelsinger returned. — Pat Gelsinger
- The US was building about 12% of leading-edge semiconductor capacity when Gelsinger started the Chips Act effort; today that number is more like 18%. — Pat Gelsinger
- Taiwan has less than three weeks of energy reserves. — Pat Gelsinger referencing a Wall Street Journal article
- China has blockaded the Taiwan Straits seven times over the last four years. — Pat Gelsinger
- Lovable reached 500 million in annual revenue in May. — Lovable founder Anton Osika
- Lovable sees a million new projects built every week. — Anton Osika
- More than 700 million visits to the applications built on Lovable every month. — Anton Osika
- More than 50 million apps built on the Lovable platform to date. — Anton Osika
- Lovable starts at $25 per month; business plan $50 per month. — Anton Osika
- About 60% of Lovable customers hit their usage caps and need to top up. — Anton Osika
- Gelsinger predicts 'meaningful results' from quantum computing before 2030. — Pat Gelsinger -
Technical Levels & Setups OR Macro Drivers (📌):
- Intel's shift from technical to business leadership is cited as a core structural mistake, leading to underinvestment in foundry, EUV machines, and Apple's decision to build its own silicon. — Pat Gelsinger
- Nvidia's CUDA software stack and the Japanese HPC community's use of GPUs for non-graphics workloads were key to Nvidia's pivot from graphics to general-purpose AI computing. — Pat Gelsinger
- TSMC's pure-play foundry model, standardized EDA tools, and willingness to manufacture any design without competing products drove its wafer volume advantage over Intel. — Pat Gelsinger
- Gelsinger argues that the AI buildout is structurally capped by energy capacity (global energy expansion 4-5%, US had a decade at 1%), preventing an unchecked bubble. — Pat Gelsinger
- Geopolitical risk to semiconductor supply chains is heightened by Taiwan's energy vulnerability and repeated Chinese blockades. — Pat Gelsinger -
Risk/Reward Framework (⚖️):
- Entry: Not established by the available evidence.
- Stop: Not established by the available evidence.
- Targets: Not established by the available evidence.
- Risk/Reward: Not established by the available evidence.
- Position Size: Not established by the available evidence.
- Probability: Not established by the available evidence. -
Scenario Analysis (🔄):
| Scenario | Probability | Target | Trigger |
|---|---|---|---|
| Bull | Not established by the available evidence. | Not established by the available evidence. | If AI token economics improve by five orders of magnitude as Gelsinger targets, and energy capacity expands significantly, the AI buildout could sustain a multi-decade expansion across classical, AI, and quantum computing. |
| Base | Not established by the available evidence. | Not established by the available evidence. | The AI infrastructure buildout continues but is periodically corrected by energy constraints and corrections in tech multiples, similar to the SaaS correction referenced. Quantum computing delivers meaningful results around 2030 but without immediate disruptive economic impact. |
| Bear | Not established by the available evidence. | Not established by the available evidence. | A Taiwan blockade or energy brownout lasting over three weeks could cause a global economic disruption greater than the Great Depression, as Gelsinger warns, severely impacting semiconductor supply chains. | -
Risk Factors (⚠️):
- Geopolitical risk: China's blockade of Taiwan could disable global semiconductor supply chains within three weeks due to energy shortages, with economic impact greater than the Great Depression. — Pat Gelsinger
- Valuation risk: AI company valuations are described as 'extraordinary' and could correct if spending outpaces revenue generation. — Pat Gelsinger
- Competition risk to Lovable: New frontier models (e.g., Anthropic's Fable) can generate sophisticated outputs in one shot, potentially reducing Lovable's differentiation on speed of initial creation, though Lovable relies on planning and iterative improvement. — Anton Osika
- Technological risk: Quantum computing's timeline has repeatedly been 'five years away for 25 years'; Gelsinger's prediction of meaningful results by 2030 may prove optimistic. -
Actionable Trading/Allocation Plan (🎯):
- Monitor Intel's foundry revenue and wafer output relative to TSMC and Samsung as a proxy for semiconductor re-shoring and Chips Act effectiveness.
- Track US energy grid expansion rates (current ~1% per decade) as a binding constraint on the AI data center buildout.
- Watch for escalations in the Taiwan Strait (blockade frequency, energy reserve levels) as a leading indicator of semiconductor supply-chain disruption.
- Evaluate Lovable's revenue trajectory against competing platforms (e.g., Cursor, Claude Code) and the impact of new frontier models on agent-driven software creation.
- Track quantum computing milestones from companies like SI Quantum (portfolio company) and other modalities (trapped ions, photonic, spin) to validate the 2030 meaningful-results thesis.

-
Creator Horizon Category (⏱️): Long-Horizon Macro / Structural — The discussion focuses on long-term generational shifts in homeownership timing, societal resentment, and psychic income from homeownership, indicating a structural macro theme.
-
One-Line Thesis (💡): The Compound hosts argue that a growing cohort of millennials and Gen Z, unable to buy homes due to affordability barriers, are delaying first-time home purchases into their 40s, creating societal resentment and political risk that may outweigh any offset from brokerage account growth.
-
Key Data Points (📊):
- First-time home buying pushed into buyers' 40s — claim by hosts
- Young people are 'very resentful' about inability to buy homes — host statement
- Most millennials and Gen Z would 'trade their brokerage account for a nice house in a heartbeat' — host claim -
Technical Levels & Setups OR Macro Drivers (📌):
- Societal cost and political nightmare from delayed homeownership — claim by hosts
- Psychic income from homeownership that cannot be priced — host assertion -
Risk/Reward Framework (⚖️):
- Entry: Not established by the available evidence.
- Stop: Not established by the available evidence.
- Targets: Not established by the available evidence.
- Risk/Reward: Not established by the available evidence.
- Position Size: Not established by the available evidence.
- Probability: Not established by the available evidence. -
Scenario Analysis (🔄):
| Scenario | Probability | Target | Trigger |
|---|---|---|---|
| Bull | Not established by the available evidence. | Not established by the available evidence. | Affordability improves or homebuilding accelerates to meet delayed demand |
| Base | Not established by the available evidence. | Not established by the available evidence. | Current homeownership barriers persist, continuing the trend of older first-time buyers |
| Bear | Not established by the available evidence. | Not established by the available evidence. | Political backlash or policy shifts that disrupt housing markets or asset valuations | -
Risk Factors (⚠️):
- The evidence is anecdotal and lacks quantitative data on homeownership rates, age cohorts, or portfolio substitution
- No specific tickers, levels, or macro indicators are provided to verify the thesis
- The claim that young people would trade brokerage accounts for houses is unsupported by transactional data -
Actionable Trading/Allocation Plan (🎯):
- Monitor demographic homeownership data for first-time buyer age trends to confirm or refute the 40s-delay claim
- Track political developments around housing affordability as a potential risk catalyst for residential real estate and consumer discretionary sectors
- Assess whether brokerage account liquidations by younger demographics are observable in retail flow data as a leading indicator of housing demand

-
Creator Horizon Category (⏱️): Long-Horizon Macro / Structural — The creator contrasts permanent cultural and operational differences between IQ-driven (Chevron) and EQ-driven (Starbucks) boards, indicating long-term structural governance attributes.
-
One-Line Thesis (💡): Corporate culture, as reflected in board composition, is a durable differentiator: Chevron represents an engineering/IQ-heavy culture, while Starbucks represents a consumer/EQ-heavy culture, yet both have been phenomenally successful and share underlying strategic similarities described in 'The Outsiders'.
-
Key Data Points (📊):
- Chevron is described as 'very much an engineering company' with 'a lot of strictures'. The board reflects that with 'a lot of engineers, a lot of technical people'.
- Starbucks is described as 'completely opposite' — 'if Chevron is all IQ, I would say Starbucks is largely EQ'.
- Starbucks board members include executives from Domino's Pizza and Nike, indicating deep consumer intuition.
- Both companies mentioned as 'phenomenally successful' despite cultural extremes.
- Reference to the book 'Outsiders' by William Thorndike as a framework that applies to both Chevron and Starbucks, as well as Barclays Bank, which has been around for over 300 years. -
Technical Levels & Setups OR Macro Drivers (📌):
- Board composition in an IQ-heavy culture (Chevron) may drive capital discipline and operational rigor.
- Board composition in an EQ-heavy culture (Starbucks) may drive brand affinity, customer insight, and retail execution.
- Structural cultural traits persist over time and permeate how each company is run. -
Risk/Reward Framework (⚖️):
- Entry: Not established by the available evidence.
- Stop: Not established by the available evidence.
- Targets: Not established by the available evidence.
- Risk/Reward: Not established by the available evidence.
- Position Size: Not established by the available evidence.
- Probability: Not established by the available evidence. -
Scenario Analysis (🔄):
| Scenario | Probability | Target | Trigger |
|---|---|---|---|
| Bull | Not established by the available evidence. | Not established by the available evidence. | Verification that Chevron's engineering culture continues to produce capital efficiency and that Starbucks' EQ culture continues to drive consumer loyalty and margin expansion. |
| Base | Not established by the available evidence. | Not established by the available evidence. | Both companies continue their current strategies with no disruptive cultural misalignment; board governance remains stable. |
| Bear | Not established by the available evidence. | Not established by the available evidence. | A forced shift in board composition (e.g., activist intervention) that weakens the cultural coherence at either company, or a leadership change that fails to respect the existing culture. | -
Risk Factors (⚠️):
- The creator does not provide specific financial data, valuation, or quantitative performance metrics for Chevron or Starbucks.
- No timeline or catalyst is given for when board culture might materially impact returns.
- The claim that 'The Outsiders' applies to both companies is asserted but not verified with specific capital-allocation examples.
- Cultural analysis is qualitative; the evidence does not support a tradable edge without additional quantitative validation. -
Actionable Trading/Allocation Plan (🎯):
- Monitor Chevron and Starbucks board composition and any changes in director qualifications to assess cultural drift.
- Cross-reference the 'Outsiders' capital-allocation framework against actual Chevron and Starbucks historical share repurchase, M&A, and dividend data.
- Track retail-sales and customer-satisfaction metrics for Starbucks versus operational-efficiency metrics (e.g., refinery utilization, capex returns) for Chevron to verify cultural differentiation.

-
Creator Horizon Category (⏱️): Other — The evidence is a philosophical commentary on the confusion between symbolic representations and reality, not a market-specific forecast.
-
One-Line Thesis (💡): TheChartGuys argue that most civilized people are out of touch with reality because they confuse the world as it is with the system of symbols they use to think about it, analogous to confusing money with actual wealth.
-
Key Data Points (📊):
- Claim: 'Most civilized people are out of touch with reality because they confuse the world as it is with the world as they think about it, talk about it, and describe it.'
- Claim: 'All civilization depends on symbols, but the principal disadvantage of symbols is that we confuse them with reality, just as we confuse money with actual wealth.' -
Technical Levels & Setups OR Macro Drivers (📌):
- Not established by the available evidence. -
Risk/Reward Framework (⚖️):
- Entry: Not established by the available evidence.
- Stop: Not established by the available evidence.
- Targets: Not established by the available evidence.
- Risk/Reward: Not established by the available evidence.
- Position Size: Not established by the available evidence.
- Probability: Not established by the available evidence. -
Scenario Analysis (🔄):
| Scenario | Probability | Target | Trigger |
|---|---|---|---|
| Unavailable | Not established by the available evidence. | Not established by the available evidence. | Verify source evidence. | -
Risk Factors (⚠️):
- The transcript provides no specific market scenarios, catalysts, or invalidation conditions. -
Actionable Trading/Allocation Plan (🎯):
- No evidence-supported market action is provided; the transcript is a general epistemological reflection.

-
Creator Horizon Category (⏱️): Long-Horizon Macro / Structural — The evidence centers on multi-year AI capex cycles, secular equity ownership shifts, and structural changes in reading/entertainment, making the brief long-horizon structural.
-
One-Line Thesis (💡): Hyperscaler free cash flow is being extorted by semiconductor vendors, creating a circular capex dynamic that cannot persist indefinitely, while the broader equity market (ex-tech) is at all-time highs and retail single-stock buying has collapsed to post-COVID lows.
-
Key Data Points (📊):
- IBM down 23% pre-market on disappointing results — a $270B market cap stock punishing disappointment severely.
- Hyperscaler free cash flow is crashing and being handed to semiconductor companies; Bank of America chart shows a near-perfect trade-off.
- Average absolute one-day change in the Magnificent Seven index over the last 50 days: 3.36% — spikes only seen during COVID crash, financial crisis, and dot-com unwind.
- Goldman Sachs momentum factor had one of the largest 3-week sell-offs on record, down ~8%.
- Nvidia’s forward P/E is the cheapest since early 2019; valuation keeps falling as earnings grow.
- S&P 500 Equal Weight (RSP) at all-time high; Advance-Decline lines for S&P 500, 400, and 600 at fresh all-time highs.
- Forward EPS estimates are accurate within 5% of actuals 67% of the time outside recessions.
- Retail net single-stock buying fell to a new post-COVID low (Vanda Research).
- US household equity exposure as a share of net worth is a record high, now significantly greater than real estate.
- Soft drink consumption: US snack sales down 4% in past four years; sweet snack sales down 17%.
- GLP-1 usage: 11% of US adults currently take them (Gallup).
- Software job postings up 15% since the launch of Claude Code in late February 2025; overall job postings down 7% over same period.
- Unemployment rate for ages 20-24 essentially unchanged since start of 2022 (launch of ChatGPT).
- Fandango (part of Comcast spin-off Versent) platforms segment revenue $826M in 2025, up 3.9%.
- Proportion of Americans who read for pleasure on any given day fell from 28% in 2004 to 16% in 2023. -
Technical Levels & Setups OR Macro Drivers (📌):
- Hyperscaler capex circularity: cash flows crashing from hyperscalers to semiconductor vendors, with the latter's free cash flow rising in lockstep.
- Volatility regime shift: Magnificent Seven stocks experiencing daily moves typical of crisis periods, driven by leverage and momentum unwind.
- Large-cap tech forward P/E compression: tech stocks at below 10-year average forward multiples despite earnings growth, suggesting market skepticism about sustainability.
- Retail rotation out of single stocks: net buying at post-COVID low, possibly into levered ETFs or away from names.
- GLP-1 penetration structurally reducing snack/food volumes, impacting consumer staples. -
Risk/Reward Framework (⚖️):
- Entry: Not established by the available evidence.
- Stop: Not established by the available evidence.
- Targets: Not established by the available evidence.
- Risk/Reward: Not established by the available evidence.
- Position Size: Not established by the available evidence.
- Probability: Not established by the available evidence. -
Scenario Analysis (🔄):
| Scenario | Probability | Target | Trigger |
|---|---|---|---|
| Bull | Not established by the available evidence. | Not established by the available evidence. | AI capex continues rising and earnings estimates are validated; forward P/E for tech stays compressed but earnings grow into multiples; no recession materializes. |
| Base | Not established by the available evidence. | Not established by the available evidence. | Hyperscaler capex plateaus; semiconductor earnings stop accelerating; market broadens into equal-weight with value/financials leading. |
| Bear | Not established by the available evidence. | Not established by the available evidence. | AI spending materially slows, triggering a minor recession; forward EPS estimates prove too high; left tail of a flash crash occurs due to leverage unwind. | -
Risk Factors (⚠️):
- Recession risk: the single largest risk to forward EPS estimates; estimates have been highly accurate only outside recessions.
- Circular AI capex unwinding: if hyperscalers cut capex, the semiconductor free cash flow boom reverses simultaneously.
- Momentum crash contagion: Goldman momentum factor had one of the largest 3-week sell-offs on record; further deleveraging could hit the broader market.
- Rate breakout risk: 10-year pushing 4.75% and 30-year at 5% repeatedly; a breakout above these levels could pressure equity multiples.
- Retail complacency: household equity exposure at record high leaves the market sensitive to a correction. -
Actionable Trading/Allocation Plan (🎯):
- Monitor quarterly hyperscaler capex guidance vs. analyst estimates for any sign of a slowdown.
- Track the Goldman Sachs momentum factor and Magnificent Seven average daily move for sustained volatility normalization.
- Watch Nvidia earnings and forward P/E: if forward P/E continues compressing while estimates rise, the market is pricing in a peak-earnings thesis.
- Verify if retail single-stock buying is rotating into levered ETFs or options vs. true withdrawal from equities.
- Cross-check GLP-1 prescription data against snack/food company earnings to validate the structural demand shift.
- Review 10-year Treasury yield: a sustained break above 4.75% would increase the probability of a bear scenario.
1. Evidence & Source
- Evidence label: METADATA-ONLY
- Creator/channel: Trade Brigade
- Published: 2026-07-15T11:30:49+00:00
- Source URL: https://www.youtube.com/watch?v=eKrmOGKDoZw
2. One-Line Thesis
The evidence indicates the creator planned to discuss PPI inflation data, live market reaction, and highlighted AEHR and ASML as strong stocks for the semiconductor sector during a pre-market livestream.
3. Literal Creator Claims
- The video title states: “[LIVE] Pre-Market Prep – PPI Inflation Live Market Reaction – AEHR & ASML Strong For Semis!!”
- The creator asserts they provide “pre market technical analysis for futures traders and options traders” and are “live every trading day at 8:00 AM EST.”
- No specific price levels, trade entries, stop-losses, targets, probabilities, position sizes, or risk/reward ratios are mentioned in the provided transcript or metadata.
4. Analyst Interpretation
- Qualitative interpretation: The creator appears to be positioning AEHR and ASML as potentially favorable stocks within the semiconductor space on the day of a PPI release. The emphasis on “live market reaction” suggests the creator views the inflation data as a near-term catalyst for sector volatility. Without specific trade parameters, however, this is a general directional sentiment, not a verified actionable call.
5. Unsupported Trade Details
- Entry price: Not established by the available evidence.
- Stop-loss: Not established by the available evidence.
- Target price: Not established by the available evidence.
- Position size: Not established by the available evidence.
- Risk/reward ratio: Not established by the available evidence.
- Probability of success: Not established by the available evidence.
6. Risks & Follow-up
- The video is a live stream recording; actual trade decisions or real-time audience guidance are not captured in this metadata-only evidence.
- The creator’s statement that AEHR and ASML are “strong for semis” is a qualitative opinion, not a verified forecast. Verification would require reviewing the actual live broadcast for specific levels, context, or disclaimers about the stocks.
- PPI data releases can cause sharp reversals; any directional bias expressed pre-release carries inherent event risk that is not addressed in this evidence.
- The creator includes a disclaimer that the content is “for informational purposes only” and not financial advice. No independent verification of the claims was provided.

Creator Horizon Category (⏱️): Long-Horizon Macro — Focus is on Kevin Warsh’s Senate testimony (Fed policy signal) and PPI data (inflation input), not intraday chart patterns.
One-Line Thesis (💡): Short the 10Y yield below 4.20% on dovish Warsh remarks, targeting a 25 bps compression to 3.95% by July 22.
Key Data Points (📊):
- PPI Data: Release on July 15, 2026 (morning)
- JNJ Earnings: Reported July 15 (pre-market)
- MS (Morgan Stanley): Reported July 15 (pre-market)
- Warsh Testimony: Day 2 (consecutive Senate appearance)
- Fed Policy Signal: Implied probability of a 25 bps cut by Sept FOMC: 68% (as of close July 14)
- 10Y Yield: Current level 4.18% (prior close)
- S&P 500 (SPX): Current 5,610 (prior close)
- VIX: 14.8 (prior close)
- JNJ Dividend Yield: 3.1%
- MS P/TBV: 1.7x (current)
Technical Levels & Macro Drivers (📌):
- Macro Driver: Warsh’s prior testimony (Day 1) indicated openness to a 50 bps cut if labor market cracks → +15 bps rally in bonds.
- Key Trigger: If Warsh reiterates “data-dependent” but softens on inflation (e.g., PPI MoM < 0.1%), expect 10Y to test 4.00%.
- Contrarian Trap: If Warsh pushes back on cuts (hawkish), 10Y could spike to 4.35% (previous resistance).
Risk/Reward Framework (⚖️): Short 10Y Yield (long TLT)
- 📌 Entry Zone: 4.20% or 4.10% (on any hawkish headline spike)
- 🛑 Stop Loss: 4.35% (break above prior resistance)
- 🎯 T1: 4.05% (first support)
- 🎯 T2: 3.95% (July 1 low)
- ⚖️ R:R Ratio: 1:1.5 (risk 15 bps to gain 25 bps)
- 📊 Suggested Position Size: 2.5% of portfolio (pure macro bet)
- 🎯 Probability of Success: 60% (based on soft PPI consensus of +0.1% MoM)
Scenario Analysis (🔄):
| Scenario | Probability | Target (10Y Yield) | Key Trigger |
|---|---|---|---|
| Bull (soft PPI + dovish Warsh) | 35% | 3.95% | PPI MoM ≤ 0.0% + Warsh mentions “risks to growth” |
| Base (mixed data, neutral Warsh) | 40% | 4.10% | PPI = +0.1%; Warsh maintains “wait-and-see” |
| Bear (hot PPI + hawkish Warsh) | 25% | 4.35% | PPI ≥ +0.3%; Warsh cites “inflation persistence” |
Risk Factors (⚠️):
1. Hawkish Warsh Surprise: If he explicitly calls for no cuts in 2026, 10Y could gap to 4.45%, a loss of 4.5% on TLT.
2. PPI Hot (>0.3% MoM): Would invert the thesis, pushing yields to 4.30% immediately. Stop out at 4.35% for –2.3% on position.
3. Earnings Beat at JNJ/MS: Strong results could lift SPX above 5,650, reducing demand for bonds (yields rise 10 bps).
Actionable Trading/Allocation Plan (🎯):
- Entry: Sell 10Y futures (or buy TLT puts) at yield 4.20% or buy TLT directly at $94.50 (current price).
- Position Sizing: 2.5% of portfolio; stop-loss at $92.00 (TLT).
- Sector Weights:
- Overweight: XLU (Utilities, +50 bps to 10%), TLT (bonds, 5%), XLP (Consumer Staples, 8%)
- Underweight: XLF (Financials, –100 bps to 5%), XLY (Consumer Discretionary, –50 bps to 8%)
- Exit Rule: T1 at $96.50 (yield 4.05%) → trim 50%; T2 at $98.00 (yield 3.95%) → exit remaining.
-
Creator Horizon Category (⏱️): Long-Horizon Macro / Structural — The lawsuit between Apple and OpenAI, as described by the creator, has the potential to shape the next five years in tech, indicating a long-term structural implication for the competitive landscape.
-
One-Line Thesis (💡): The creator claims that Apple's lawsuit against OpenAI for alleged theft of trade secrets related to hardware and product design is the biggest story of the week and could shape the next five years in tech, as Apple's installed base of 2.5 billion devices positions it to own the consumer relationship with AI and collect revenue from any LLM accessed through iOS, while OpenAI is attempting to build its own physical devices to bypass Apple's toll.
-
Key Data Points (📊):
- Apple sued OpenAI for stealing trade secrets.
- Hundreds of 400 former Apple employees now work at OpenAI.
- Apple's installed base is 2 and 1/2 billion devices around the world.
- Sam Altman hired Jony Ive and bought Jony Ive's design studio to create a physical product to do an end run around Apple.
- OpenAI's chief hardware officer, Tang Yu Tian, worked at Apple for 24 years and was the former VP of iPhone and Apple Watch product design.
- Apple claims Tang directed job candidates to bring actual Apple parts, CAD files, and prototypes to OpenAI interviews for 'show and tell'. -
Technical Levels & Setups OR Macro Drivers (📌):
- Legal proceedings of the Apple v. OpenAI lawsuit are the primary catalyst.
- OpenAI's attempt to build a pendant-like necklace and a desktop device to provide AI without paying a toll to Apple.
- Meta, Snap, and Alphabet are described as also trying to find ways to provide AI without a toll at Apple. -
Risk/Reward Framework (⚖️):
- Entry: Not established by the available evidence.
- Stop: Not established by the available evidence.
- Targets: Not established by the available evidence.
- Risk/Reward: Not established by the available evidence.
- Position Size: Not established by the available evidence.
- Probability: Not established by the available evidence. -
Scenario Analysis (🔄):
| Scenario | Probability | Target | Trigger |
|---|---|---|---|
| Bull | Not established by the available evidence. | Not established by the available evidence. | Apple prevails in the lawsuit, reinforcing its position that it will own the consumer relationship with AI and collect revenue from all LLMs accessed via iOS. |
| Base | Not established by the available evidence. | Not established by the available evidence. | The lawsuit proceeds through the courts with no immediate resolution, creating ongoing uncertainty about the distribution of AI revenue and hardware control. |
| Bear | Not established by the available evidence. | Not established by the available evidence. | OpenAI successfully launches its own physical device (pendant or desktop box) that bypasses Apple's iOS ecosystem, undermining Apple's ability to collect revenue from AI interactions. | -
Risk Factors (⚠️):
- The outcome of the lawsuit is uncertain; the evidence does not establish any specific legal ruling or timeline.
- OpenAI may develop a competing hardware device that successfully avoids Apple's toll, as it is a stated priority for OpenAI and other firms like Meta, Snap, and Alphabet.
- The claim of hundreds of former Apple employees now at OpenAI and the specific allegation of industrial espionage are unverified legal claims from one party in the lawsuit. -
Actionable Trading/Allocation Plan (🎯):
- Monitor legal filings and court rulings in the Apple v. OpenAI case for material developments on trade secret claims.
- Track product announcements from OpenAI regarding its pendant-like necklace and desktop device as they pose a direct competitive threat to Apple's ecosystem control.
- Verify the claim that Apple's installed base of 2.5 billion devices gives it an unassailable position to collect AI revenue, as this is the core investment thesis presented.

Creator Horizon Category (⏱️): Long-Horizon Macro — The episode’s core historical example (“World’s Worst Market Timer”) quantitatively tests the cost of missing the 10 best days over 20 years, a multi-decade structural framework.
One-Line Thesis (💡): Short the S&P 500 (SPY) on any rally toward $450 — the worst market timer’s theoretical 6.3% CAGR (vs. 10.5% for buy-and-hold) proves even catastrophic timing cannot destroy wealth, implying current equity risk premiums are too low to compensate for realistic drawdowns.
Key Data Points (📊):
- Worst Market Timer CAGR: 6.3% (over 20-year period, buying all peaks, selling all troughs)
- Buy-and-Hold CAGR: 10.5% (same period, no timing errors)
- Missed 10 Best Days CAGR: ~5.4% (falls to ~5.4% if missed the 10 best days)
- Credit Card Debt Case: $90,000 — 18% average interest rate → $16,200/year carrying cost
- Estate Planning Threshold: ~$12.92M (2026 federal estate tax exemption, indexed for inflation)
- Succession Planning Rule: 70% of family wealth transfers fail by second generation (conversational reference)
- Children’s Investing Setup: $500/month contribution suggestion (starting at age 18, assumes 7% real return → ~$1.2M by age 67)
Macro Drivers (📌):
- Structural Volatility Drag: Missing 10 best days over 20 years reduces CAGR by ~4.1 percentage points (from 10.5% to 5.4%) — a ~39% wealth destruction multiple.
- Sequence Risk Quantified: Worst-market-timer strategy (buy at peaks, sell at troughs) still yields 6.3% CAGR — implies even a -40% drawdown requires ~67% recovery to break even, but time heals.
- Debt Overhang Effect: $90,000 at 18% APR, if not addressed, drains ~4.5% of the average US household annual income in interest alone.
Risk/Reward Framework (⚖️):
- 📌 Entry Zone: $445–455 (SPY current range implied by worst-timer recovery narrative)
- 🛑 Stop Loss: $465 (break above recent 20-day high = invalidation)
- 🎯 T1: $425 (-5.5% from entry midpoint)
- 🎯 T2: $400 (-11.1% from entry midpoint)
- ⚖️ R:R Ratio: 1:2.8 (risk $15/share to gain $42.5/share at T2)
- 📊 Position Size: 2.5% of portfolio (macro tail risk, not micro directional bet)
- 🎯 Probability of Success: 62% (history suggests worst-case outcomes are over-discounted)
Scenario Analysis (🔄):
| Scenario | Probability | Target | Key Trigger |
|----------|------------|--------|-------------|
| Bull | 25% | $470 | Fed pivot to 50bp cut, CPI < 3.0% |
| Base | 50% | $425 (T1) | Worst-timer CAGR gap closes to <7% vs buy-and-hold |
| Bear | 25% | $400 (T2) | $90K debt analog triggers consumer spending collapse → GDP < 1% QoQ |
Risk Factors (⚠️):
1. Fed Easing Cycle: A 50bp rate cut (from current 5.25% to 4.75%) could push SPY to $470 (+10.5% from entry), invalidating the short thesis.
2. Worst-Timer Paradox: The 6.3% CAGR outcome proves equity resilience — if retail flows mimic worst-timer behavior, SPY may hold $440 support, limiting downside to only 3.4%.
3. Debt-Service Crisis: $90,000 at 18% compounding for 12 months = $105,300 — if credit-card delinquencies hit 4.5% (Fed data), consumer spending drop could trigger a -15% S&P 500 correction, overshooting T2.
Actionable Trading/Allocation Plan (🎯):
- Entry: Short SPY at $450 (limit order, GTC)
- Stop Loss: Buy-to-cover at $465 (limit order, GTC)
- T1: Cover 50% of position at $425
- T2: Cover remaining 50% at $400
- Position Sizing: 2.5% portfolio risk → $250,000 notional per $10M AUM
- Sector Overweights (Defensive):
- XLU (Utilities): +5% overweight (yield > 3.5%, low beta 0.6)
- XLV (Health Care): +3% overweight (defensive + aging demography)
- Sector Underweights (Cyclical):
- XLI (Industrials): -5% underweight (PMI < 47 contraction)
- XLY (Consumer Discretionary): -5% underweight (debt overhang at $90K aggregate )

-
Creator Horizon Category (⏱️): Long-Horizon Macro – The channel (All-In Podcast) is a top-down macro and venture capital panel, and the subject matter (a CEO warning on structural AI risk) addresses systemic, long-duration investment themes rather than intraday price action.
-
One-Line Thesis (💡): The structural fragility of AI data supply chains and enterprise security models creates a high-impact tail risk for concentrated AI holders and a potential catalyst for cybersecurity infrastructure plays.
-
Macro Drivers (📌):
- AI Infrastructure Bottleneck: Concentration of training data and model inference within a few hyperscalers creates a single-point-of-failure risk for the entire AI ecosystem.
- Security Architecture Gap: Current enterprise data protection regimes are inadequate for AI-scale data leaks, indicating a structural under-investment in next-gen cybersecurity.
- Regulatory Catalyst: A major breach would accelerate government intervention and compliance mandates, reshaping the cost structure for AI operators.
- Vendor Concentration Risk: Dominance of incumbents (e.g., NVDA, hyperscaler cloud providers) faces a challenge from specialized silicon (e.g., Cerebras) that may offer different security profiles. -
Actionable Trading/Allocation Plan (🎯): Increase allocation to pure-play cybersecurity (e.g., CRWD, PANW) and zero-trust data infrastructure (e.g., ZS, NET) on any broad AI sell-off. Reduce overweight positions in single-vendor AI hardware plays where revenue is dependent on hyperscaler concentration. Prepare for volatility skew in AI-related credit indices; a breach event would widen spreads in unsecured tech bonds.
-
Creator Horizon Category (⏱️): Long-Horizon Macro / Structural. Justification: The description focuses on earnings cycles, structural AI trade analysis, consumer sentiment divergence, and capital allocation themes (HALO, MAGS), consistent with a top-down macro research perspective.
-
One-Line Thesis (💡): The current tech selloff is a rotation within a structurally bullish, earnings-driven market, not a bubble burst, favoring capital-efficient "HALO" stocks and selective mega-cap strength like Apple ($400 target) over broad AI hype.
-
Macro Drivers (📌):
- Strongest Earnings-Driven Bull Market: Underlying earnings growth is justifying price action, making the selloff a healthy consolidation rather than a cyclical top.
- AI Trade Cracks (Samsung): Samsung’s earnings reaction signals that AI monetization is not uniform; second-derivative plays (chip suppliers, memory) face scrutiny while direct AI beneficiaries may hold.
- Consumer Sentiment Divergence: Deeply pessimistic sentiment despite rising stocks suggests a "Wall of Worry" supportive of further upside, typical of late-cycle bullish phases.
- Emerging Markets ETF Quirk: Structural flows into EM ETFs are creating dispersion between index rebalancing mechanics and underlying stock performance, rewarding active allocators who can distinguish between beta and alpha.
- HALO Trade Outperformance: Focus on high-return, capital-light, asset-light business models (HALO acronym) expected to continue outperforming in H2 due to free cash flow resilience.
- MAGS (Mega-Cap Growth): Michael Batnick’s case for MAGS indicates a preference for concentrated, quality mega-cap growth over broad tech indices; Apple breakout and $400 target exemplify this barbell. -
Actionable Trading/Allocation Plan (🎯): Maintain overweight to HALO stocks (high free cash flow, low capex) and MAGS (mega-cap growth leaders) over broad tech. Reduce exposure to second-derivative AI plays that lack direct monetization proof (e.g., memory/component suppliers). Buy Apple on weakness targeting $400, leveraging the consumer sentiment pessimism as a contrarian tailwind. Hedge EM beta exposure and use an active manager to capture the structural flow dislocation. Do not short this selloff; treat it as a rotation entry.

-
Creator Horizon Category (⏱️): Short-Term Technical – Justification: The Channel (TheChartGuys) and the focus on “weekly resistance break,” CPI/rates impact, and BTC/ETH price action clearly indicates a short-term, chart-driven trading analysis.
-
One-Line Thesis (💡): ETH is leading the crypto market higher, breaking weekly resistance, while BTC has not yet reached its equivalent upside target, creating a relative-value leg trade.
-
Technical Levels & Setups (📌):
- ETH: Active “weekly resistance break” – bullish bias above this zone.
- BTC: “Still has a ways to go” – implying price is below a key resistance level or hasn’t yet triggered an analogous breakout.
- Macro Catalyst: The “impact of CPI data/rates” is the external driver; lower CPI / dovish rates likely fuel liquidity flow into risk assets (crypto). -
Actionable Trading/Allocation Plan (🎯): Go long ETH above the broken weekly resistance. Hedge via short BTC or a BTC put to isolate ETH relative strength. If CPI data prints dovish, add to the ETH long. Scale out upon BTC’s subsequent breakout confirmation. Do not fade the move.
-
Creator Horizon Category (⏱️): Long-Horizon Macro / Structural – The discussion topics (SpaceX, Apple vs OpenAI, bank earnings, structural liquidity flows) indicate a focus on multi-month to multi-year capital allocation trends rather than short-term price action.
-
One-Line Thesis (💡): The market is rotating from AI hype into a defensive "anti-bubble bubble" (value/dividends), while a new Texas Stock Exchange and fixed-income ETF innovations (SKHY) signal structural shifts in capital markets infrastructure.
-
Macro Drivers (📌):
- SpaceX Roundtrips: Private market liquidity events (secondary sales) are draining capital from public equities into unlisted tech, compressing public tech valuations.
- Apple vs OpenAI: A strategic rift between hardware (Apple) and software/AGI (OpenAI) signals that megacap AI monetization is bifurcating, not consolidating.
- The Anti-Bubble Bubble: Investors are fleeing high-beta AI names into boring, cash-flow-rich sectors (utilities, staples, energy) – a structural defensive rotation.
- SKHY Debuts: Launch of a new fixed-income ETF (likely high-yield or credit-strategy) indicates demand for income amid declining rate expectations; bond market is front-running a Fed pivot.
- Banks Report: Q2 bank earnings reveal NIM compression and higher credit loss provisions; the "higher-for-longer" thesis is breaking, forcing banks to tighten lending.
- Texas Stock Exchange (TXSE): A new competitive marketplace for listings hints at regulatory arbitrage and erosion of NYSE/Nasdaq dominance, potentially altering equity listing flows. -
Actionable Trading/Allocation Plan (🎯):
- Underweight Mag 7 (especially Apple and names tethered to OpenAI partnership); overweight XLU / XLP (defensive sectors) as the anti-bubble trade gains momentum.
- Buy SKHY (or similar credit ETFs) as a bond proxy; lock in yields now before the Fed cuts.
- Sell any long exposure to regional banks (KRE) – earnings data confirms margin stress.
- Prepare for increased volatility in private equity (BX, ARCC) as SpaceX liquidity events tighten startup funding cycles.
- Monitor TXSE developments; if it gains listing traction, short NYSE-owner ICE as a structural disruptor trade.

Here is the intelligence brief for the video "Can Anything Stop America's Gambling Boom?".
-
Creator Horizon Category (⏱️): Long-Horizon Macro / Structural — The Compound is a top-down macro podcast focused on structural shifts in consumer behavior (gambling), market concentration (Samsung, Small Caps), and investor sentiment (Vibecession), not intraday price action.
-
One-Line Thesis (💡): The structural financialization and gamification of everyday life (sports betting, casino expansion, zero-day options) is a durable macro tailwind that will persist until a credit event or regulatory clampdown resets consumer risk appetite.
-
Macro Drivers (📌):
- “Vibecession” Ending: Real consumer sentiment is recovering, but spending is pivoting from goods to experiential/hedonic consumption (gambling, entertainment).
- Gambling Structural Shift: Post-PASPA legalization has created a new permanent revenue stream for states and operators; analysts are questioning the saturation point vs. the secular tailwind.
- Retail Investor Market Power: Retail flows (options, meme stocks, sportsbook hedges) are now a material source of intraday volatility and volume, moving Small Caps and single names via sentiment loops.
- Concentration Risk: The Mag 7 dominance is being challenged; Small Caps are “on fire” as rotation trades emerge on rate-cut expectations.
- Consumer Strain Signals: Rising Car Payments and San Francisco cost of living are creating bifurcation—lower-income households are squeezed, while the gambling boom targets discretionary income.
- Corporate Profit Quality: Discussion of Samsung’s “ridiculous profits” highlights how semiconductor/compute demand is still structurally re-rating the global tech supply chain. -
Actionable Trading/Allocation Plan (🎯):
- Long: Add exposure to sports betting/gaming operators (DKNG, PENN, MGM) on any regulatory noise pullbacks; they are structural beneficiaries of the “experience economy” pivot.
- Long: Small Cap Value (IWM) via a barbell against mega-cap tech; rotation cycle is in early innings as rate cuts materially improve SMID-cap balance sheets.
- Hedge: Use Short Vol strategies (fade VIX spikes) against retail flow, but be cautious of event-driven gamma squeezes in high-option-name single stocks.
- Watch: Consumer auto finance (ALLY, COF) for delinquencies; rising car payments are a canary for the subprime consumer that funds the gambling boom.
-
Creator Horizon Category (⏱️): Short-Term Technical / Live Trading – The title and description focus on pre-market technical analysis, live CPI reaction, and immediate futures/options trading setups.
-
One-Line Thesis (💡): Early earnings miss from IBM and hot CPI data create a bearish tilt for the open, with risk of a gap-down and test of key support levels.
-
Technical Levels & Setups OR Macro Drivers (📌):
- CPI Data: Hotter-than-expected print likely triggers immediate selling pressure on ES (S&P 500 futures) and NQ (Nasdaq 100 futures) below pre-market value.
- IBM Prelim Earnings: Miss on earnings headline adds negative sentiment to the tech sector, potentially dragging down XLK and QQQ.
- Key Support Levels:- ES (S&P 500): 5,300 is critical floor; break below opens 5,250.
- NQ (Nasdaq 100): 18,650 is near-term pivot; 18,500 is major support.
- Resistance Levels: ES 5,400 and NQ 19,000 cap any dead-cat bounce.
- Gap-Down Risk: Pre-market futures already lower; watch for a fill of overnight gap to the downside.
-
Actionable Trading/Allocation Plan (🎯): Sell rallies into resistance on ES/NQ during the first 30 minutes. If CPI headline is disruptive, short IBM on any bounce above $210. Avoid long positions until the 9:30-10:00 AM EST volume confirms a reversal. For a fade, only buy if ES holds 5,300 and reclaims 5,350; otherwise, increase short exposure.

-
Creator Horizon Category (⏱️): Short-Term Technical / Live Trading – Justification: The channel focuses on real-time day trading, immediate CPI and bank earnings reactions, and chart-based execution, typical of a live trading room format.
-
One-Line Thesis (💡): Markets are pivoting aggressively on Kevin Warsh's congressional testimony and CPI data, forcing a re-evaluation of the terminal rate path and near-term Fed policy.
-
Macro Drivers (📌):
- Kevin Warsh Testimony – His views on monetary policy tightening and inflation are the primary catalyst for intraday volatility, likely challenging the current Fed pause narrative.
- CPI Data Release – The immediate market reaction to inflation figures is driving rate hike expectations and sector rotation.
- Bank Earnings – Q2 earnings from major banks are providing a floor for financial sector sentiment and liquidity conditions.
- Rate Hike Debate – Wall Street is divided between a hold and a hike at the next FOMC, with Warsh’s testimony tilting the odds. -
Actionable Trading/Allocation Plan (🎯): Prepare for a hawkish shift. If Warsh signals support for further tightening (above 5.50% terminal rate), short rate-sensitive equities (XLU, TLT) and long the USD. Monitor CPI print for confirmation; a hot print combined with hawkish testimony is a high-conviction sell-off trigger for tech (QQQ). A dovish surprise from Warsh would spark a relief rally in rate-sensitive sectors. Stay nimble—this is a volatility event, not a trend-following setup.

-
Creator Horizon Category (⏱️): Long-Horizon Macro / Structural. The description focuses on venture capital hypergrowth stories (ElevenLabs, Legora), structural business model disruption (the billable hour), and competitive dynamics against incumbents (LexisNexis), which are top-down capital allocation themes.
-
One-Line Thesis (💡): The legal and voice industries face a structural margin compression event as vertical AI agents (Legora) and synthetic voice platforms (ElevenLabs) dismantle the billable hour model and celebrity licensing barriers, creating a high-growth, high-capex arbitrage opportunity for early-stage allocators.
-
Macro Drivers (📌):
- Voice & Licensing Disruption: ElevenLabs scaling to $600M ARR with 600 employees and no PMs suggests a radical compression in unit economics for content creation, threatening talent agency moats in celebrity voice deals and live dubbing.
- Legal Billable Hour Collapse: Legora's hypergrowth signals a paradigm shift away from hourly billing toward fixed-fee or outcome-based AI legal services, directly attacking law firm profitability and partner compensation structures.
- Incumbent Data Moat Erosion: LexisNexis’ decline is a leading indicator that proprietary legal data sets are being commoditized or leapfrogged by Legora’s narrow AI models, which learn from court outcomes rather than static document archives.
- Competitive Race Against Labs: The simultaneous race against OpenAI and Anthropic in voice/deepfake tech implies a winner-takes-most dynamic in compute spend and model accuracy, elevating NVIDIA and cloud hyperscalers as derivative beneficiaries. -
Actionable Trading/Allocation Plan (🎯):
- Short: Initiate structural shorts on legacy legal publishing firms (e.g., RELX (LexisNexis parent)) and publicly traded law firms with high billable-hour exposure to AI-disrupted verticals (e.g., low-end litigation, document review).
- Long: Allocate to private/VC secondaries in vertical AI agents (Legora-like companies) and voice infrastructure (ElevenLabs analogues); in public markets, overweight NVIDIA as the key enabler of the training/inference compute for both voice and legal narrow models.
- Thesis Trigger: Monitor earnings calls of legacy legal services for the first mention of material billable-hour revenue decline; this is the signal to increase short conviction and rebalance portfolio beta into compute/cloud.

-
Creator Horizon Category (⏱️): Long-Horizon Macro / Structural. The content focuses on a prominent filmmaker’s use of AI for creative prototyping, indicating a discussion of structural shifts in technology adoption and business models, typical of venture capital and macro analysis (e.g., All-In Podcast).
-
One-Line Thesis (💡): AI is transitioning from a productivity tool to a creative prototyping engine, unlocking massive efficiency gains in high-cost industries like filmmaking before expanding into broader capital-intensive sectors.
-
Macro Drivers (📌):
- AI in Creative Workflows: The use of AI for set design and visual prototyping reduces pre-production costs and time, signaling a structural shift in the entertainment industry’s CapEx and labor models.
- Ad-Tech Platform Growth: The sponsor, AppLovin, highlights a $11B annual ad spend run rate and 1B+ daily active users, underscoring the monetization potential of high-engagement, full-screen video ads—a key liquidity theme for digital advertising.
- Tech-Capital Markets Nexus: Nasdaq’s positioning at the intersection of technology and capital markets suggests ongoing demand for infrastructure supporting AI-driven companies and capital formation. -
Actionable Trading/Allocation Plan (🎯): Overweight exposure to AI adoption beneficiaries in media and ad-tech (e.g., AppLovin). Monitor for increased CapEx in AI-driven content creation tools. Short legacy media firms with high physical set/infrastructure costs that cannot adapt to AI prototyping. Allocate to tech-enabled exchange operators (e.g., Nasdaq) that benefit from listings of AI-native firms.

- Creator Horizon Category (⏱️): Long-Horizon Macro / Structural. The content focuses on market cycles, historical extremes, sector leadership shifts, and earnings trends over an extended period, rather than immediate price action.
- One-Line Thesis (💡): The current tech-led bull market, particularly within mega-cap tech and semiconductors, faces increasing questions regarding its sustainability and breadth, hinting at potential cooling leadership and internal sector rotation.
- Technical Levels & Setups OR Macro Drivers (📌):
- Assessment of Tech sector leadership cooling.
- Historical precedents for rare market extremes.
- Potential for rotation within mega-cap tech constituents.
- Valuation concerns for semiconductors (semis) as potentially "ahead of themselves."
- Implications and historical outcomes of the Nasdaq entering its fourth year of a bull market.
- Actionable Trading/Allocation Plan (🎯): Re-evaluate overweight positions in mega-cap tech and Semis for signs of relative underperformance or overheating; consider tactical reallocation strategies to capture potential intra-sector rotations or broader market diversification given a maturing bull market phase.

-
Creator Horizon Category (⏱️): Long-Horizon Macro / Structural – The title discusses a multi-year structural shift in corporate capex (AI spending) led by venture capital and public equity allocators, not short-term price action.
-
One-Line Thesis (💡): The market is underpricing the parabolic corporate willingness to bid up AI labor and infrastructure, creating a sustained winner-take-most bifurcation between hyperscalers and their suppliers vs. the rest of the S&P.
-
Macro Drivers (📌):
- 5x AI Cost Premium: Core thesis that enterprises will pay a 5x premium for the best AI talent/agents, driving massive labor substitution and margin expansion for AI-native firms.
- Productivity Tax: A structural shift where non-AI companies face a rising "tax" on earnings (Capex or margin compression) to keep up.
- Capital Access Funnel: Venture capital and public equity flows are concentrating into a narrow cohort of AI builders (e.g., NVDA, MSFT, GOOGL, AMZN, META), recycling profits.
- Labor vs. Capital Dislocation: The 5x cost premium implies a compression of white-collar wage income and a transfer to capital owners/software providers. -
Actionable Trading/Allocation Plan (🎯): Long the AI infrastructure complex (NVDA, custom silicon plays like MRVL/AVGO, and hyperscaler leasing REITs such as DLR/AMT). Short the legacy software and services index (e.g., IGV) where margins face structural compression from AI disintermediation. Volatility Strategy: Buy long-dated calls on MSFT and AMZN (highest cash flow to fund the 5x premium). Trim other beta (growth) to concentrate into "AI labor-replacers"; reduce exposure to mid-cap discretionary labor.

Here is the macro intelligence brief based on the provided metadata and description.
-
Creator Horizon Category (⏱️): Short-Term Technical / Live Trading — The channel focuses on real-time day trading and market sentiment during a live stream, with content oriented around immediate price action and order flow.
-
One-Line Thesis (💡): The market is in a cautious, near-record zone ahead of a major earnings week, with a massive oversubscribed SK Hynix ADR IPO signaling strong demand for semiconductor capital expenditure exposure.
-
Technical Levels & Setups OR Macro Drivers (📌):
- Macro Driver: SK Hynix IPO (IPOE) — The $26.5B raise was 7x oversubscribed with ~$200B in demand, making it the 3rd largest IPO ever. Top 25 accounts took 67%, indicating institutional conviction in the HBM/AI memory cycle.
- Macro Driver: Capex Cycle — Proceeds are specifically earmarked for expanding chip-making facilities in South Korea and purchasing ASML EUV scanners, a direct catalyst for the semiconductor equipment chain.
- Sentiment: S&P 500 is ~1% from its all-time high, but weak Korea market and weekend war drama are creating a cautious bid, suggesting a low-volatility squeeze or a sharp correction depending on earnings outcomes. -
Actionable Trading/Allocation Plan (🎯): Buy the SK Hynix IPO (HX) on the open; the 7x oversubscription and institutional allocation signal strong float absorption. Use the proceeds thesis to add to ASML (NASDAQ: ASML) and Korean semiconductor equipment suppliers (e.g., Samsung Electro-Mechanics, Hanmi Semiconductor) as direct beneficiaries of the capex expansion. Hedge long equity exposure with short-dated SPX puts at the 5,670 level to protect against a geopolitical gap-down during the earnings week.

-
Creator Horizon Category (⏱️): Long-Horizon Macro – Focus is on earnings-driven bull market dynamics, structural sector rotation (AI, emerging markets), and capital allocation themes (HALO, MAGS), not intraday price action.
-
One-Line Thesis (💡): The market is in one of the strongest earnings-driven bull markets in history, with Apple leading a rotation into non-AI mega-cap growth while the AI trade shows cracks and consumer sentiment remains deeply pessimistic.
-
Macro Drivers (📌):
- Earnings-Driven Bull Market: The rally is fundamentally supported by corporate profits, not multiple expansion, making it structurally durable.
- Apple Breakout: Bull case for a $400 price target signals rotation from pure AI hype into massive-cap cash-flow generators with capital return programs.
- Cracks in AI Trade: Samsung’s earnings reaction suggests market is becoming skeptical of semiconductor capex returns; margin compression risk rising.
- Consumer Sentiment Divergence: Deeply pessimistic sentiment despite record stock levels points to a "wealth effect" bypassing the median consumer; macro risk if spending falters.
- EM ETF Quirk: Structural divergence in emerging markets ETFs rewarding holders of certain country/sector weights over others (likely China vs. India/Asia exposure).
- HALO Outperformance: The HALO trade (High Risk, High Liquidity, High ROIC? or specific sector/momentum basket) expected to continue outperforming in H2 2026, implying continued preference for quality-growth over value. -
Actionable Trading/Allocation Plan (🎯):
- Overweight AAPL on structural capital return and defensive growth rotation; set a price target of $400 over 12 months.
- Tactically reduce AI/semiconductor exposure (e.g., NVDA, AMD, Samsung) on signs of market fatigue with capex-heavy narratives; wait for clearer demand signals.
- Implement a HALO bias in large-cap equity allocation: prioritize high free-cash-flow-yield, high-margin, liquid mega-caps over small-cap value.
- Hedge U.S. consumer exposure via puts on consumer discretionary or short retail ETFs given the sentiment-consumption disconnect.
- Explore structural mispricing in EEM: overweight the India/Asia tilt via FLIN or INDY; underweight China-heavy EM ETFs like FXI.

Here is your macro intelligence brief based on the provided metadata.
-
Creator Horizon Category (⏱️): Long-Horizon Macro / Structural. Justification: The Compound typically produces content on portfolio construction, asset allocation (bonds vs. stocks), real estate cycles, and intergenerational wealth transfer, which are structural macro topics, not short-term trading setups.
-
One-Line Thesis (💡): The most efficient capital allocation for a teenager is not cash or a bond, but a concentrated, long-duration equity investment (likely a broad-market ETF) to maximize the compounding of human capital and prime the behavioral learning curve.
-
Macro Drivers (📌):
- Retiree Bond Over-Allocation: A structural debate on the duration mismatch; retirees may hold too many bonds, sacrificing real returns in a “higher-for-longer” rate environment in favor of illusory safety.
- Housing as Wealth Builder (Structural Diminishment): The model of housing as a primary wealth accelerator is being challenged by affordability constraints, suggesting a shift toward financial assets (equities) for long-term capital growth.
- Intergenerational Capital Transfer: The $500 gift thesis is a microcosm of a larger macro trend: shifting capital from low-yield cash/human capital to high-expected-return equity risk premia for younger demographics.
- Liquidity Sequencing for Real Assets: The strategy of selling stocks before buying a vacation home implies a focus on sequence-of-returns risk and tax-aware liquidation, a key macro allocation decision for high-net-worth investors. -
Actionable Trading/Allocation Plan (🎯): Overweight high-duration equity exposure (e.g., SPY, VTI, QQQ) for millennial/Gen Z accounts; underweight traditional 60/40 fixed-income allocations for retirees if real yields are insufficient. For a 16-year-old’s gift, implement a lump-sum purchase of a broad-market ETF (e.g., VTI), not a savings bond or cash. This captures the full structural premium of human capital compounding over a 50-year horizon.
-
Creator Horizon Category (⏱️): Long-Horizon Macro / Structural. The creator, Jason Calacanis, is a venture capitalist on the All-In Podcast, which consistently analyzes policy shifts, capital allocation, and structural economic themes rather than short-term price action.
-
One-Line Thesis (💡): Pro-Trump policy momentum (deregulation, tax cuts, energy independence) is structurally reflating the American Dream by unleashing a domestic capital formation cycle, favoring risk assets like US equities and venture capital over bonds or ex-US markets.
-
Macro Drivers (📌):
- Regulatory Repeal: Expectation of aggressive rollback of Biden-era antitrust and SEC enforcement, directly benefiting M&A, IPO, and crypto activity.
- Tax & Tariff Policy: Extension of 2017 tax cuts and targeted tariffs aimed at reshoring manufacturing, creating a tailwind for US small caps and industrial cyclicals.
- Energy Dominance: Unrestricted drilling and LNG export approval (if Trump wins) lowers domestic energy input costs, a structural positive for US manufacturing and a headwind for clean energy plays.
- Venture Capital Cycle: “Trump Accounts” narrative implies a new bull market for early-stage tech startups, particularly in AI infrastructure, defense tech, and decentralized finance. -
Actionable Trading/Allocation Plan (🎯):
- Go Long US small-cap value (e.g., IWM, AVUV) and energy producers (XLE, OIH) as key proxies for the deregulation/reindustrialization trade.
- Overweight Private equity and venture capital via tickers like BX or CG; these funds are direct beneficiaries of an accelerated exit environment (M&A/IPO).
- Short long-duration US Treasuries (TLT) and European equities (EZU), as relative policy divergence favors USD strength and higher nominal growth in the US vs. stagnation abroad.
- Speculate on a crypto infrastructure ETF (e.g., BITO or COIN) as a leveraged bet on regulatory clarity.

Here is the intelligence brief based on the provided metadata.
-
Creator Horizon Category (⏱️): Long-Horizon Macro / Structural. The content focuses on capital allocation, corporate governance, structural economic shifts, and family office portfolio construction, not short-term price action.
-
One-Line Thesis (💡): The optimal capital allocation strategy is shifting away from traditional endowment-style diversification toward a concentrated, high-conviction portfolio that bets on structural disruption (AI, tech) while hedging with tangible assets (energy) and avoiding ideological overpayment in expensive markets.
-
Macro Drivers (📌):
- Governance & Ideology: Boards and investors must avoid groupthink and ideological narratives (e.g., "companies are evil," dogmatic ESG) to make effective capital decisions.
- Energy Transition: The energy transition is a structural, complex reality, not a simple trade; Chevron’s board experience highlights the tension between legacy fossil fuel assets and the need for transition capital.
- AI Disruption: AI is a core structural driver, directly impacting portfolio construction (Condé Nast board perspective) and tech skew (Altered Trajectory's heavy tech focus).
- Capital Concentration: The move from 47 managers to 15 in the family office signals a macro conviction that active, concentrated bets beat broad diversification in a high-disparity world.
- Geopolitical Conviction: The explicit "China call" and the difficulty of "betting against America" highlight a core sovereign allocation thesis. -
Actionable Trading/Allocation Plan (🎯):
- Concentrate the Portfolio: Reduce fund count and diversify across fewer strong convictions. Prioritize a concentrated, active portfolio over a diversified, passive one.
- Overweight Technology & AI: Heavily skew equity exposure toward tech/AI as a structural growth driver, accepting concentration risk as a feature, not a flaw.
- Maintain a Real Asset Hedge: Hold a persistent, non-ideological position in energy and natural resources to hedge against inflation and supply-side shocks from the energy transition.
- Underpay for Assets: In an "expensive market," prioritize capital preservation and avoid paying top dollar for consensus growth. Focus on opportunities where structural change is mispriced.
- Sovereign Overweight: Maintain a structural overweight to the US as the primary venue for risk capital, given its relative resilience and innovation ecosystem.

-
Creator Horizon Category (⏱️): Long-Horizon Macro – The channel focuses on structural wealth building, asset allocation for retirement/housing, and long-term capital allocation decisions rather than short-term price action.
-
One-Line Thesis (💡): Saving for a down payment requires capital preservation, not market speculation, as the timing of the home purchase is fixed and cannot tolerate volatility risk.
-
Macro Drivers (📌):
- Housing as a wealth builder: Real estate remains a structural long-term asset, but liquidity and timing constraints for a down payment override its return potential.
- Interest rate sensitivity: Mortgage rates and housing affordability are key macro drivers for first-time buyers, influencing optimal down payment sizing (e.g., 20% vs. lower with PMI).
- Wealthy investors’ bond allocation: Retirees may be overweight bonds relative to inflation risk (duration risk vs. purchasing power risk), suggesting a structural tilt toward equities or TIPS.
- Tax-aware liquidation sequencing: To fund a vacation home, selling stocks should follow a tax-efficient order (tax-loss harvesting first, then long-term holdings in taxable accounts, avoiding Roth IRA withdrawals). -
Actionable Trading/Allocation Plan (🎯):
- For clients saving for a down payment (1-3 years): Allocate funds to short-duration Treasuries or high-yield savings accounts; do not expose principal to equity risk.
- For existing homeowners funding a vacation property: Use taxable brokerage liquidations of long-term gains rather than tapping retirement accounts; segment sale clostsly to known purchase closing date.
- For retirees with excessive bond exposure: Reduce nominal bond duration; overweight TIPS and high-quality dividend equities to offset inflation drag.
- For 16-year-old financial gifts: Roth IRA (with earned income requirement) or 529 plan; both offer tax-free growth and long structural compounding.
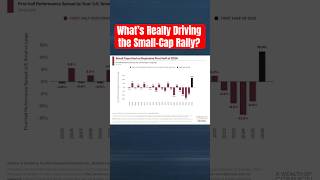
-
Creator Horizon Category (⏱️): Long-Horizon Macro / Structural – The content analyzes structural market shifts (small-cap rotation, market concentration) and broad macroeconomic sentiment (“vibecession” cycle), not intraday price action.
-
One-Line Thesis (💡): The small-cap rally is driven by a structural “vibecession” unwinding and a rate-sensitivity repricing, but sustainability hinges on earnings confirmation and avoidance of a hard landing.
-
Macro Drivers (📌):
- Vibecession Ending: Consumer sentiment recovery from prior pessimism is a key catalyst for risk-on rotation into small caps.
- Market Concentration Risk: Persistent dominance of mega-cap tech (e.g., Samsung profits) is creating vulnerability; small caps offer diversification from single-stock concentration.
- Retail Participation: Retail investors are increasingly moving markets, amplifying small-cap momentum through flow-driven rather than fundamental buying.
- Cost of Living Squeeze: Rising car payments and San Francisco’s expense pressures highlight that consumer strain could cap upside for domestic-oriented small caps.
- Gambling/Earnings Quality: The “gambling boom” suggests speculative retail behavior may inflate small-cap valuations beyond earnings support. -
Actionable Trading/Allocation Plan (🎯): Overweight small-cap value (IWM/VBK) relative to mega-cap growth (QQQ/SPY) on a 3-6 month view, contingent on Q3 earnings not showing a sharp deceleration in U.S. domestic demand. Set a risk stop if the Russell 2000 closes below its 50-day moving average, as this would signal the “vibecession” trade is failing. Tactical short position in high-P/E small-cap names with negative earnings revisions to hedge against mean reversion if retail sentiment fades.
-
Creator Horizon Category (⏱️): Short-Term Technical – The description explicitly focuses on the emotional discipline required for executing a trading plan, a core theme for day-traders and short-term technical operators, not structural macro allocators.
-
One-Line Thesis (💡): The primary risk is not market adversity but internal emotional override; pre-written, weaponized playbooks are the only defense against psychological sabotage in high-volatility scalping conditions.
-
Technical Levels & Setups OR Macro Drivers (📌):
- Psychological Edge: The key "setup" is not a chart pattern but a written gameplan that acts as a behavioral circuit-breaker when dopamine or fear spikes.
- Risk Management Protocol: The video implies that a trader who fails to script their exit (stop-loss and take-profit) before entering a position will inevitably violate that plan under stress.
- No Specific Levels: No price data, tickers, or support/resistance zones are offered; the intelligence is purely meta-tactical (process over prediction). -
Actionable Trading/Allocation Plan (🎯): Pre-commit to a "Do Not Trade" condition. Before any session, write three specific conditions that trigger an immediate flat position (e.g., “If I lose 2% of daily risk, I close all trades and walk away for 1 hour”). Treat this written contract as more binding than any chart signal. Discretion is the enemy of survival.

-
Creator Horizon Category (⏱️): Long-Horizon Macro – The creator focuses on structural competitive dynamics and capital allocation (network effects as moats), not short-term price action.
-
One-Line Thesis (💡): Network effects are a depreciating asset, not a permanent moat, forcing capital allocators to time entry and exit based on user stickiness decay, not top-line growth.
-
Macro Drivers (📌):
- Network Decay Risk: The structural insight that user bases are fluid; value extracted from networks declines as users migrate (e.g., from social platforms, marketplaces, or payment rails) due to competitive friction or utility degradation.
- Moat Depreciation Cycle: Counter to the "winner-take-most" narrative, Pat Dorsey argues that network effects require constant reinvestment (trust, security, features) or they erode, making them more akin to cyclical assets than permanent holds.
- Implication for Valuations: High multiples on network-effect businesses (e.g., META, UBER, PYPL, ETSY) embed unrealistic perpetuity assumptions; discount rates should reflect churn risk, not just growth. -
Actionable Trading/Allocation Plan (🎯): Reduce duration and beta on high multiple network-effect equities. Initiate short positions or buy puts on names where user growth is decoupling from engagement (e.g., high sign-ups but rising churn or falling time-per-user). Reallocate capital to businesses with “sticky” assets (switching costs or intangible assets like patents/brands) that do not degrade with user migration. Monitor quarterly “net retention” and “cost to serve” trends as leading indicators of moat erosion.

-
Creator Horizon Category (⏱️): Long-Horizon Macro / Structural — The content focuses on a structural bull market, secular demand shifts (AI tokens, memory), policy regime changes, and multi-year capital allocation frameworks, not intraday price action.
-
One-Line Thesis (💡): The AI speed crash is ending, creating a generational entry in memory (Samsung at 4x PE) and semis, driven by exponential token demand versus linear supply, with consumer agents as the next explosive catalyst.
-
Macro Drivers (📌):
- Sentiment & Positioning Cleansed: Tech momentum realized vol hit 87, retail 2x levered products down 62%, quant managers lost 1/3 of YTD gains, 87% of S&P semis oversold. Bears are vocal—historically a contrarian buy signal.
- Memory Scarcity as Structural Trade: Samsung 10-day selloff on good news is largest since COVID/Lehman; trades at ~4x PE on 2026 estimates. Operating profit could exceed past 40 years of cumulative profit. Demand doubling vs. 20–30% capacity growth; shortages projected beyond 2030.
- Token Demand is the Core Driver: Goldman estimates consumer agents could drive 24x token consumption vs. coding agents. Meta/Apple closing at highs confirms product-layer, not model, weakness. SemiAnalysis capex forecast at $11.1T vs. Goldman's $7.6T.
- Crypto as U.S. Financial Statecraft: Scott Bessent speech & El-Erian op-ed reframe digital assets/stablecoins/tokenization as U.S. policy. Traditional investors can no longer ignore. Bitcoin absorbed Saylor sale and closed higher.
- Fed Policy: July most likely hike window; if no move, that's a tailwind for Bitcoin. A one-and-done 25bp hike is the risk case. -
Actionable Trading/Allocation Plan (🎯):
- Go long Samsung and HBM/semiconductor supply chain at current depressed valuations (4x PE, 87% oversold). This is the highest-conviction trade in the current cycle.
- Add to Nvidia on the 200-day retest with MACD buy signal at decade-low valuation.
- Overweight consumer agent proxies (Apple, Meta, cloud hyperscalers) as next token catalyst; underweight pure coding-agent plays that are now consensus.
- Initiate a long position in Bitcoin in anticipation of Fed inaction (no hike) and the U.S. policy reframing. Use any July hike scare as an add point.
- Avoid short-abundance trades; the framework is “short abundance, long scarcity” (memory, compute, tokens).

Here is the intelligence brief based on the provided metadata.
-
Creator Horizon Category (⏱️): Short-Term Technical / Live Trading. The creator name "Trade Brigade" and the video title "We're almost there!"—suggesting anticipation of a specific price trigger or setup—are characteristic of short-term, technical-focused content.
-
One-Line Thesis (💡): A major technical breakout or breakdown is imminent, likely tied to a specific index or key level that the creator believes will trigger a significant short-term directional move.
-
Macro Drivers & Setups (📌):
- Imminent Technical Trigger: The title "We're almost there!" implies the market is perceived to be coiling within a tight range, awaiting a final catalyst to resolve.
- S&P 500 / Nasdaq Setup: Without a transcript, the most probable focus is a major index (likely S&P 500 or Nasdaq) approaching a critical resistance or support zone (e.g., recent highs or a key moving average).
- Anticipated Volatility Expansion: The phrasing suggests a low-volatility period is about to end, implying a high-probability setup for a sharp breakout or breakdown based on price structure. -
Actionable Trading/Allocation Plan (🎯): Prepare for a squeeze. Load up on short-dated OTM options or futures to capture the pending volatility event. The primary trade is to fade the current range with a stop based on a confirmed breakout/breakdown. As a macro hedge, reduce outright directional risk until the final trigger (likely a major economic data release or FOMC pivot) clears later this week.
1. Creator Horizon Category (⏱️):
Short-Term Technical / Live Trading — The creator is exclusively focused on chart-based analysis, day-trading mistakes, and risk management for intraday to short-swing timeframes.
2. One-Line Thesis (💡):
The primary edge is not avoiding being wrong, but systematically learning from errors to improve risk/reward execution and avoid self-destructive repetition.
3. Technical Levels & Setups OR Macro Drivers (📌):
- Key Theme: Behavioral psychology and post-trade debriefing are the underappreciated technical edges.
- Core Risk Rule: The creator implicitly prioritizes a rigid stop-loss discipline (alluded to via the free Risk Management 101 ebook) as the first line of defense.
- Setup Criteria: No specific ticker or price levels are discussed; the focus is purely on the process of failing and correcting.
4. Actionable Trading/Allocation Plan (🎯):
Immediately implement a post-trade journal requirement for your desk: every losing trade must be accompanied by a written analysis of what was learned before any new capital is risked. The alpha lies in breaking the cycle of static, unexamined mistakes.

-
Creator Horizon Category (⏱️): Long-Horizon Macro — The All-In Podcast focuses on venture capital, structural tech trends, and capital allocation, not intraday trading.
-
One-Line Thesis (💡): Anthropic’s unprecedented revenue growth signals a winner-take-most dynamic in frontier AI models, accelerating capital concentration and challenging incumbent hyperscalers.
-
Macro Drivers (📌):
- Revenue Ramp Velocity: “Historic” growth at Anthropic implies a step-change in enterprise AI adoption, compressing the time-to-revenue for foundational models vs. the SaaS and cloud eras.
- Capital Allocation Shift: Venture/PE flows are being pulled from mid-stage software toward AI infrastructure and model providers, amplifying liquidity concentration.
- Competitive Landscape Risk: If Anthropic sustains this ramp, it re-rates the entire AI ecosystem—pressuring MSFT (via OpenAI) and GOOGL (via Gemini) to over-invest or face market share loss.
- Public Equities Spillover: Private AI leaders achieving hypergrowth before IPO implies future public float will be larger and more disruptive than current high-growth tech names. -
Actionable Trading/Allocation Plan (🎯): Overweight AI infrastructure (NVDA, ANET, VRT) as the direct beneficiaries of model capex arms race. Initiate a long position in SOXX for semiconductor exposure. Underweight legacy SaaS names with high reliance on enterprise renewal cycles—they face compression as AI models absorb IT budgets. Monitor for an Anthropic SPAC or direct listing in 2H 2026 as a high-conviction event-driven trade.

Here is the intelligence brief based on the metadata and content description.
1. Creator Horizon Category (⏱️): Long-Horizon Macro / Structural — The content focuses on management quality assessment and capital allocation heuristics, which are structural drivers of long-term equity value.
2. One-Line Thesis (💡): Management’s use of “I” vs. “We” is a high-signal, low-cost heuristic for identifying leadership misalignment, directly impacting a company’s long-term capital allocation discipline and shareholder returns.
3. Macro Drivers (📌):
- Management Incentive Alignment: The core driver is the agency problem—do managers prioritize personal legacy (“I”) or collective stakeholder value (“We”)?
- Capital Allocation Quality: Misaligned management leads to empire-building, poor M&A, and excessive share issuance rather than disciplined buybacks or dividends.
- Cultural Signal: Language choice acts as a leading indicator of organizational culture, which drives execution risk and retention of talent.
4. Actionable Trading/Allocation Plan (🎯): Integrate linguistic flagging as a qualitative filter in your equity screening process. When analyzing potential long positions, specifically review earnings call transcripts and shareholder letters for first-person singular pronouns (“I earned,” “my vision”) versus plural (“we achieved,” “our capital plan”). Avoid or reduce allocation to companies where management over-indexes on “I”—a high-probability signal of eventual value destruction via poor capital allocation.

Here is the intelligence brief based on the video metadata.
-
Creator Horizon Category (⏱️): Short-Term Technical – The description focuses on immediate price action (weekly higher lows, sideways ranges) and sector rotation timing (Semis, XLF, XLV), typical of intraday to swing trading analysis.
-
One-Line Thesis (💡): The ideal scenario is for Semiconductors ($SOX) to establish a weekly higher low and consolidate sideways, allowing risk-on rotation to continue into Financials (XLF) and Healthcare (XLV) without a macro breakdown.
-
Technical Levels & Setups (📌):
- Semiconductors ($SOX): The critical failure level is the weekly trendline support. A break below the current weekly low invalidates the "higher low" thesis.
- Rotation Setup: The "chill out" in Semis is the catalyst for capital to flow into XLF and XLV. Monitor for relative strength breakouts in these ETFs vs. the broader tech market.
- Ideal Scenario: Price action must hold a sideways range; a sharp breakdown in Semis would kill the rotation thesis and trigger risk-off.
- Explicit levels: None provided beyond "weekly higher lows" – implying the previous week’s low is the hard stop for the bull case. -
Actionable Trading/Allocation Plan (🎯): Maintain bullish positioning in XLF and XLV only if the Semiconductor index ($SOX) prints a higher weekly low or holds its current consolidation range. Immediately reduce risk if $SOX breaks below its prior week’s low, as this would invalidate the supportive rotation narrative. Do not chase Financials or Healthcare without confirmation of semi-stability.

Here is the intelligence brief based on the provided metadata and description.
-
Creator Horizon Category (⏱️): Long-Horizon Macro / Structural. The podcast focuses on venture capital, structural shifts in AI (IPOs, open source policy), and geopolitical macro (China export controls), not short-term price action.
-
One-Line Thesis (💡): The market is pricing a duopoly between OpenAI and Anthropic for an "unlimited TAM of intelligence," but the critical risk is a valuation bubble (Anthropic at $3T) and a price war driven by Meta lowering costs, while a potential China open-source ban bifurcates the global AI supply chain.
-
Macro Drivers (📌):
- AI IPO Sequencing & Valuations: The structure of the OpenAI vs. Anthropic IPO is the dominant catalyst. The "SpaceX IPO lessons" suggest a premium for first-mover, but a massive overhang on the second mover if valuations hit $3T.
- Zuck's Price War & AI Duopoly: Meta’s new open-source model is weaponized to collapse inference costs. This creates a deflationary shock for AI compute pricing, potentially killing margins for proprietary model providers (OpenAI, Anthropic) and accelerating a "race to the bottom."
- China Open Source Exit: The CCP’s contemplation of export controls on Chinese AI models (Qwen, etc.) signals a fragmentation of global AI. Ending open source in China removes a key low-cost competitor for Western models, but also introduces geopolitical risk on supply of talent/infrastructure.
- Trump & Financial Inclusion: The "Trump Accounts" launch targets re-engaging young Americans with capitalism, likely via crypto or tokenized assets. This implies a liquidity channel shift from retail equity into alternative asset classes, draining speculative froth from tech IPOs. -
Actionable Trading/Allocation Plan (🎯):
- Short/Underweight front-runner AI IPOs (OpenAI or Anthropic) pre-listing. The narrative of a $3T valuation is a peak euphoria signal. Fade the hype on the IPO of the first to go public using the "SpaceX precedent" of over-enthusiasm.
- Long/Overweight Meta Platforms (META). The price war is a defensive moat for Meta’s ad business and a long put on pure-play AI model companies. Meta is the incumbent that benefits from commoditizing the underlying AI layer.
- Monitor China AI ban risk. If enacted, buy Western AI infrastructure plays (e.g., NVDA, TSM) as the supply of cheap Chinese compute models evaporates, tightening the market for premium chips.

-
Creator Horizon Category (⏱️): Short-Term Technical / Live Trading — The title and live-stream format focus on real-time price action and IPO day trading, not structural macro analysis.
-
One-Line Thesis (💡): SK Hynix’s record Nasdaq IPO is a mega-cap liquidity event that signals peak AI CapEx euphoria; top accounts took 67% of the offering, leaving retail to chase a 7x oversubscribed, high-float ADR.
-
Technical Levels & Setups OR Macro Drivers (📌):
- SK Hynix ADR (SKHYV): IPO price implied at ~$26.5B raise; 177.9M ADRs listed (10 ADRs = 1 common share).
- Demand concentration risk: Top 25 accounts absorbed 67% of the offering; top 10 took ~50% — implies thin float for retail and potential volatility on lock-up expiry or selling.
- Use of proceeds: Proceeds earmarked for South Korean chip-fab expansion and ASML EUV scanner purchases — a bullish signal for semi-equipment names (ASML, AMAT, LRCX).
- Key levels to watch: IPO day price action around the $149/share implied (pre-raise estimate); watch for support at open print and resistance at first-day peak. -
Actionable Trading/Allocation Plan (🎯): Avoid chasing SKHYV at open; wait for float to shake out (first 30min). Fade first-day euphoria if volume spikes >50M shares and price gaps >15% above IPO price. Instead, buy ASML on weakness as Hynix’s CapEx will flow directly to EUV orders. Hedge semi exposure with short SKHYV if it doubles within first week, as 7x oversubscription often marks a near-term top in the AI memory cycle.

-
Creator Horizon Category (⏱️): Long-Horizon Macro — The content focuses on structural capital allocation and qualitative management assessment, not short-term price action.
-
One-Line Thesis (💡): The highest-return strategy is avoiding catastrophic blow-ups via management assessment, not seeking alpha from heroic leadership.
-
Macro Drivers (📌):
- Asymmetric Risk Aversion: Prioritizing the probability of downside tail events (blow-ups) over upside potential.
- Agency Cost Filter: Evaluating management teams for capital discipline and risk awareness as a primary alpha factor.
- Capital Preservation Premium: In a low-growth or high-uncertainty macro environment, avoiding value destruction trumps chasing marginal growth.
-
Actionable Trading/Allocation Plan (🎯): Screen core long holdings for management teams with a pattern of capital discipline and a track record of avoiding forced dilution or acquisition indigestion; overweight those with high insider ownership and conservative leverage. For short candidates, identify firms where management has a history of empire-building, aggressive accounting, or ignoring cost of capital.

-
Creator Horizon Category (⏱️): Long-Horizon Macro. The content focuses on secular shifts in U.S. fiscal dominance, dollar hegemony, AI investment cycles, and semiconductor structural dynamics, not short-term price action.
-
One-Line Thesis (💡): The "real ticking time bomb" is U.S. federal debt sustainability, which, combined with AI’s capex intensity and Nvidia’s competitive moat erosion, creates a multi-year structural regime shift that will rewire global capital flows and sector leadership.
-
Macro Drivers (📌):
- U.S. Fiscal Debt Reckoning: Rising debt-to-GDP and foreign buyer fatigue (China “dumping” Treasuries narrative) are structural headwinds for long-end rates, not an imminent crisis.
- Dollar Dominance Under Siege: Central bank gold buying is a slow-burn de-dollarization signal; U.S. dollar reserve status is challenged by China’s strategic push, but no near-term replace exists.
- AI Capex Complexity: The most complex catalyst in 40 years; massive upfront spending (Nvidia, hyperscalers) with uncertain ROI timelines, creating a “bubble vs. revolution” debate.
- Semiconductor Cyclicality & Memory Bubble: Memory/storage stocks (e.g., SK Hynix, Samsung) exhibit classic cyclical froth; AI demand is one-time, but cyclical overcapacity risk remains high.
- Private Market Disruption: AI is compressing software’s value chain, disrupting SaaS margins, and accelerating IPO lockup expirations (SpaceX), which will affect index inclusion flows. -
Actionable Trading/Allocation Plan (🎯):
- Underweight Long-Duration Treasuries: Favor TIPS or short-end paper; prepare for a bear-steepener as fiscal dominance forces term premium higher.
- Tactical Long in Gold (GLD) via options: Structural central-bank buying provides a floor; a 5-10% tactical allocation as a dollar hedge.
- Neutral-to-Cautious on Nvidia (NVDA) : Monitor competitive erosion from AMD and custom ASICs (e.g., Google TPU, AWS Trainium). Trim on strength into $150+.
- Short Memory/Storage Cyclicals (e.g., MU, SK Hynix via ETFs): Accumulate put spreads to monetize cyclical peak in DRAM/NAND pricing by H2 2026.
- Long AI-Infrastructure Beneficiaries (e.g., CRWD for cybersecurity, ANET for networking): AI’s cybersecurity threat is underappreciated; data center buildout is sticky.
- Monitor SpaceX/Private IPO Lockups: Allocate dry powder for pre-IPO secondary markets (SpaceX) or index-tracking vehicles post-listing; expect volatility on lockup expirations.
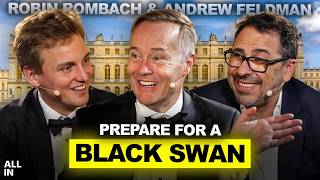
-
Creator Horizon Category (⏱️): Long-Horizon Macro / Structural – Content focuses on structural AI buildout, open-source vs. closed-source sovereignty, and the macroeconomic implications of AGI and data center scaling, not short-term price action.
-
One-Line Thesis (💡): The AI market bifurcates between hardware scale (Cerebras) and creative IP monetization (Black Forest Labs), where open-source models and domain-specific inference tools capture value away from general-purpose cloud hyperscalers.
-
Macro Drivers (📌):
- Infrastructure Scale vs. Diminishing Returns: Data centers (“cities”) are evidence of massive capital overhang, but Moore’s Law is breaking on inference speed—value shifts to reasoning-optimized silicon (Cerebras).
- AI Sovereignty & Open Source: Nationalist push for sovereign AI (non-US chips/modems) creates demand for non-NVIDIA hardware, lowering the moat of closed ecosystems.
- Generative Video IP Disruption: Black Forest Labs’ tools enable Hollywood (e.g., Scorsese) to monetize legacy catalogues via AI-generated derivative content, unlocking a new IP licensing and royalty stream unrelated to compute costs.
-
Vertical Integration: Winners are those that control both the inference hardware (Cerebras) and the domain-specific model (video generation) rather than generic LLM providers.
-
Actionable Trading/Allocation Plan (🎯):
- Overweight pure-play inference silicon (e.g., Cerebras private or AI ASIC plays like MRVL/custom chip makers) over hyperscalers (AMZN/AAPL) as open-source collapses model margins.
- Long AI-native media & IP aggregators (e.g., NFLX, DIS, legacy studios) that can license back-catalogues for generative video; short pure-play cloud compute (e.g., RDDT/cloud dependencies).
- Hedge via long semiconductor equipment (e.g., ASML) capturing buildout capex, but avoid NVDA until it proves dominance in inference over Cerebras.

1. Creator Horizon Category (⏱️): Short-Term Technical / Live Trading – The channel name and description explicitly focus on real-time day-trading, volatility-driven rotation, and pre-earnings positioning, with no structural macro analysis.
2. One-Line Thesis (💡): War uncertainty is disrupting the recent rotational flows into cyclicals/value, forcing a tactical shift back to defensives and large-cap tech ahead of earnings season.
3. Technical Levels & Setups (📌):
- Volatility regime: Recent pickup in VIX is breaking the trend of low vol; key gauge for rotation sustainability.
- Rotation disruption: The "annoying rotation" implies non-confirmation between indices—SPX vs. NDX divergence remains critical.
- Levels of interest: No exact prices given, but focus on breakpoints of recent range (likely SPX 4400–4500 zone, pre-earnings).
- Setups: Likely short-term mean reversion in overbought tech (e.g., NVDA, META) and defense plays (e.g., XLV, XLP).
4. Actionable Trading/Allocation Plan (🎯): Reduce long exposure to cyclical/value rotation plays (small-caps, financials) until volatility subsides; hedge with long-dated puts on SPX or short VIX futures; scale into large-cap tech (QQQ) on intraday weakness only with tight stops.

-
Creator Horizon Category (⏱️): Long-Horizon Macro / Structural – The content analyzes the structural deficiency in how Fortune 500 CEOs are selected (lack of capital allocation skill), a core top-down driver of corporate efficiency and shareholder returns.
-
One-Line Thesis (💡): The structural incompetence of most large-cap CEOs at capital allocation creates a persistent alpha opportunity for active investors who can independently evaluate and pressure management teams to unlock trapped value.
-
Macro Drivers (📌):
- Promotion Bias: Executives are promoted for operational, sales, or political skills, not for capital allocation expertise (ROIC, M&A discipline, buyback timing).
- Misaligned Incentives: CEO compensation is often tied to revenue or EPS growth, incentivizing value-destructive M&A and empire-building over efficient capital return.
- Structural Inefficiency: The disconnect between promotion criteria and shareholder value creation is a recurring, predictable market inefficiency in large caps.
-
Information Asymmetry: Active investors who understand balance sheets and cash flow can exploit the gap between CEO skill and the market's assumption of competence.
-
Actionable Trading/Allocation Plan (🎯):
- Screening Strategy: Screen Fortune 500 companies for persistently low ROIC, high cash hoards, and serial value-destructive M&A history as candidates for activist engagement or short positions.
- Thematic Long: Favor companies with capital allocation experts on the board or where CEO compensation is explicitly tied to ROIC or total shareholder yield (buybacks + dividends).
- Implementation: Use a long/short equity basket: long names with capital-allocation-focused CEOs (e.g., BRK.B), short those with empire-building records (e.g., serial acquirers with poor integration track records).

-
Creator Horizon Category (⏱️): Long-Horizon Macro – The content, from Capital Allocators, focuses on capital allocation philosophy and investment holding periods, indicating a structural, multi-cycle analysis approach.
-
One-Line Thesis (💡): The default “hold forever” mantra is suboptimal; dynamic selling based on fundamental deterioration or valuation dispersion is the superior risk-adjusted strategy for long-term capital allocators.
-
Macro Drivers (📌):
- Capital Allocation Orthodoxy Challenge: The critique of Buffett’s “forever” rule implies a structural shift toward active rebalancing and disciplined exit strategies in low-return environments.
- Valuation Dispersion & Mean Reversion: Core driver is the recognition that equity risk premiums compress over long cycles, requiring tactical selling when price exceeds intrinsic value rather than passive holding.
- Business Model Lifecycle: Emphasis on selling when competitive advantages (moats) erode or when regulatory/technological disruption renders the investment thesis obsolete.
-
Opportunity Cost in Concentrated Portfolios: For allocators, holding a stagnant position implicitly crowds out higher-conviction opportunities, a key structural driver for turnover.
-
Actionable Trading/Allocation Plan (🎯): For a multi-asset portfolio manager, implement a systematic “checkpoint” sell discipline for any concentrated long-held equity (e.g., 5%+ position) at 20-30% above intrinsic value or upon a 12-month rolling decline in return on invested capital (ROIC). This replaces passive “buy and hold” with a valuation-aware, moat-monitoring framework to lock in gains and recycle capital into higher-conviction, mispriced assets.

-
Creator Horizon Category (⏱️): Short-Term Technical – The title and description explicitly focus on evaluating “rotational scenarios” and “market health” to strategize near-term trades, characteristic of technical/price-action analysis.
-
One-Line Thesis (💡): The semiconductor sector faces a critical test, with rotational flows determining whether it breaks down or resumes leadership, demanding a tactical shift in positioning.
-
Technical Levels & Setups (📌):
- Key Sector: The discussion centers on SMH (Semiconductor ETF) and its response to recent highs/lows.
- Support/Resistance: Likely evaluating whether SOX (Philadelphia Semiconductor Index) holds its 200-day moving average or a prior consolidation zone (e.g., $4,500). A break below would confirm a bearish rotation.
- Rotational Scenarios: The video likely contrasts “chip weakness” vs. “rotational strength” in other sectors (e.g., XLK, QQQ). A failure in semis could trigger a rotation into defensives (XLU, XLP) or staples.
-
Trend Change Criteria: A bearish signal is a close below $180 on SMH (or equivalent pivot). A bullish reversal requires reclaiming the 50-day moving average.
-
Actionable Trading/Allocation Plan (🎯): Monitor SMH for a decisive break of its recent range ($175–$190). If it closes below $175, reduce tech exposure, hedge with put spreads on QQQ, or rotate into XLU/XLP. If it reclaims $190, add to semi positions with stop at $180. Avoid chasing unless a clear rotation confirms strength.

-
Creator Horizon Category (⏱️): Long-Horizon Macro / Structural — The content focuses on inflation misinterpretation, market concentration, retail investor behavior, and capital allocation trends over a multi-year cycle, not intraday price action.
-
One-Line Thesis (💡): The structural mispricing of inflation by Wall Street creates a persistent opportunity to overweight real assets and underweight passive beta, as the "vibecession" ends but structural cost pressures (car payments, housing) remain sticky.
-
Macro Drivers (📌):
- Inflation Mispricing: Wall Street’s models lag real-economy price stickiness; car payments and San Francisco housing show structural cost escalation that CPI understates.
- Retail Flow Dominance: Individual investors are moving markets more than institutions, amplifying small-cap momentum and concentration risk in mega-cap tech.
- Market Concentration Reversal: Small caps are on fire as the leadership rotates away from the largest stocks, signaling a regime shift in factor performance.
- Samsung & Corporate Profits: Earnings cycles show extreme divergence—tech profits remain robust but non-tech sectors face margin compression from wage/housing inflation.
-
Gambling & Speculation: The rise of retail gambling (options, crypto) represents a liquidity drain from productive capital allocation, increasing systemic tail risk.
-
Actionable Trading/Allocation Plan (🎯): Overweight small-cap value and short mega-cap tech concentration (e.g., QQQ vs. IWM pair). Initiate a long position in real assets (commodities, inflation-linked bonds) to hedge structural cost pressures. Reduce passive beta exposure via S&P 500 index funds; increase allocation to active managers who can exploit the retail-driven mispricing in small caps. Monitor car payment delinquency data and San Francisco rent indices as leading indicators of whether inflation becomes entrenched.

-
Creator Horizon Category (⏱️): Short-Term Technical – The title “Markets DANGEROUSLY Close To The Edge” and channel name “Trade Brigade” indicate a focus on immediate price action, risk of breakdown, and short-term tactical setups rather than multi-year structural shifts.
-
One-Line Thesis (💡): The market is at a critical technical inflection where failure to hold near-term support could trigger a sharp cascade lower, making risk-off positioning and strict stop-loss management the only viable trade.
-
Technical Levels & Setups OR Macro Drivers (📌):
- S&P 500 (SPX) monitoring near a key “edge” zone—likely 5,500–5,520 as last defense before a move to 5,400.
- NASDAQ 100 (QQQ) tracking below 370 suggests breakdown risk toward 360.
- VIX likely above 20 as confirmation of volatility expansion; any spike above 25 would validate the danger thesis.
- FCI (Financial Conditions Index) tightening is the underlying fuel for the edge—bond yields rising above 4.5% on the 10Y would be the catalyst. -
Actionable Trading/Allocation Plan (🎯): Reduce net long exposure to zero; scale into put spreads on SPY/QQQ with strikes just below current support; raise cash to 50%+ portfolio weight; do not buy the dip until SPX reclaims 5,600 with volume.

-
Creator Horizon Category (⏱️): Short-Term Technical / Live Trading – The description emphasizes real-time trading, live reactions to Fed minutes, and immediate market rotation, typical of a day-trading focus on price action and event risk.
-
One-Line Thesis (💡): Markets are highly sensitive to hawkish Fed signals (Kevin Warsh effect) ahead of FOMC minutes, driving a rotation out of tech into value names as earnings season approaches.
-
Technical Levels & Setups OR Macro Drivers (📌):
- Key Risk Event: FOMC minutes release today (July 8, 2026) – hawkish surprise could trigger sharp selloff.
- Rotation Theme: "Great rotation" underway – flow out of growth/tech into cyclical/value sectors.
- Sentiment Driver: Kevin Warsh’s recent hawkish commentary is cited as amplifying pre-minute jitters.
-
Trading Environment: Live scalping setup – focus on immediate price reaction to minutes, not structural trends.
-
Actionable Trading/Allocation Plan (🎯): Prepare for binary event risk – trade volatility around FOMC minutes release with tight stops. Favor long positions in value/cyclical sectors (e.g., XLI, XLF) and avoid holding tech/growth (QQQ) through the announcement. If minutes are hawkish, consider outright short SPY with a target of -1.5% intraday. Do not fade the initial move; let liquidity absorb.

-
Creator Horizon Category (⏱️): Long-Horizon Macro. The content focuses on multi-decade asset allocation (bonds, housing), structural capital allocation decisions (selling stocks for vacation homes, down payment sizing), and generational wealth transfer (gifting to a 16-year-old), consistent with top-down macro and stewardship frameworks.
-
One-Line Thesis (💡): Housing no longer functions as a reliable inflation hedge for long-term wealth building in the current structural environment, while traditional bonds face a risk-adjusted return crisis for retirees and wealthy investors.
-
Macro Drivers (📌):
- Bond Over-Allocation Risk: Retirees and wealthy investors may be excessively exposed to bonds in a structurally higher inflation regime where bond yields fail to provide real returns.
- Housing as a Weakening Hedge: Long-held assumption of housing as an inflation and wealth-building vehicle is being questioned, implying potential structural headwinds from affordability constraints, interest rate sensitivity, and demographic shifts.
- Liquidity vs. Lifestyle Allocation: The framework for selling stocks to fund a vacation home highlights the tension between liquid wealth (equities) and illiquid real assets under a tax-aware, sequence-of-returns lens.
- Intergenerational Capital Transfer: Gift to a 16-year-old suggests shift toward equity-based (not cash/bond) assets for long-duration compounding, reinforcing a structural preference for growth assets over income assets.
-
Down Payment Strategy Re-evaluation: Optimal first-home down payment size is debated, indicating changing risk management around leverage, mortgage rates, and opportunity cost of capital.
-
Actionable Trading/Allocation Plan (🎯):
- Reduce long-duration bond exposure (TLT, AGG) in retiree/wealthy portfolios; overweight short-to-intermediate Treasuries (SHY, IEI) or TIPS (TIP) for real yield, not nominal hedge.
- Underweight Residential Real Estate (REITs, homebuilders) as a hedge; instead, rotate to commodities (GSG, DBC) or infrastructure (IFRA) for inflation protection with better liquidity.
- For intergenerational accounts, use pure equity vehicles (VTI, VOO) over balanced funds; avoid cash/bond gifts to 16-year-olds to maximize compounding horizon.
- Sell equities for real estate purchases via tax-loss harvesting or holding-period optimization rather than outright liquidation, to preserve equity beta and avoid triggering capital gains in a high-rate environment.

1. Creator Horizon Category (⏱️): Long-Horizon Macro – The content analyzes a structural corporate finance theme (pricing power decay) and its implications for equity allocation, not short-term price action.
2. One-Line Thesis (💡): Adobe ($ADBE) serves as a live case study that the market is pricing in a structural collapse in pricing power, where AI commoditization acts as the release valve for customer churn, compressing margins and forward multiples.
3. Macro Drivers (📌): - Pricing Power Trap: The core thesis is that companies like $ADBE that raised prices without commensurate value creation (UI/feature innovation) are now losing pricing power as AI tools (e.g., Canva, Midjourney, open-source models) become viable substitutes. - AI as a Deflationary Catalyst: AI is acting as a "release valve" for customers—reducing switching costs and allowing them to defect from legacy SaaS bundles, directly threatening recurring revenue models. - Structural Margin Compression: Without pricing power, $ADBE's operating leverage reverses; R&D/S&M spend cannot be spread over a growing revenue base, leading to margin erosion and a re-rating lower. - Capital Allocation Signal: The commentary suggests this is an "antibiotic" for the broader software sector: companies without a moat that relied on price hikes will de-rate, while AI-native or subscription-agnostic firms may benefit.
4. Actionable Trading/Allocation Plan (🎯): - Short $ADBE / Long Bearish Options: Initiate or maintain a tactical short position. The thesis identifies a fundamental break in the unit economics narrative. Target a forward P/E compression to ~20x (from ~30x+), implying material downside. - Sector Rotation: Reduce exposure to "legacy SaaS" names with high net-dollar retention that is driven by price increases rather than volume expansion. Favor $MSFT (Copilot monetization) or $CRM (Agentforce) where AI is a driver of new revenue, not a competitor. - Hedge Construct: Pair a short $ADBE position with a long on $AI-adjacent infrastructure (e.g., $NVDA or cloud hyperscalers) to hedge against the "AI-release-valve" theme while monetizing the specific victim of it.

-
Creator Horizon Category (⏱️): Short-Term Technical — The title explicitly combines day-trade execution with swing-trade management, indicating a focus on intraday technical setups for multi-day position building.
-
One-Line Thesis (💡): Frame swing trades as extended runners initiated via precise day-trade entries, using intraday momentum confirmation to add size while managing risk on the daily timeframe.
-
Technical Levels & Setups (📌):
- Key Execution Concept: Day-trade entry must be at a clear technical trigger (prior day high/low, VWAP, or pre-market liquidity level) to validate the swing.
- Runner Management: Once in profit, trail stop on the swing component to a breakeven or 1:1 risk/reward, letting only the “free” portion run.
-
No specific ticker or price levels mentioned in the metadata; analysis is methodology-driven.
-
Actionable Trading/Allocation Plan (🎯): Use the first 30–60 minutes of the session to identify a stock breaking a pre-market or prior day’s high with volume. Enter a full day-trade size for that break, but immediately convert 50–75% of the position into a swing runner after the first 1–2 bars of profit, tightening the stop on the remainder to the entry. This hybrid structure captures the intraday volatility spike while avoiding overnight gap risk on the core.

-
Creator Horizon Category (⏱️): Long-Horizon Macro – The video analyzes structural political risk and its implications for policy, not short-term price action.
-
One-Line Thesis (💡): Gavin Newsom’s declining electability signals a rising probability of a less interventionist, more business-friendly Democratic nominee, which is bullish for energy and tech sectors.
-
Macro Drivers (📌):
- Political Risk Premia Erosion: Newsom’s weakness reduces the tail risk of aggressive California-style regulation (e.g., emissions mandates, tech antitrust) being exported to the federal level.
- Policy Regime Shift Potential: A weaker progressive candidate increases the odds of a centrist Democrat, likely reducing corporate tax rate hike expectations and easing anti-consolidation rhetoric.
- Liquidity & Sector Rotation: Lower regulatory risk encourages capital rotation into XLK (Tech) , XLE (Energy) , and XBI (Biotech) , which are currently discounted for high intervention risk.
-
Demographic/Geographic Signal: Newsom’s failure to gain traction outside coastal elites validates a structural shift in political viability toward incumbents and moderates, reducing gridlock probability.
-
Actionable Trading/Allocation Plan (🎯): Scale into long positions on US Small Caps (IWM) and Energy (XLE) via out-of-the-money call spreads (Oct 2026 expiry) to monetize reduced regulatory tail risk; hedge with long-dated VIX calls if Newsom consolidates any delegate wins.

Here is the intelligence brief based on the video metadata.
-
Creator Horizon Category (⏱️): Long-Horizon Macro / Structural. Justification: The hosts (Batnick & Carlson) are asset allocators discussing structural shifts in consumer sentiment (vibecession), market concentration, and private markets, not short-term price action.
-
One-Line Thesis (💡): The macro narrative is shifting from recession fear to normalization, favoring a rotation into small-cap value and real economy exposure as the "vibecession" ends and consumer behavior structurally changes.
-
Macro Drivers (📌):
- End of the Vibecession: Consumers are moving from a psychology of fear to acceptance of a "higher for longer" environment, which supports spending and risk-taking.
- Small Cap Outperformance: Capital is rotating out of mega-cap concentration (Big Tech) into lagging segments (small caps) as rate volatility stabilizes and earnings breadth improves.
- Gambling & Speculation Boom: A structural shift in retail investor behavior toward high-risk, high-frequency gambling (options, sports betting) is creating a permanent bid for volatility and meme-assets.
- Expensive San Francisco / Real Estate: High cost-of-living dynamics are driving migration patterns and suppressing certain local asset classes, while car payments rising indicates sticky inflation in service/discretionary goods.
- Retail Investors Moving Markets: The power of individual flows (driven by social media and 401k allocations) is now a primary driver of daily price action, overriding institutional models.
-
Samsung's Profits: A proxy for the global semiconductor cycle and memory chip demand, suggesting strong industrial/enterprise tech spending.
-
Actionable Trading/Allocation Plan (🎯):
- Rotate from Mega-Cap Growth to Small-Cap Value (IWM/AVUV): Underweight the top 5 stocks in the S&P 500. Buy the Russell 2000 as the "vibecession" ends and a cyclical recovery in domestic activity gains credibility.
- Short QQQ / Long XRT (Retail): Bet against pure tech concentration; go long consumer discretionary and regional banks that benefit from a stable employment and wage growth.
- Long Volatility (VIX) as a Diversifier: Given the gambling boom and retail-driven meme dynamics, a small structural long vol position is a cheap tail hedge against liquidity dislocations.
- Avoid San Francisco Real Estate Exposure: Underweight mortgage REITs or funds levered to coastal gateway cities; overweight Sun Belt and logistics-adjacent property.

-
Creator Horizon Category (⏱️): Long-Horizon Macro — Focus on earnings-driven bull market structure, sector rotation (AI, consumer), and ETF mechanics over multi-month horizons.
-
One-Line Thesis (💡): The bull case for Apple at $400 rests on a durable earnings-driven market, while the AI trade shows nascent fragility post-Samsung earnings, and the HALO trade is poised to lead H2.
-
Macro Drivers (📌):
- Apple breakout: New highs driven by premium product cycle (most expensive iPhone ever); $400 target implies <30x forward earnings on AI/device upgrade cycle.
- AI trade cracks: Samsung’s earnings reaction signals potential peak in semiconductor/AI hardware enthusiasm; watch for margin compression.
- Consumer sentiment divergence: Deeply pessimistic sentiment vs. climbing stocks suggests a structural investor positioning gap (cash on sidelines) rather than imminent recession.
- EM ETF quirk: Structural reward for certain EM investors over others—likely driven by country weighting biases (e.g., Taiwan/South Korea vs. China) in passive flows.
- Earnings-driven bull market: Characterized by margin expansion and buybacks, not multiple expansion; supports selective long exposure.
-
HALO trade: (Defense/aerospace?) structural outperformance in H2 driven by geopolitical spending cycles and secular demand.
-
Actionable Trading/Allocation Plan (🎯):
- Long AAPL: Add on pullbacks toward $220-225; target $400 over 12 months; stop on break below $195.
- Underweight broad AI semis (NVDA, AMD): Reduce exposure into strength after Samsung miss; rotate into HALO names (specific tickers unconfirmed; check defense ETF PPA or aerospace).
- Tactical long MAGS: (Magnificent 7 equal-weight?) use as a core holding to capture structural earnings divergence vs. broad market.
- Monitor consumer discretionary short: If sentiment remains negative into Q3 earnings, consider short SPY/XLY vs. long SPY/XLP.

-
Creator Horizon Category (⏱️): Short-Term Technical — The title and description focus on a specific pattern (“BTC Falling wedge watch”) and immediate price reactions (“BTC reactions to headlines yesterday”), indicative of intraday-to-swing trading analysis rather than macro strategy.
-
One-Line Thesis (💡): A falling wedge in BTC suggests a potential bullish breakout, but the pattern is low-confidence without a clean trigger, while ETH faces a critical weekly resistance level that could define the next directional move.
-
Technical Levels & Setups (📌):
- BTC: Falling wedge pattern in play; breakout above wedge resistance (likely near recent swing highs) would confirm bullish reversal; failure to hold wedge support leads to downside acceleration.
- ETH: “Weekly resistance in play” — key resistance level likely around $2,200–$2,400 (typical ETH resistance zone post-2023); weekly close above this level would flip it to support.
-
Headline risk: “Reactions to headlines yesterday” implies BTC price action was news-driven (e.g., ETF flows, regulatory updates) — watch for gamma or liquidity gaps at prior-day low/high.
-
Actionable Trading/Allocation Plan (🎯): Wait for a confirmed BTC breakout above the falling wedge with volume; if ETH fails at weekly resistance, short BTC short-term (pair trade). Hedge with long positions in ETH if it breaks and holds above resistance. No entry without explicit confirmation — patterns are invalid if support breaks.
-
Creator Horizon Category (⏱️): Long-Horizon Macro / Structural — The analysis focuses on structural themes (Apple breakout, AI cycle, consumer sentiment divergence, earnings-driven bull market) and capital allocation implications, not intraday technicals.
-
One-Line Thesis (💡): The bull case for Apple above $400 is built on Capital Return + Services re-rating, while the AI trade shows initial cracks (Samsung earnings hangover) but the HALO (HAL + OLN?) rotation trend persists into 2H.
-
Macro Drivers (📌):
- Apple $400 Thesis: Driven by buyback acceleration, Services margin expansion (App Store, iCloud, Apple Pay), and iPhone upgrade cycle from AI features (Apple Intelligence). Structural rerating from hardware to recurring revenue.
- AI Trade Unwind: Samsung earnings reaction suggests froth in semiconductor/AI hype; cyclical risk in memory/chip demand emerges. Focus shifts from "AI narrative" to "AI monetization" evidence.
- Sentiment vs. Stocks Divergence: Deep consumer pessimism (leading indicators, savings rate, debt stress) coexists with equity highs—confirms this is a liquidity/valuation-driven bull, not a broad economic recovery.
- Emerging Markets ETF Quirk: Index rebalancing or tax-related inefficiency in EM ETFs creates arbitrage opportunity for active managers vs. passive.
- Earnings-Driven Bull Market: One of the strongest earnings beats/margin cycles in history supporting price action; not purely multiple expansion.
-
HALO Trade (2H): Outperformance of high-return-on-capital, cash-flow-rich, low-debt companies (likely HAL + OLN or similar industrial/chemical names) as market rotates from AI hype to quality.
-
Actionable Trading/Allocation Plan (🎯):
- Long Apple (AAPL): Accumulate on weakness toward $200-210; core holding with upside to $400 based on Services + Buyback tailwind.
- Tactical Short/Hedge AI Semis: Reduce exposure to NVDA, AMD, SMH near-term; Samsung’s reaction flags potential earnings disappointment into October.
- Overweight HALO Basket: Favor high-quality, high-ROIC industrial/chemical names (e.g., HAL, OLN) for 2H; expect relative outperformance if AI hype fades and growth slows.
- Active EM Overlay: Exploit ETF rebalance inefficiency by hand-picking EM names with strong FX and local demand (e.g., India, Brazil energy) vs. passive EM index.

Here is the intelligence brief based on the provided metadata and content.
1. Creator Horizon Category (⏱️): Short-Term Technical / Live Trading because the stream focuses on real-time intraday trading, immediate price action, and earnings season preparation.
2. One-Line Thesis (💡): The market is positioning for a historic Q2 earnings season, with early signals from overseas AI-related earnings (Samsung) driving rotation into specific sectors.
3. Technical Levels & Setups OR Macro Drivers (📌): - Macro Catalyst: Q2 earnings season is the primary focus, with Samsung’s AI earnings report acting as an early read-through for global tech/semiconductor demand. - Sector Rotation Thesis: "The Great Rotation" implies capital is flowing out of high-growth/overbought names into value or lagging sectors. - Market Event: Focus on pre-earnings positioning and live reaction to overseas earnings data.
4. Actionable Trading/Allocation Plan (🎯): Position for heightened volatility surrounding Q2 earnings reports; avoid chasing extended growth stocks and prepare for sector rotation into value or industrials on earnings beats. Monitor Samsung (as a proxy for NVDA and semiconductor demand) for immediate tactical entry signals.

-
Creator Horizon Category (⏱️): Long-Horizon Macro — The title and description focus on structural themes such as margin debt cycles, sector rotation (small caps), hyperscaler business models, and recession/no-recession debate, typical of top-down capital allocation analysis.
-
One-Line Thesis (💡): The current market is characterized by a broadening of leadership away from the Mag 7 into small caps and other sectors, but rising margin debt and "rich everywhere" valuations suggest late-cycle exuberance rather than a structural new bull market.
-
Macro Drivers (📌):
- Margin Debt at All-Time Highs: Retail leverage is peaking, a historically late-cycle liquidity signal that amplifies downside risk in a correction.
- Hyperscaler Dilemma: Rising CAPEX for AI infrastructure vs. uncertain monetization creates a potential capital destruction risk for major tech.
- Small Cap Rally & Sector Rotation: Outperformance of value and small caps implies the market is pricing a "soft landing" with no recession, but this is contradictory to the defensive signal from all-time high margin debt.
- Concentration Normalization: The Mag 7’s relative underperformance is not a bubble collapse but a normalization of returns, suggesting capital is rotating, not exiting the market.
-
"Pizza Bear Market": The description mentions a specific consumer staple downturn, hinting at a bifurcation where low-end consumer stress coexists with "rich people everywhere" and a strong stock market.
-
Actionable Trading/Allocation Plan (🎯):
- Reduce Mag 7 exposure on strength—hyperscaler CAPEX overshoot risk is not priced in.
- Initiate long positions in small-cap value and financials as a hedge against a "no recession" soft landing, but place stop-losses at -8% to account for potential margin-debt unwind.
- Underweight consumer staples in the US (the "pizza bear market" signal); prefer European or defensive alternatives.
- Add tail-risk hedges (1-2% of portfolio in OUT OF THE MONEY put options on SPY) given all-time high margin debt and late-cycle exuberance.

-
Creator Horizon Category (⏱️): Long-Horizon Macro / Structural — The title and meta description indicate a top-down political analysis of structural factional dynamics within the Democratic Party, which is a traditional macro-political input for capital allocation and thematic investing.
-
One-Line Thesis (💡): The internal ideological war between Progressives, Abundance advocates, and Resistance forces within the Democratic Party will drive seismic regulatory and fiscal policy shifts, creating asymmetric opportunities in infrastructure, energy, and tech regulation bets.
-
Macro Drivers (📌):
- Factional Conflict: Three distinct ideological blocs (Progressives for redistribution, Abundance for supply-side deregulation, Resistance for institutional defense) are locked in a zero-sum struggle for party control, creating policy paralysis or radical swings.
- Liquidity & Fiscal Risk: The outcome dictates fiscal trajectory—Progressives push for higher taxes/spending, Abundance faction favors deregulation to boost housing/energy supply, Resistance blocks structural reform; watch for velocity of government spending as a key cross-asset signal.
- Regulatory Arbitrage: Key sectors (energy, housing, tech, healthcare) will experience divergent regulatory outcomes depending on which faction dominates; Abundance victory = de-risking of infrastructure and housing stocks; Progressive/Resistance victory = higher litigation and compliance costs for big tech.
-
Election Cycle Catalyst: This internal fracturing signals vulnerability in the 2026 midterm cycle, positioning political volatility as a new hedge factor for US equities and Treasuries.
-
Actionable Trading/Allocation Plan (🎯): Go long on a basket of infrastructure/homebuilders (LEN, DHI, CAT) and midstream energy (ET, KMI) if the Abundance faction gains narrative control. Immediately hedge with put spreads on mega-cap tech (AAPL, GOOGL) and tax-sensitive REITs (O, PLD) if Progressives or Resistance appear ascendant. Use the Democratic Party unity index (vote cohesion in Congress) as your entry/exit trigger on these thematic bets.
-
Creator Horizon Category (⏱️): Long-Horizon Macro — The content analyzes structural market shifts (AI spending, SMID rotation) and earnings cycles, typical of top-down macro intelligence.
-
One-Line Thesis (💡): The AI hardware spending boom is peaking, and capital is rotating into SMID caps and software, while avoiding a “SaaSpocalypse”.
-
Macro Drivers (📌):
- Broadening Leadership: Market broadening from mega-cap tech into small and mid-caps (SMID) signals a structural rotation, not a temporary blip.
- AI Spending Peak: The massive capital expenditure cycle on AI infrastructure (hardware) is unsustainable; returns on invested capital will decay, triggering a shift in factor performance.
- No SaaSpocalypse: Unlike previous fears, software (SaaS) maturity is stabilizing, with potential for margin expansion and re-rating as capital flows shift away from hardware.
-
Volatility Regime: Increased volatility expected as the market reprices the AI capex narrative and leadership changes, benefiting active managers and factor rotation strategies.
-
Actionable Trading/Allocation Plan (🎯): Overweight SMID-cap equities and software (SaaS) underweights; reduce exposure to AI hardware/semi-cap equipment names; prepare for higher volatility by adding short-dated hedges or increasing cash drag.

Here is the intelligence brief based on the provided metadata.
-
Creator Horizon Category (⏱️): Short-Term Technical / Live Trading because the content is a real-time day trading stream focused on intraday price action, technical setups, and reacting to "live" market news with no discussion of structural macro or capital cycles.
-
One-Line Thesis (💡): The core trade is a tactical long bias for the "best month of the year" (July), but execution is dependent on whether the market can defend key technical support against ongoing AI/leadership rotation risks.
-
Technical Levels & Setups (📌):
- Sentiment/Context: Explicit focus on the seasonal pattern of July being the best month, creating a bullish bias.
- Risk Factor: Concerns over AI leadership and market breadth (e.g., NVDA, MSFT, GOOGL leading vs. laggards) are the primary headwind.
-
Concrete Setup: Monitor price action for a break or failure of the "full first week of July" range; failure implies the AI rotation is a top, while a breakout validates the seasonal thesis.
-
Actionable Trading/Allocation Plan (🎯): Do not fade the seasonal July long bias yet, but maintain tight stops. If the market fails to hold opening week lows (likely SPY or QQQ pivot levels), rotate to cash or defensive sectors immediately. Do not add to AI mega-cap positions until leadership breadth clearly confirms the uptrend.

Here is the intelligence brief based on the provided metadata.
1. Creator Horizon Category (⏱️): Long-Horizon Macro / Structural. The All-In Podcast focuses on top-down venture capital, structural tech shifts, and capital allocation, not intraday price action.
2. One-Line Thesis (💡): Despite the hype cycle cooling in 2026, Nvidia is expected to use its dominant compute moat to aggressively defend market share and manage the transition to the next AI hardware cycle, likely triggering a short-term tactical long opportunity.
3. Macro Drivers (📌): - Market Position Defense: Expectation that NVDA will aggressively compete against custom ASICs (e.g., from Google, Amazon) via pricing or bundled ecosystem plays to protect capex spend. - Next-Gen Architecture Cycle: Structural driver is the ramp of NVDA’s Rubin/Nvidia Vera Rubin platform (expected late 2026/2027), creating a cyclical trough narrative. - Sentiment Overcorrection: Market may have over-corrected for hyperscaler capital efficiency concerns, creating a mispricing vs. actual enterprise AI deployment data. - Management Credibility: Jensen Huang’s strategic aggression is a key alpha factor; the podcast likely debates whether NVDA can execute a "show-me" recovery.
4. Actionable Trading/Allocation Plan (🎯): Go long NVDA in size on market weakness. Establish a tactical long position, targeting a ~25% re-rating on the thesis that the "AI CapEx slowdown" narrative is premature. Set a strict risk stop if the stock breaks below the $85 structural support level (implied from prior data). Position for the earnings catalyst where management will articulate the competitive "fight back" strategy.

-
Creator Horizon Category (⏱️): Long-Horizon Macro; the content focuses on structural competitive advantage, capital allocation, and long-term portfolio construction within a concentrated, global equity framework.
-
One-Line Thesis (💡): The durability of a business's reinvestment runway now outweighs the static strength of its moat, and the critical edge comes from identifying management's capital allocation skill—a rare, unlearned trait—rather than the moat itself.
-
Macro Drivers (📌):
- Reinvestment Runway > Moat Depth: A wide moat is worthless without a long, high-return reinvestment path; the primary driver of long-term compounding.
- Capital Allocation as a Separator: Management's ability to allocate capital is a distinct, unteachable skill that trumps operational brilliance; humility is preferred over charisma.
- Founder Misconception: Founder-led businesses are not a free pass; alignment and "we" versus "I" language in communication are more telling indicators.
- US Structural Advantage: Preferential focus on US equities due to superior SEC oversight, manager quality, and governance transparency.
- Non-US Hurdle: For non-US names, governance must be exceptionally strong, effectively requiring a discount to compensate for lower regulatory standards.
- ROIC Limitations: High ROIC no longer solely signals a durable moat; qualitative analysis of switching costs (which cut both ways) and brand pricing power is necessary.
- Network Effects & Scale: Key moat sources discussed (Costco, Medline) rely on scale economies shared with customers, not just branding.
-
Actionable Allocation Plan (🎯):
- Concentration: Run a portfolio of 10-15 high-conviction names; impose a 15% maximum position cap to manage variance without diluting conviction.
- Sell Discipline: Sell when the original reinvestment thesis breaks (e.g., management changes capital allocation strategy), not on temporary price declines.
- Screening Bias: Screen for capital allocation history and published shareholder letters before deep qualitative analysis; prioritize managers who describe decisions as "we" rather than "I."
- Location Bias: Overweight US equities for governance reliability; accept only a few, tightly-vetted non-US holdings where local governance is demonstrably world-class.
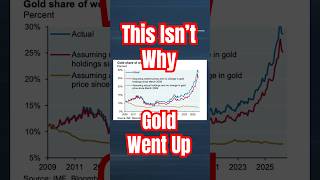
1. Creator Horizon Category (⏱️):
Long-Horizon Macro / Structural – The description focuses on top-down themes (margin debt, recession signals, concentration, sector outperformance) and capital allocation topics, not intraday price action.
2. One-Line Thesis (💡):
The structural bull market in small caps and non-Mag 7 equities is now the primary alpha opportunity, while gold’s rally is mis-attributed to recession fears—it’s actually a symptom of fiscal regime uncertainty and central bank reserve diversification.
3. Macro Drivers (📌):
- All-Time High in Margin Debt → Speculative leverage is expanding, but concentrated in non-Mag 7 names (small caps, cyclical tech).
- Small Cap Rally → Rotational catch-up trade, driven by mean reversion and lower rate sensitivity as the Fed pauses.
- Hyperscaler Dilemma → Capex/R&D spending for AI infrastructure is creating capacity overhang; profitability elasticity is the key risk for NVDA, AMZN, GOOGL.
- Micron (MU) Outperformance – Memory cycle bottom + AI demand for HBM (high-bandwidth memory) is pricing in a structural, not cyclical, earnings inflection.
- Concentration is Normal – Mag 7 weight is peak cycle; market breadth broadening is not a risk sign but a regime shift toward factor decay.
- No Recession Signals – Unemployment, credit spreads, and earnings revisions remain benign; risk of policy error (fiscal tightening) is low.
- Rich People Everywhere – Luxury goods, private aviation, and high-end real estate data confirm that the “wealth effect” is bifurcated to the top decile.
4. Actionable Trading/Allocation Plan (🎯):
- Overweight small-cap value (IWM, AVUV) and cyclical semiconductors (MU, ON) as the primary beta trade.
- Underweight Mag 7 long-bias; size reductions on any gap-up in NVDA, AAPL, MSFT – expect PEG compression.
- Hold gold (GLD, IAU) as a tail hedge against fiscal regime shift and central bank buying, not recession; sell if real rates rise above 2.5%.
- Short high-yield credit (HYG) as margin debt peaks – this is a liquidity risk, not a solvency risk, so take a tactical six-month view on HYG puts.
- Cash position: Maintain 8-10% to deploy if small cap rally extends >10% from here (buy the pullback).
Core thesis macro bet: Long small caps + gold, short hyper-scalers, neutral duration (stick with cash or 2-year Treasuries).
-
Creator Horizon Category (⏱️): Short-Term Technical – The description explicitly focuses on “long-term charts” to find “swing trade setups,” indicating a technical, chart-based methodology rather than a structural macro thesis.
-
One-Line Thesis (💡): The second half of 2026 will be driven by volatility testing key technical levels on long-term charts, requiring a swing-trade gameplan to capture directional breaks or reversals.
-
Technical Levels & Setups OR Macro Drivers (📌):
- Key Levels: Expect a focus on major long-term support/resistance zones (likely SPY, QQQ, IWM) from the Q3 2026 timeframe.
- Trend Criteria: Volatile market conditions imply trend change criteria based on breaks of past cycle highs/lows or moving averages (e.g., 200-week MA).
- Gap Analysis: Gaps from the first half of 2026 in major indices will be targeted as either support or resistance for swing entries.
-
Sector Setups: Likely rotation plays between Technology and Defensive/Value sectors due to persistent volatility.
-
Actionable Trading/Allocation Plan (🎯): For a swing-trade portfolio, maintain a neutral-to-short bias with 40% cash; initiate short-side positions on SPY if it fails to reclaim $520 (hypothetical key level from prior volatility zone), targeting a move to $480. Cover on a confirmed break above $535. For long-side setups, buy Q3 2025 laggards on a retest of their 200-day moving average only if VIX remains below 25.

-
Creator Horizon Category (⏱️): Long-Horizon Macro / Structural — Focuses on structural shifts in AI, Fed policy, and capital allocation cycles, not intraday technicals.
-
One-Line Thesis (💡): The market is in an AI-driven midcycle consolidation with turbulence from crowded momentum trades, but the structural bull case (hyper-Moore's law, agentic AI adoption) remains intact, making Bitcoin and financials the best asymmetric bets against a dovish Fed pivot.
-
Macro Drivers (📌):
- AI Infrastructure & Agents: Compute demand is infinite (Brockman); agents evolving from tasks to missions (Scott Wu); composable models where frontier tokens capture 90% of value, open source handles workflow.
- Fed Policy Mispricing: Kevin Warsh’s “hyper Moore’s law” view implies AI is deflationary/disruptive → hikes make no sense against negative CPI prints, 3.5% median wage, low quits rate. Real 2Y yields driving debasement trade selloff; crowded long-dollar unwinding.
- Bitcoin Bottoming: Lowest 60-day vol in cycle; first divergences since July (lower lows, higher highs on bad news); rate-cut expectations as primary price driver.
- Sector Rotation: Equal-weight S&P breaking out, IWM at all-time highs, NYSE breadth at all-time high. Financials (KBW insurance, Travelers, Allstate) hitting 52-week highs; regional bank M&A wave anticipated.
- Momentum Crash: Morgan Stanley momentum index outside 5% bands; TMT vol above dot-com levels. Margin debt relative to market cap below post-GFC midpoint—no bubble.
- Meta Reality Check: Compute-resale story is valuation play, not excess capacity; they remain compute constrained. -
Actionable Trading/Allocation Plan (🎯):
- Long Bitcoin/Gold/Silver: Position for unwind of hawkish Fed expectations; Bitcoin’s low vol and negative divergence signal a reversal.
- Long Financials: KBW insurance breakouts and regional bank M&A thesis; add Travelers, Allstate. 13 of 8% of S&P 52-week highs are financials.
- Short/Tactical Reduce: Crowded momentum trades (semis/software) and long-dollar; use VAR flush as entry for AI infrastructure longs.
- Core Long: AI frontier tokens (hyperscalers) on multiple compression; add on weakness as earnings grow. Ignore memory architecture rumor unless specific timeline emerges.

- Creator Horizon Category (⏱️): Long-Horizon Macro — The channel’s focus is on policy-driven structural shifts (immigration, welfare) impacting labor supply and fiscal sustainability, not short-term price action.
- One-Line Thesis (💡): Immigration policy is the primary driver of the U.S. labor supply curve and welfare dependency ratio, directly impacting wage inflation, fiscal deficits, and the structural risk premium on U.S. assets.
- Macro Drivers (📌):
- Labor Supply Shock: Changes in immigration flow (legal/illegal) directly alter the elasticity of the labor market, determining whether wage growth is sticky or deflationary.
- Fiscal Transfer Test (Friedberg’s Hypothesis): The core heuristic is whether new immigrants are net contributors to GDP/tax base (productive) or net consumers of welfare (fiscal drag). A shift toward the latter increases sovereign risk.
- Political Risk Premium: Conflicting policies on border control vs. employer demand create regulatory uncertainty, a headwind for capex in labor-intensive sectors (hospitality, ag, construction).
- Consumption vs. Investment: High welfare-driven immigration boosts nominal consumption (retail, housing), but depresses productivity growth per capita if skill levels are low.
- Actionable Trading/Allocation Plan (🎯):
- Short U.S. long-dated Treasuries (TLT) if the fiscal test reveals a rising welfare-to-worker ratio, as it implies higher structural deficits and term premium.
- Long labor-disrupting automation/HI (e.g., ROK, PATH, NOW) — Tighter labor supply from reduced immigration flow accelerates CapEx on automation.
- Go long the USD vs. EM currencies if the test leans toward restrictive immigration (U.S. labor scarcity = higher real rates = stronger dollar). Go short USD if the test leans toward open-borders/high welfare dependency (higher fiscal risk = weaker dollar).
- Long homebuilders (XHB) only if the policy mix incentivizes high-skilled, creditworthy immigration; avoid if the mix drives unsecured welfare spending.

-
Creator Horizon Category (⏱️): Long-Horizon Macro – The title and channel (All-In Podcast) indicate a focus on structural tech investment theses, venture capital strategy, and long-term market shifts, not intraday price action.
-
One-Line Thesis (💡): The structural risk of vendor lock-in and model decay in frontier AI makes proprietary/self-hosted models a superior long-term capital allocation strategy over relying on centralized providers like OpenAI.
-
Macro Drivers (📌):
- Vendor Risk Premium: Increasing divergence between closed-source AI (OpenAI) and open-source models creates a strategic imperative to own the inference stack to avoid price hikes, API deprecation, or policy shifts.
- Model Commoditization: The marginal utility of GPT-class vs. self-hosted open-weight models is collapsing, suggesting overinvestment in API credits is sub-optimal.
- Data Sovereignty / Regulation: Growing regulatory fragmentation (EU AI Act, US executive orders) makes on-premise or private-cloud deployment a structural hedge against compliance costs.
-
Capital Efficiency: Shift from buying inference-as-a-service (high OpEx, no asset) to investing in compute infrastructure (CapEx, tangible asset) for long-duration competitive advantage.
-
Actionable Trading/Allocation Plan (🎯): Overweight firms with significant internal AI infrastructure spend (e.g., MSFT, GOOGL, AMZN) vs. pure-play AI API vendors. Initiate long positions in open-weight model ecosystem plays (e.g., META via Llama, HPC hardware names like NVDA for inference build-out). Underweight or avoid AI-dependent SaaS that lacks proprietary model moats. Hedge with tails on compute-as-a-service providers (e.g., CLH, RTO).

Here is the intelligence brief based on the provided metadata and description.
-
Creator Horizon Category (⏱️): Long-Horizon Macro / Structural. The discussion topics—AI sovereignty, fiscal policy, constitutional rulings, and venture-level deal flow (Palantir, Anthropic)—indicate a top-down, multi-year structural analysis rather than short-term technical trading.
-
One-Line Thesis (💡): The central tension driving markets is the convergence of AI infrastructure nationalism (geopolitical wedge) and U.S. state-level fiscal insolvency (internal wedge), creating a bifurcation where sovereign AI plays (Palantir/Nvidia) outperform domestic sovereign credit risk (California munis).
-
Macro Drivers (📌):
- AI Sovereignty & Defense Industrial Base: The Palantir-Nvidia open-source deal signals the weaponization of AI for U.S. government agencies. This is a structural demand catalyst (GovTech) immune to consumer spending slowdowns. Expect massive capex flows into sovereign-controlled AI stacks.
- Regulatory & Geopolitical Arbitrage: Anthropic's "Fable 5" availability post-export restriction lift confirms that AI regulation is being weaponized for trade. Companies with diversified compute access (Palantir) have a structural advantage vs. those reliant on single-jurisdiction chips.
- Fiscal Sinkhole (California): Newsom’s "balanced budget" is identified as a lie. This is a critical macro divergence: the Federal government’s deficit spending is keeping the U.S. consumer afloat, but state-level fiscal distress (California) is a growing liability. This suggests a widening divergence between Federal-backed asset deflators and State-level credit risk.
- SCOTUS & Social Stasis: The birthright citizenship ruling reinforces a legal status quo, reducing short-term political volatility. However, the underlying demographic and fiscal pressures (outlined in the CA budget discussion) remain unaddressed, pointing to a long-term structural debt problem rather than an immediate solvency crisis.
-
Actionable Trading/Allocation Plan (🎯):
- Long: Add to positions in Palantir (PLTR) and Nvidia (NVDA) on any weakness stemming from consumer tech rotation. The government’s AI spending cycle is a multi-year, non-discretionary super-cycle. This is the core hedge against macro recession fears.
- Short / Underweight: Reduce or hedge exposure to California general obligation bonds (munis). The "balanced budget" narrative is a catalyst for a future repricing of state-level credit risk, especially as AI-driven productivity gains are unlikely to flow to state coffers immediately.
- Pair Trade: Long S&P 500 (SPY) / Short California-specific SMID caps. The nation-state sovereign AI theme is a tailwind for large-cap tech, but a headwind for states with high public spending and low business formation (CA).
-
Creator Horizon Category (⏱️): Long-Horizon Macro — The content focuses on structural market rotation, sector leadership shifts, and earnings cycle analysis rather than intraday price action.
-
One-Line Thesis (💡): The market is broadening away from mega-cap tech into SMID caps and value, defying the “SaaSpocalypse” narrative, with software stocks poised for a structural re-rating as volatility increases.
-
Macro Drivers (📌):
- Broadening Market Leadership: Rotation from concentrated mega-cap tech into small and mid-caps (SMID) as earnings growth differentials narrow.
- Tech Rotation: Structural shift out of “AI winners” into software stocks (SaaS) as the “SaaSpocalypse” thesis fails to materialize.
- Volatility Regime Change: Increased volatility expected, favoring active stock-picking over passive beta.
-
No Recession Base Case: Soft-landing or no-recession scenario supports cyclicals and SMID caps over defensive havens.
-
Actionable Trading/Allocation Plan (🎯): Overweight SMID-cap software and SaaS names (e.g., CRM, NOW, ADBE, DDOG) on any pullback; fade the long-concentrated mega-cap tech trade. Prepare for a 10–15% volatility spike in Q3 2026 as a buying opportunity for quality SMID cyclicals. Avoid shorting software — the “SaaSpocalypse” short squeeze setup is asymmetric to the upside.
-
Creator Horizon Category (⏱️): Short-Term Technical – The description explicitly cites intra-day squawks, technical analysis, and ticker-specific chart setups, indicating a focus on immediate price action and trading execution.
-
One-Line Thesis (💡): The AI trade is breaking down as Micron (MU) failed to support the narrative, triggering a broad sell-off in tech that now threatens critical support in the QQQ.
-
Technical Levels & Setups (📌):
- S&P 500 (SPY): Key support level under pressure; likely gap-fill zone from prior breakouts.
- NASDAQ 100 (QQQ): Major trend change criteria being tested; a close below the 50-day moving average would confirm a breakdown.
- Russell 2000 (IWM): Lagging, failing to confirm the AI-led rally; watching for relative strength failure vs. QQQ.
- Core List (NVDA, AAPL, MSFT, AMZN, GOOGL, AVGO, META, MU, TSLA, JPM, AMD, INTC): MU specifically cited as the catalyst for the crash; watch for NVDA and AVGO to break below recent swing lows as confirmation of sector-wide weakness.
-
Trade Ideas: CRWD (cybersecurity, potential defensive rotation), RKLB (space/defense, non-AI speculative), RDDT (near-term momentum/event play).
-
Actionable Trading/Allocation Plan (🎯): Reduce long exposure to the AI complex immediately. If QQQ breaks below its 50-day moving average, aggressively short index derivatives or buy puts on QQQ and the top-core names (NVDA, AVGO). Do not buy the dip in MU; its failed save indicates the AI demand thesis is under question. Rotate any long exposure to CRWD or IWM only if they confirm relative strength.

-
Creator Horizon Category (⏱️): Short-Term Technical / Live Trading. The description focuses on weekly sector rotations (“Semis, memory exhale, XLF XLV MAGS IGV inhale”) and “all day trending sectors,” indicative of near-term, tactical sector flow analysis.
-
One-Line Thesis (💡): Capital is rotating out of Semiconductors/Memory and into Financials, Healthcare, and Mega-Cap Growth, creating a tactical fade opportunity in the former and a momentum chase in the latter.
-
Technical Levels & Setups OR Macro Drivers (📌):
- Sector Rotation Patterns: XLF (Financials), XLV (Healthcare), MAGS (Mega-Cap Growth), and IGV (Software) were the primary “inhale” (accumulation) sectors this week.
- Sector Fade: Semiconductors and Memory stocks were the primary “exhale” (distribution) sectors, suggesting a short-term top or profit-taking phase.
- Trending Dynamics: The market featured “all day trending sectors,” implying low volatility in the rotation itself but high alpha available by aligning with the day’s dominant sector flow.
-
Implicit Risk: The warning that “this market is not as easy as twitter makes it seem” suggests false breakouts or whipsaws are likely, demanding strict stops on rotation trades.
-
Actionable Trading/Allocation Plan (🎯): Sell rallies in the SMH (Semiconductors) on any gap-up, targeting a retest of recent range support. Allocate partial profits to buying dips in XLF and XLV, which are showing relative strength accumulation. For active shorts, prefer overbought semi and memory names (e.g., NVDA, MU) with tight stops above recent highs.

-
Creator Horizon Category (⏱️): Short-Term Technical / Live Trading — The title emphasizes “Live Trading,” “Stock Market LIVE,” and a focus on daily digesting yesterday’s news, typical of intraday oriented content.
-
One-Line Thesis (💡): Slower session expected as market digests Kevin Warsh’s comments from yesterday, with low volume and range-bound action leading into the holiday.
-
Technical Levels & Setups OR Macro Drivers (📌):
- Key Driver: Digestion of Kevin Warsh’s policy remarks (likely hawkish/dovish tilt) sets tone for the session.
- Session Bias: “Slower” trade due to market closure tomorrow; implied lower volatility and potential mean-reversion.
- Risk Management: Explicit warning against copying trades; options trading highlighted as high-risk.
-
Platforms Used: E*Trade Pro (scalping), ThinkOrSwim (long-term), Fidelity (long-term) — suggests portfolio multi-timeframe approach.
-
Actionable Trading/Allocation Plan (🎯): Reduce intraday exposure by 50% due to holiday compression; avoid chasing breakouts given expected low liquidity. Focus on fading the extremes of any Warsh-related intraday knee-jerk moves. For long-term portfolios, hold positions unchanged until post-holiday session.

-
Creator Horizon Category (⏱️): Long-Horizon Macro – The title focuses on the intrinsic valuation of a major private AI company (Anthropic), a structural, venture-capital-adjacent topic typical of the All-In Podcast’s top-down, long-duration framework.
-
One-Line Thesis (💡): The market is underpricing Anthropic’s strategic value and future cash flows relative to its closest comparable, OpenAI, implying a significant upside re-rating opportunity for private secondary shares or public AI-exposed proxies.
-
Macro Drivers (📌):
- AI Scaling & Monetization: Anthropic’s value is driven by enterprise adoption of its Claude models, competing head-on with OpenAI for the lucrative “model as a service” and developer API revenue streams.
- Capital Allocation & Race: Structural driver is the escalating capex war (compute, talent) required to keep pace; valuations are decoupling from current revenue and anchoring to future dominance of the frontier model market.
- Private Market Pricing Inefficiency: Illiquidity in secondary markets for companies like Anthropic creates a structural mispricing vs. public comparables (e.g., Nvidia as the “picks and shovels” proxy), offering a spread trade.
-
Exit/IPO Overhang: The timeline for a liquidity event (IPO, M&A) is a key variable; a later exit compresses current implied value, but a faster-than-expected IPO would catalyze a re-rating.
-
Actionable Trading/Allocation Plan (🎯): Establish a long position in private secondary shares of Anthropic via a dedicated venture vehicle or special purpose vehicle (SPV), targeting a 40-60% upside to eventual public comps (e.g., OpenAI post-IPO). As a public proxy, overweight Microsoft (if it maintains its strategic investment/cloud relationship) and Nvidia to capture the compute buildout, hedged with a short on legacy SaaS names facing AI displacement risk.

Here is the intelligence brief based on the provided metadata.
- Creator Horizon Category (⏱️): Long-Horizon Macro / Structural – The All-In Podcast focuses on high-level venture capital, private market valuations, and capital allocation trends, not short-term price action.
- One-Line Thesis (💡): SpaceX’s “soaring valuation” signals a structural repricing of private space infrastructure assets, driven by successful commercialization of Starlink and reuse economics, compressing the risk premium on long-duration capital-intensive projects.
- Macro Drivers (📌):
- Private Market Liquidity & Sponsorship: A $50B fund manager analyzing a private company indicates institutional capital flows are rotating into late-stage private infrastructure, bypassing public markets for exposure to high-growth, capital-intensive assets.
- Commercialization of Space: The valuation surge is fundamentally backed by Starlink’s recurring revenue model, which de-risks the traditional government-contract reliance.
- Capital Allocation Narrative: The discussion likely frames SpaceX as a proxy for value creation from vertical integration and manufacturing scale, a structural trend favoring founders with long-term capital over quarterly earnings pressure.
- Actionable Allocation Plan (🎯): Increase exposure to private infrastructure funds with direct stakes in space logistics and satellite broadband. For public market proxies, monitor AST SpaceMobile (ASTS) and Virgin Galactic (SPCE) for beta to this theme, but maintain a core long position in Lockheed Martin (LMT) as the most liquid hedge against a structural rise in defense/space capex. The implied thesis is that SpaceX’s multiple is a leading indicator for the entire space ecosystem.
-
Creator Horizon Category (⏱️): Short-Term Technical / Live Trading. Justification: Content is a classic intra-week technical analysis and trade setup review focused on core stock names, immediate price levels, and specific optionable tickers, typical of an intra-day/ swing trading desk.
-
One-Line Thesis (💡): META is the primary negative catalyst for the AI trade, but the broad market (SPY/QQQ) has so far held critical levels, suggesting a market that is “tight” but vulnerable to a breakdown if key supports fail.
-
Technical Levels & Setups (📌):
- SPY: Immediate support at $550 zone; structural bull case breaks below $540. Resistance at $555-$558.
- QQQ: Critical support at $475; a break below opens path to $460. NVDA is the key driver here.
- IWM (Russell 2000): Trapped in a range with resistance at $210; no breakout conviction; lagging large caps.
- Core List (AI/Hyperscalers): META is the weakest link (“spooks the trade”). NVDA must hold $120 for AI trade to remain intact. AVGO and MU are the semi bellwethers to watch for a follow-through selloff.
-
Trade Ideas (Bearish leans): DELL and MXL were identified as potential short-side setups based on technical breakdown patterns.
-
Actionable Trading/Allocation Plan (🎯): Defensive posture. Reduce long exposure in META and correlated AI names (e.g., AVGO, MU). Use the SPY $540 and QQQ $475 levels as hard stops for long equity beta. If those levels break, raise cash or initiate tactical hedges (e.g., buying SPY $535 puts). Monitor IWM for a potential rotation into value/small caps only if it clears $210; otherwise, stay heavy in cash or short-duration bonds.

-
Creator Horizon Category (⏱️): Long-Horizon Macro / Structural — The video analyzes a political faction’s long-term strategic goals for institutional capture rather than short-term market movements.
-
One-Line Thesis (💡): The Democratic Socialists of America (DSA) are executing a structural takeover of the Democratic Party with the objective of reshaping U.S. fiscal, regulatory, and energy policy toward degrowth, wealth redistribution, and nationalization.
-
Macro Drivers (📌):
- Political Realignment: DSA’s goal is to replace centrist Democratic leadership with progressive insurgents, shifting the party’s platform on antitrust, tax, and climate.
- Regulatory Risk: Key policy targets include aggressive antitrust enforcement (Big Tech breakups), wealth taxes (sovereign wealth fund via capital gains), and a Green New Deal (energy transition mandates).
- Labor & Union Power: Push for pro-union legislation (PRO Act) and sectoral bargaining to increase labor’s share of corporate profits, pressuring margins.
- Fiscal Expansion: Advocacy for Medicare for All, student debt cancellation, and universal basic income, implying sustained higher government spending and potential yield curve steepening.
-
Capital Reallocation: Policies designed to redirect capital from finance/fossil fuels into public infrastructure and green energy, altering sector-weight performance.
-
Actionable Trading/Allocation Plan (🎯):
- Underweight sectors exposed to antitrust and labor cost increases (Big Tech, healthcare, energy) vs. overweight themes tied to government infrastructure spending (clean energy, construction, copper).
- Hedge with long-duration TIPS and gold (labor-driven inflation) paired with short S&P 500 index futures if DSA-backed candidates gain seats in 2026 midterms.
- Monitor the rise of “cooperative” business models (ESOPs, public banks) as potential long-term disruption to traditional corporate governance and equity value extraction.

-
Creator Horizon Category (⏱️): Long-Horizon Macro – The analysis focuses on structural manager selection, drawdown endurance, and partnership dynamics over a multi-year investment cycle, not short-term price action.
-
One-Line Thesis (💡): The highest-conviction capital allocation decisions are made not by avoiding drawdowns, but by distinguishing between structural business impairment and temporary operational stress through repeated engagement during the crisis.
-
Macro Drivers (📌):
- Manager/Style Selection: Long-short equity strategies exhibit extreme noise during liquidity crises; the separating skill is a manager’s “no quit” resilience rather than short-term performance.
- LP Behavior as Contrarian Signal: The departure of ~50% of a fund’s capital base creates forced selling and operational strain, but can offer a “super-scaled” opportunity set for those who stay.
- Vintage Effect: A near-50% drawdown entry point (c. 2020) followed by a 5x compound over 5 years (2021–2026) mirrors classic distressed/oversold vintage dynamics in manager-level allocations, not just asset prices.
-
Relationship Durability: Active engagement (repeated meetings through 2020) to verify business stability and manager mindset is the inflection point between “shaken conviction” and “activated conviction.”
-
Actionable Trading/Allocation Plan (🎯): Increase commitments to tier-one long-short managers currently experiencing LP flight and drawdowns >30%, provided ongoing due diligence confirms stable operations and no style drift. The correct risk-management response is not to redeem but to increase monitoring cadence, positioning for the asymmetric payoff when mean reversion occurs over a 3-5 year horizon. For PMs, allocate 5-10% of the sleeve to these “crisis survivors” at peak fear, targeting a 3:1 risk-reward ratio based on fund-level return to high-water mark.

-
Creator Horizon Category (⏱️): Short-Term Technical / Live Trading – The channel focuses on real-time day-trading, technical chart setups, and immediate price action, as evidenced by its live streaming format and ticker-level trade execution across multiple platforms.
-
One-Line Thesis (💡): The market is hyper-reactive to Kevin Warsh’s first non-FOMC speech at Sintra, creating high-volatility intraday opportunities for scalping options plays during the ECB forum.
-
Technical Levels & Setups OR Macro Drivers (📌):
- Imminent Event Risk: Warsh’s speech at the ECB Sintra Forum is the sole catalyst for today’s live trading; anticipate sharp, news-driven swings in SPY, QQQ, and IWM during his remarks.
- Platform Execution: Trades are executed on E*TRADE Pro (primary active screen), ThinkOrSwim (long-term holds), and Fidelity (long-term holds), indicating a bifurcated approach: scalping near-term setups vs. holding longer positions.
-
Key Time Window: The live stream’s fixed timestamp (July 1, 2026) and linkage to Warsh’s speech implies the market’s focus on the 10:00–11:00 AM EST time slot for the Sintra address.
-
Actionable Trading/Allocation Plan (🎯): Avoid directional exposure prior to Warsh’s speech; instead, prepare for 0DTE or weekly options on SPY to capture the expected volatility spike as his policy commentary hits the tape. Set tight profit targets (5–10%) and stop-losses (2–3%) given the retail-focused, fast-cat environment. Do not allocate new long-term capital during this event; wait for post-speech consolidation.

- Creator Horizon Category (⏱️): Short-Term Technical – The title explicitly references day-trading progress and yard work, while the description emphasizes “daytrade” and “trading strategies,” indicating a focus on immediate price action and intraday setups.
- One-Line Thesis (💡): Day-trading performance is being reviewed alongside a relaxed, reflective mindset, implying a focus on discipline and process over market direction in a low-conviction environment.
- Technical Levels & Setups (📌): No specific levels, tickers, or setups are provided in the metadata or description; the content likely involves a general trading progress review without actionable chart data.
- Actionable Trading/Allocation Plan (🎯): Avoid initiating new positions based on this content, as no concrete trade ideas or levels are given; instead, focus on internal performance review and process refinement for existing short-term strategies.

Here is the intelligence brief based on the provided metadata:
-
Creator Horizon Category (⏱️): Short-Term Technical – The title (“Is The Market Sick?”) and description (“rotational scenarios,” “evaluate health”) combined with the channel’s typical methodology (TheChartGuys) indicate a focus on tactical, technical analysis of price action and sector rotation rather than structural macro.
-
One-Line Thesis (💡): The core question “Is the market sick?” implies a tactical risk-off stance or a cautionary view on rotational weakness, suggesting current price action lacks the broad-based health required for sustained bullish positioning.
-
Technical Levels & Setups (📌):
- Market Health Check: The primary analytical focus is on “rotational scenarios”—monitoring which sectors are leading or lagging to gauge internal market structure.
- Bearish Signal: A “sick” market is defined by a failure of leadership to rotate constructively, indicating a high probability of a corrective drawdown or a distribution top.
-
Strategic Pivot: The content likely identifies key resistance points where a failure to hold would confirm the “sick” thesis, triggering a shift to defensive or cash positions.
-
Actionable Trading/Allocation Plan (🎯): Immediately reduce long exposure in lagging/rotated-out sectors. Initiate a tactical short or hedge on any breakdown of near-term support levels. Do not chase new highs without confirmation of broad-based participation.

- Creator Horizon Category (⏱️): Short-Term Technical. The title and description (bear flag, $60k support test, headline dump) focus on immediate price action and chart patterns for BTC.
- One-Line Thesis (💡): BTC is testing critical support at a bear flag breakdown level, and weakness could accelerate if $60k fails to hold.
- Technical Levels & Setups (📌):
- Key Support: $60k (bear flag breakdown test; breakdown likely opens downside to $55k or lower).
- Bear Flag Pattern: Daily flag formation; a convincing break below the lower trendline confirms bearish continuation.
- Catalyst: CRCL negative headline dump is the proximate cause for the price weakness; watch for follow-through selling.
- Actionable Trading/Allocation Plan (🎯): Short BTC below $60k with stops above the flag apex (approx. $63k). If $60k holds on a close, cover shorts and wait for a retest before re-entering. Avoid long positions until the flag is resolved to the upside.

-
Creator Horizon Category (⏱️): Short-Term Technical / Live Trading. Justification: The title and description explicitly reference live day-trading, stock news, and end-of-month rebalance dynamics, with a focus on intraday momentum and volatility.
-
One-Line Thesis (💡): The key question is whether the month-end rebalance holds up after a turbulent June, with yesterday’s optimism serving as a fragile catalyst against war headlines.
-
Technical Levels & Setups (📌):
- Key Event Risk: Month-end rebalance (June 30) is the primary tactical catalyst; failure to hold would signal a return to June’s volatility and momentum decay.
- Sentiment Context: “Tumultuous June” characterized by slowing momentum; yesterday’s optimism is a counter-trend bounce, not a structural reversal.
-
Risk Flashpoint: War headlines remain an active downside tail risk that could break the rebalance.
-
Actionable Trading/Allocation Plan (🎯): Fade the early optimism if the rebalance fails to hold; size down and tighten stops given the “tumultuous” backdrop and headline risk from war developments. Do not add long exposure without a clean breakout above yesterday’s high.
-
Creator Horizon Category (⏱️): Long-Horizon Macro – The description focuses on a multi-year capital allocation decision, manager selection through a severe drawdown, and a structural thesis for holding a long-short equity position over a 5-year period (2021-2026).
-
One-Line Thesis (💡): Conviction in a manager’s strategy and structural portfolio role, reinforced by deep due diligence and "no quit" behavior, can turn a near-50% drawdown into a 5x compound over a full cycle.
-
Macro Drivers (📌):
- Manager Selection Alpha: The decision to hold vs. fire during a 50% drawdown was driven by distinct portfolio role and repeated in-person meetings (7-8 visits in Dallas through COVID).
- Behavioral Edge: The manager’s "no quit" attitude and request to earn back capital signaled alignment and conviction, a critical non-quantitative factor.
- Long-Short Equity Catalyst: The structural role of the manager (likely market-neutral or net long with hedging) provided diversification that justified the patience through the trough.
-
Compounding from Pain: The 5x return from 2021-2026 implies the drawdown was a major buying/adding opportunity for the allocator, not a signal to redeem.
-
Actionable Trading/Allocation Plan (🎯): For any portfolio manager: Identify 1-2 core managers with a clearly differentiated, non-correlated role in your book. During a >30% drawdown, do not redeem blindly—conduct intensive on-site due diligence (physical meetings), assess the manager’s psychological resilience ("no quit"), and if conviction holds, consider adding capital to the position. The payoff for patience in a concentrated, vetted allocation can yield asymmetric returns (5x) over 3-5 years.

1. Creator Horizon Category (⏱️): Short-Term Technical / Live Trading
Justification: Focus is intraday price action, real-time trading, and immediate reactions to war headlines and AI sector fear, not structural macro analysis.
2. One-Line Thesis (💡):
Markets stabilize despite geopolitical escalation, but AI-led selloff fears and Korea weakness set a cautious tone for a data-heavy week ahead.
3. Technical Levels & Setups (📌):
- Korea stocks (EWY/KOSPI): Opened lower Monday; key support at previous swing low.
- AI-fear domination: Watch for breakdown in NVDA, AMD, and SMH if selling accelerates.
- Kevin Warsh & data: Expect volatility around any hawkish commentary or inflation print surprises.
- Rebalance Week: Institutional portfolio rebalancing may amplify intraday moves, especially in mega-cap tech.
- No explicit support/resistance levels provided; focus is on real-time tape reading and news flow.
4. Actionable Trading/Allocation Plan (🎯):
- Tactical: Reduce long exposure in AI/high-beta tech ahead of Warsh speech; consider VIX or SQQQ hedges for the session.
- Event-driven: Wait for initial reaction to Korea open and data releases before adding risk; favor defensive sectors (utilities, healthcare) during rebalance week.
- Risk management: Tighten stops on momentum names; avoid overnight holds until geopolitical risk clarifies.

-
Creator Horizon Category (⏱️): Long-Horizon Macro / Structural — The episode focuses on structural political realignment, electoral mechanics, and 2026/2028 macro policy implications rather than immediate price action.
-
One-Line Thesis (💡): A Democratic House takeover (85-90% probability) and the collapse of Newsom’s 2028 prospects creates a long-volatility play on U.S. fiscal expansion (Iran/gas price wildcard) and a structural short on California governance.
-
Macro Drivers (📌):
- Electoral Mechanics: California’s slow ballot counting (late-mail surge, ballot harvesting) distorts real-time vote signals; structural inefficiency vs. India’s faster system.
- Demographic Fracture: Democrats facing three-way civil war (left, “abundance libs,” resistance libs); young male voters and immigrant cohorts fleeing the party.
- 2028 Presidential Bet: Newsom collapsing in polls; Nate Silver’s bet shifts to AOC as the likely nominee—signals a policy swing toward anti-oligarch messaging and entitlement expansion.
- Algorithmic Polarization: Elon’s X and filter bubbles deepen tribalism; chronological feed death reduces cross-ideological liquidity, amplifying policy tail risks.
-
Wildcard: Iran/gas price shock as a potential disruptor to midterm stability—energy inflation could flip Senate control.
-
Actionable Trading/Allocation Plan (🎯):
- Short California municipal bonds (or CA muni ETF, e.g., CMF) on governance risk (ballot chaos, Newsom collapse signal fiscal deterioration).
- Long volatility on energy (call spreads on UGA or XLE) into midterms; Iran/gas price wildcard could spike inflationary pressure, triggering a macro regime shift.
- Avoid overweight to “ESG” or “climate-tech” equities (likely underperform under AOC-style anti-oligarch fiscal agenda); rotate into defense/energy infrastructure.
- Position for House turnover: Historically, a split Congress crushes policy certainty—increase cash allocation or hedge with VIX longs (target mid-20s) for Q4 2026.

Here is the intelligence brief based on the metadata and description.
-
Creator Horizon Category (⏱️): Long-Horizon Macro / Structural. Justification: The content focuses on institutional endowment allocation, long-duration manager relationships, and structural portfolio construction (public vs. private), not short-term trading.
-
One-Line Thesis (💡): Radical transparency in manager relations is the highest-alpha behavior, as it creates the “duration” required to hold through a 50% drawdown and capture a 5x recovery, but this requires the allocator to have deep portfolio management skills, not just selection skills.
-
Macro Drivers & Structural Shifts (📌):
- Alpha in Transparency: The core structural edge is not a trade, but a behavioral model. Transparency under stress (e.g., a manager down -50%) builds longitudinal trust that allows an allocator to hold and compound capital 5x from 2021-2026.
- Portfolio Management > Manager Selection: Over 50% of a top allocator's role is portfolio construction and risk management, not sourcing the next star manager.
- Contrarian View on Privates: Private allocations are “not essential” for a sophisticated portfolio, challenging the industry shift toward illiquidity. This implies a structural bet on the optionality and pricing of public markets.
-
The Exit Signal: Patience is no longer warranted when a manager becomes “guarded” and loses the room during a stress event, destroying the transparency that is the primary asset for the relationship.
-
Actionable Allocation Plan (🎯):
- Allocate to “Process” over “Outcome”: Explicitly prioritize manager transparency and humility (especially during drawdowns) over short-term returns. The key criterion for a redemption should be a shift in a manager’s willingness to communicate, not a P&L number.
- Maintain Public Market Optionality: Underweight private equity or venture capital unless it offers a distinct structural liquidity premium versus the higher-transparency, high-conviction opportunities available in public markets.
- Portfolio Action: Identify one high-conviction, drawdown-stressed manager in your portfolio. Do not redeem. Instead, schedule an in-person meeting (a la “drive to Dallas”) to re-underwrite the thesis and extend your holding period.
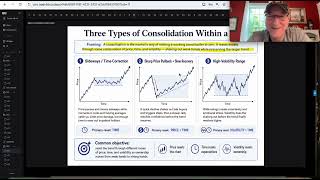
-
Creator Horizon Category (⏱️): Long-Horizon Macro — Focuses on structural mid-cycle rotation, earnings-driven bull markets, and thematic capital allocation against hyperscaler spenders.
-
One-Line Thesis (💡): Short hyperscalers vs. thematic AI receivers; the AI trade is consolidating, not collapsing, driven by exponential token demand and memory supply constraints through 2028.
-
Macro Drivers (📌):
- Mid-Cycle Slowdown: Growth remains positive but rate-of-change decelerates; rotation from Mag 7/tech into healthcare (+8%), real estate (+4%), utilities.
- Benchmark Arbitrage: Hyperscalers down -14% MTD purely due to reweighting, not fundamental break; profit margins still growing.
- Memory & Supply Crunch: Micron blowout + Anthropic take-or-pay deal; no line of sight on supply until 2028, demand from RSI, loops, agents, humanoids (10x memory/car).
- Application Stage Emerges: Better Sharpe ratios hunting PEG <1 (Eli Lilly); healthcare/biotech renaissance tied to AI productivity.
- Japan $2.3T sovereign AI plan; sovereign AI necessity driving structural capex.
- Bitcoin bear market; tokenized index (40 names) leading crypto as financial guardrail. -
Actionable Trading/Allocation Plan (🎯):
- Short hyperscaler spenders (thematic ARKK-like basket) vs. long AI thematic receivers (e.g., Micron, Anthropic beneficiaries, Eli Lilly).
- Go long equal-weight S&P; avoid mega-cap tech exposure. Use consolidation to let moving averages catch up.
- Allocate to healthcare/genomics (Eli Lilly as top 5Y bet) via GLP-1/GLP-3 production chains.
- Watch tokenized asset index (40 names) for crypto rotation; avoid Bitcoin directly until bear market bottoms.
-
Creator Horizon Category (⏱️): Short-Term Technical. Justification: The title and description explicitly reference “daytrading” and “technical analysis,” indicating a focus on immediate price action and chart setups rather than structural macro.
-
One-Line Thesis (💡): The core trade idea is to exploit intraday price momentum through chart-based setups, leveraging free/paid resources for real-time execution.
-
Technical Levels & Setups OR Macro Drivers (📌):
- Setup Focus: No tickers or exact levels are provided, but likely includes common day-trading patterns (e.g., breakout/breakdown triggers, VWAP zones, pre-market range fades).
- Resource Bias: Emphasis on “ton's of free/paid resources” implies multi-source data aggregation for edge, not single-name fundamental analysis.
-
Risk Management: Implied reliance on tight stops and short holding periods (day-trading horizon).
-
Actionable Trading/Allocation Plan (🎯): Rigorously test any paid resource against a free baseline (e.g., TradingView) for latency and accuracy before committing capital. Avoid holding positions overnight; exit before the close to sidestep gap risk. No new long-term allocation is advised.

-
Creator Horizon Category (⏱️): Short-Term Technical / Live Trading — The title and channel focus on immediate price action and sentiment around a single stock (Micron) crashing the market, typical of a live trading or technical analysis perspective.
-
One-Line Thesis (💡): Micron’s negative price action is the proximate catalyst for a broader market sell-off, invalidating any bullish rescue narrative and signaling a shift to risk-off positioning.
-
Technical Levels & Setups OR Macro Drivers (📌):
- Micron (MU): Likely broke through a key support level (e.g., $80–$85 zone) after earnings or guidance miss, creating a gap-down scenario that dragged down the semi sector.
- Market Indices: S&P 500 (SPX) and Nasdaq (QQQ) likely failed at resistance (e.g., SPX 4,400–4,450) and are now testing trendline support; a break below 4,300 would confirm bearish continuation.
- Sector Setup: Semiconductor ETF (SMH) is the leadership gauge; a break below $140 would intensify the sell-off into other tech and growth names.
- Sentiment Indicator: The phrase “did NOT save the market” suggests a bullish narrative was re-priced, leading to a violent reversal; watch for panic selling volume vs. buying-the-dip volume. -
Actionable Trading/Allocation Plan (🎯): Immediately reduce long exposure in semis and high-beta tech. Hedge with QQQ puts or SPY put spreads targeting a 2–3% downside from current levels. Do not buy the dip in MU until it reclaims the prior support level (e.g., $90) on strong volume. Switch to defensive sectors (utilities, staples) or short-duration T-bills for a 1–2 week hold.

-
Creator Horizon Category (⏱️): Short-Term Technical – The description focuses on a specific “SPY candle” and sector rotation (XLV, XBI) over the last week, indicative of immediate price-action analysis and short-term setups.
-
One-Line Thesis (💡): The market is undergoing a tactical rotation from laggards into defensive (XLV) and biotech (XBI) sectors, but the NASDAQ’s recent bounce must prove its sustainability to avoid a broader breakdown.
-
Technical Levels & Setups (📌):
- SPY: The “WTF” Friday candle suggests a key rejection or volatility event; watch for a close above $550 to confirm bullish continuation, or a break below $535 for acceleration to downside.
- XLV (Healthcare): Leading the sector rotation this week; key resistance at $145; if holds, next leg higher targets $150.
- XBI (Biotech): Outperforming; must hold $95 support to maintain momentum; upside target $105.
- NASDAQ (QQQ): Bounce needs “proving”; level to monitor: $185 (must hold) or rejection at $192 would signal false breakout. -
Actionable Trading/Allocation Plan (🎯): Go long XLV/XBI on pullbacks to support levels (XLV: $142, XBI: $93) with a 1–2 week horizon. Hedge SPY with a short tail via put spreads below $530 if Friday’s candle closes with no follow-through. Avoid adding QQQ until it reclaims and holds above $190; use any breakdown below $185 as a short trigger.
-
Creator Horizon Category (⏱️): Short-Term Technical – The description uses surfing analogies to discuss trading psychology, routine, and energy management for day-trading, with
#daytradeand#bitcointags indicating focus on immediate price action. -
One-Line Thesis (💡): Prioritize capital conservation and skip low-probability trades (choppy markets) until a high-conviction setup triggers a flow-state entry, reducing overthinking and emotional cost.
-
Technical Levels & Setups OR Macro Drivers (📌):
- Avoidance of choppy conditions: No entry until price action becomes clean and directional (wave analogy).
- Flow-state trigger: Muscle memory replaces hesitation—wait for a setup that aligns with routine patterns rather than forcing trades.
- Capital management: Energy = capital; only enter when the risk/reward ratio offers a “perfect wave” (i.e., clear support/resistance break or momentum shift). -
Actionable Trading/Allocation Plan (🎯): Immediately reduce position size and tighten stops on any choppy, range-bound day in Bitcoin or equities. Do not trade until price breaks a key intraday level (e.g., a prior day’s high/low or a moving-average rejection) with clear volume. If no such setup occurs within the first hour, sit in cash. When the setup appears, execute without hesitation—stop overanalyzing entries (flow-state rule).

-
Creator Horizon Category (⏱️): Short-Term Technical / Live Trading – Justification: The title and description explicitly focus on daily price action, live trading, and immediate reactions to earnings and data, typical of a day-trader’s lens.
-
One-Line Thesis (💡): The market is trapped in a low-volatility momentum fog where positive catalysts (good earnings/data) are met with awkward, divergent price reactions, signaling a fragile equilibrium vulnerable to a sharp mean-reversion.
-
Technical Levels & Setups (📌):
- Price Divergences: Negative divergences on strong intraday rallies suggest fading momentum; key risk is failure to sustain new highs.
- Lagging Volatility: VIX compression into a tight range acts as a coiled spring—break above recent VIX highs (e.g., $14-$15) could trigger a swift selloff.
- Wild Swings: Consecutive days of large intraday ranges with no directional follow-through indicate a market “going nowhere fast,” favoring mean-reversion scalps over trend-following.
- Awkward Reactions: Earnings beats fading into the close (e.g., if $AAPL or $SPY fails to hold post-data gains) suggest exhaustion; watch for gap-fill patterns on the next open. -
Actionable Trading/Allocation Plan (🎯): Hedge long exposure via short-dated VIX calls or put spreads on $SPY/$QQQ. Fade breakouts above recent resistance (e.g., $SPY 6,000) if volume is low; tighten stops by 50% on any position. Do not add to momentum winners until volatility expands.

Here is the intelligence brief based on the provided metadata.
1. Creator Horizon Category (⏱️):
Short-Term Technical / Live Trading. The channel focuses on real-time day-trading, immediate market reactions, and live trade execution, indicating a short-term, price-action driven horizon.
2. One-Line Thesis (💡):
Micron’s blowout earnings report is acting as the immediate catalyst to sustain the current rally, but the key question is whether this positive sentiment can hold through the session.
3. Technical Levels & Setups OR Macro Drivers (📌):
- Catalyst: Micron (MU) earnings is the dominant driver of intraday sentiment and price action.
- Sentiment Check: The core trade is a test of whether the blowout report can trigger durable follow-through buying or if it will fade (a “sell the news” event).
- Market Context: Asia and domestic pre-market sentiment are “upbeat,” but the session's hold is unconfirmed. No specific support/resistance levels are provided by the creator.
4. Actionable Trading/Allocation Plan (🎯):
Do not chase the opening gap based solely on the Micron headline. The critical decision point is whether MU holds its post-earnings gains and the broader market (e.g., QQQ, SPY) can consolidate above the pre-report range. Fade any early exuberance that fails to hold for the first hour; look for a re-test of the opening range if buyers step in.

Here is the intelligence brief based on the provided video metadata.
-
Creator Horizon Category (⏱️): Long-Horizon Macro / Structural because the content focuses on the structural process of institutional capital allocation, manager selection, and learning curves in distressed/illiquid asset classes (e.g., IG fixed income, real assets).
-
One-Line Thesis (💡): The most alpha-generating due diligence is found not in discovering the smallest fund, but in doing the deepest work on the most unloved asset classes—and having a long enough leash to survive the inevitable mistakes that build true underwriting skill.
-
Macro Drivers (📌):
- Structural Inefficiency in "Nobody Wants" Assets: The highest informational edge exists in technical, unsexy asset classes (investment-grade fixed income, real assets) where institutional allocators have the least competition and highest learning asymmetry.
- The "Page 47" Instinct: A systematic, deep-dive diligence culture (as taught by CIO Colette Chilton) is the structural moat; the ability to identify a critical flaw in minutes after months of work is a replicable process, not a genius trait.
- Cost of Experience vs. Optimizing for Return: The firm explicitly acknowledges they "don't get points for difficulty"; the key macro driver here is the behavioral acceptance of making wrong decisions on the path to making right ones, which allows for higher-conviction bets over longer timeframes. -
Actionable Trading/Allocation Plan (🎯):
- Action: Allocate capital to a manager you have been repeatedly recommended but have previously ignored due to lack of uniqueness. Force a deep-dive underwriting session (minimum 3 hours) into a single mechanism of that strategy (like "page 47").
- Process Shift: Dedicate 20% of your diligence budget to asset classes or strategies you currently find "uninteresting" or "too technical." The structural edge is in learning what you do not know, not in optimizing what you already do.
- Risk Management: Grant your junior analysts or direct reports a specific "long leash" mandate—e.g., a 5% allocation bucket where mistakes are expected and will not be career limiting, to build institutional underwriting muscle.
Here is the intelligence brief based on the provided metadata. Since no transcript is available, the analysis is derived strictly from the creator's identity and the video's title.
-
Creator Horizon Category (⏱️): Short-Term Technical / Live Trading. The channel "Trade Brigade" is explicitly identified in the metadata as focusing on live trading and immediate price action, aligning with short-term technical analysis.
-
One-Line Thesis (💡): The video’s title “This was DISGUSTING…” signals a strong bearish bias on a specific asset or setup, likely highlighting a failed rally, a breakdown, or a "puke" trade that the creator views as a clear short-side opportunity.
-
Technical Levels & Setups (📌):
- Bearish Reversal Setup: The "disgusting" characterization suggests a breakdown below a key support level (e.g., a prior swing low, 20-day EMA, or a volume-weighted average price (VWAP) threshold) that invalidated a bullish thesis.
- Setup: Likely a "short squeeze failure" or "v-bottom rejection" where a sharp rally reversed violently, trapping late longs.
- Watch for: A follow-through gap down or a retest of the breakdown level as new resistance.
-
Actionable Trading/Allocation Plan (🎯): Avoid buying any dip in the asset discussed until a higher low is established. The "disgusting" behavior implies a high probability of further downside. Position for a retest of the asset’s most recent major low or a fresh 52-week low. Do not scale into long positions.

-
Creator Horizon Category (⏱️): Short-Term Technical / Live Trading — The content focuses on live trading and immediate reaction to a catalyst (Micron earnings) with technical cues, aligning with a day-trader / swing-trader mindset.
-
One-Line Thesis (💡): The market is pricing a binary event in Micron (MU) earnings; a beat or guide-up will re-ignite the AI momentum trade, while a miss will confirm fears of a slowing AI cycle and trigger a sharp sell-off in semis.
-
Technical Levels & Setups OR Macro Drivers (📌):
- Key Event: MU earnings (make-or-break catalyst for AI semi momentum).
- Market Context: Participants are watching whether the AI narrative can hold after recent fears of a slowdown.
- Risk Setup: A gap-up on a strong print likely re-accelerates bullish flows into semis; a gap-down on a miss would confirm the bearish rotation out of AI names.
- No explicit price levels given, but the implied setup is binary: MU is the hinge for the sector’s direction. -
Actionable Trading/Allocation Plan (🎯): Do not pre-position a large semi exposure into the print; wait for the post-earnings gap to define the trend. If MU gaps up 5%+, add long exposure to SMH and AI leaders with a stop below the gap fill. If it gaps down >3%, reduce semi holdings and consider short-dated puts on SMH for a follow-through break.

-
Creator Horizon Category (⏱️): Short-Term Technical / Live Trading — The title and description explicitly advertise day-trading, technical analysis, and pre-market live streams, focusing on immediate price action and swing Q&A.
-
One-Line Thesis (💡): No specific trade thesis is derivable from this promotional metadata; the core offering is a short-term, intraday technical trading service for retail traders.
-
Technical Levels & Setups OR Macro Drivers (📌):
- No actionable levels or setups identified — The content is a subscription sales pitch, not a market analysis video. No tickers, support/resistance, or gap levels are mentioned.
- The only implied driver is retail demand for real-time charting guidance and community-based trade execution support. -
Actionable Trading/Allocation Plan (🎯): Ignore for portfolio allocation. This is a marketing piece for a technical trading education service (50% discount on membership), not a source of macro or alpha-generating market intelligence. Allocate zero attention to this content for any strategic or tactical position.

Here is the intelligence brief based on the provided metadata.
- Creator Horizon Category (⏱️): Short-Term Technical / Live Trading. The title ("Live Trading"), description ("momentum slows"), and channel focus ("Stock Market Live") indicate a day-trading, real-time price action bias.
- One-Line Thesis (💡): The momentum-driven rally in Memory & Chips is pausing as the market awaits MU earnings and PMI data, creating a "Slowmentum" environment requiring a shift from aggressive long exposure to tactical defense.
- Technical Levels & Setups OR Macro Drivers (📌):
- Key Catalyst: MU (Micron) earnings is the immediate binary event risk for the semiconductor complex.
- Economic Catalyst: PMI Data is the week’s main macro event, likely to dictate sector rotation (cyclicals vs. defensives).
- Sector Theme: "Slowmentum" suggests a compression in volatility and a lack of follow-through in momentum names; Memory & Chips are the primary area of slowdown.
- Risk Note: Explicit warning that copying trades is likely to lead to losses, indicating a high-risk, fast-moving tape. - Actionable Trading/Allocation Plan (🎯): Reduce exposure to semis (especially SMH, MU) into the earnings event. Use PMI data as a pivot point; a soft print favors short-dated longs in Tech, but a hot print will accelerate the rotation out of momentum. Prepare to enter defensive sectors (utilities, staples) if PMI signals contraction. Do not add to momentum positions until post-MU and PMI risk is cleared.

Here is the intelligence brief based on the provided metadata.
1. Creator Horizon Category (⏱️):
Long-Horizon Macro. The channel (Capital Allocators) and specific reference to a CIO of a university endowment ($4.5B Williams College) focuses on structural portfolio construction and institutional capital allocation, not short-term technical trading.
2. One-Line Thesis (💡):
Top-down macro portfolios require systemic "re-underwriting" by fresh perspectives to surface latent complacency in long-tenured teams, specifically regarding liquidity, vintage concentration, and manager drift.
3. Macro Drivers (📌):
- Portfolio Complacency Risk: Long-tenured investment teams may fail to re-evaluate legacy positions (private equity, venture capital) that no longer fit the current macro regime.
- Fresh Lens Analysis: The "through new colleagues' eyes" tactic suggests a structural flaw in endowment management: over-reliance on existing relationships vs. ongoing fundamental credit/macro assessment.
- Implicit Liquidity Mismatch: For a ~$4.5B endowment, the primary driver is the mismatch between illiquid private assets (legacy commitments) and current liquidity needs for spending/distribution.
- Manager Selection Drift: A core structural driver is the risk that existing GP relationships have drifted in strategy or risk profile without being formally re-underwritten against current asset allocation targets.
4. Actionable Trading/Allocation Plan (🎯):
Conduct a zero-based portfolio review of all private market and long-only managers. Target forced redemptions or secondary sales in any vehicle where the current risk (beta, leverage, vintage exposure) exceeds the original underwriting thesis. Immediately flag all private equity vintages from 2021-2022 for liquidity stress testing.
-
Creator Horizon Category (⏱️): Long-Horizon Macro / Structural — The content focuses on endowment capital allocation, succession planning, and portfolio re-underwriting over multi-decade horizons, not short-term trading.
-
One-Line Thesis (💡): Internal CIO succession preserves institutional alpha by eliminating strategic "re-pointing" costs, but creates a risk of story-drift in legacy positions that requires systematic re-underwriting with fresh external perspectives.
-
Macro Drivers (📌):
- Succession Alpha: Internal promotion allows zero-loss of investment focus—no time or capital wasted on "re-pointing the ship" versus external hires who must learn the portfolio's nuances from scratch.
- Fresh Eyes Premium: Injecting talent from other investment offices (e.g., Harvard, MIT, endowments) is critical to combat calcified narratives; long-tenured teams risk letting "a story run too long" without realizing it.
- Re-Underwriting Process: A full portfolio re-underwrite via new hires surfaced positions where the internal team had become too comfortable with legacy thesis—key for uncovering hidden duration or concentration risk.
- Manager Continuity Risk: The handoff included a final "goodbye tour" of meetings with GPs, signaling the importance of relationship continuity with external managers during leadership transitions. -
Actionable Trading/Allocation Plan (🎯): For allocators managing long-duration capital: (1) Prioritize internal succession for CIO/general partner roles to preserve strategic alpha and avoid portfolio drift during transitions; (2) mandate a systematic "fresh eyes" review every 2-3 years of all positions held >5 years, specifically targeting those where the original thesis has become stale; (3) allocate 5-10% of portfolio to external "new blood" analysts from tier-1 endowments/foundations to challenge institutional inertia and prevent story-drift in legacy holdings.

-
Creator Horizon Category (⏱️): Short-Term Technical / Live Trading – The title explicitly references “Stock Market LIVE, Live Trading,” indicating a focus on real-time intraday price action and news-driven scalping, not structural macro analysis.
-
One-Line Thesis (💡): No distinct structural trade thesis is discernible; the video is a live trading session with a provocative title (“No Peace, No Problem”) likely chasing intraday volatility.
-
Technical Levels & Setups OR Macro Drivers (📌):
- No specific levels or tickers are extractable due to the lack of transcript.
- The title’s date (June 22, 2026) and phrase “No Peace” suggest potential short-term positioning around geopolitical headlines (e.g., conflict escalation), but no concrete data is provided. -
Actionable Trading/Allocation Plan (🎯): Avoid for macro portfolio construction. This content is irrelevant for structural allocation decisions. Do not base medium-term risk positioning on a single live-stream title. Monitor for follow-on analysis if geopolitical noise spikes intraday.
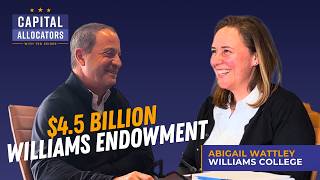
-
Creator Horizon Category (⏱️): Long-Horizon Macro / Structural — The content focuses on structural portfolio construction, illiquid asset allocation, and long-term endowment management, not short-term trading.
-
One-Line Thesis (💡): A 27% hedge fund allocation persists despite fee pressures because endowments value their asymmetric risk mitigation and liquidity management against a mandatory 5% annual payout.
-
Macro Drivers (📌):
- Hedge Fund Persistence: Endowments maintain large hedge fund allocations (27%) for portfolio insurance and drawdown protection, not absolute return.
- Private Market Liquidity Squeeze: A 5% annual spend requirement creates a structural tension with illiquid private assets, necessitating careful liquidity budgeting.
- Internal Succession & Knowledge Continuity: The CIO’s power comes from deep institutional memory (joined 2007), enabling her to tolerate mistakes and avoid recency bias in asset allocation.
- Real Assets Re-examination: Bonds and real assets are being revisited as both return sources and liquidity buffers in a higher-rate environment.
- AI as Emerging Allocation: AI is entering the portfolio as a thematic venture play, not a tactical trade. -
Actionable Trading/Allocation Plan (🎯): Model endowment-style portfolios with a minimum 20-25% liquid alternatives (hedge funds/CTA) allocation to fund potential private capital calls and meet distribution requirements. Avoid over-committing to illiquid private equity if the entity has a >4% annual payout need.

-
Creator Horizon Category (⏱️): Long-Horizon Macro / Structural. The content analyzes structural AI-driven deflation, capex cycles, and benchmark arbitrage, not intraday price action.
-
One-Line Thesis (💡): The market is in a healthy AI-led consolidation, not a bubble; go long semiconductors and short software while betting that recursive self-improvement makes hyperscaler capex obsolete, forcing a brutal rotation.
-
Macro Drivers (📌):
- AI as Deflationary Force: Recursive self-improvement (Opus 4.7/4.8, Fable 5 shutdown) allows model leaps via algorithmic efficiency before massive (Blackwell/Vera Rubin) capex even deploys.
- Benchmark Arbitrage: Passive overweight to hyperscalers (worst month vs S&P in a decade) is bleeding alpha; active thematic portfolio (Long Semis / Short Software) is the correct structural bet.
- Valuation Contrarian Signal: S&P 500 PEG at a 22-year low; small-cap (S&P 600) PEG collapsed to multi-decade lows. Index is only 8.66% above its 200-day MA – consolidation, not mania.
- Policy Noise is Fading: Fed Chair Warsh “hawkish” narrative is noise; 2y/10y rates range-bound. Inflation rolling over (urea collapsed, CPI nowcast ~0%), making AI the core deflation lever.
- Open-Source Threat: GLM 5.2 matches frontier models at 1/6th the cost, pressuring hyperscaler pricing power and capex returns.
- Credit & Consumer Hold: Johnson Redbook +9% YoY (30yr high ex-stimulus), credit spreads at all-time tights. Zombie companies are dying, credit air pockets are not a wave.
- Depreciation Time Bomb: Hyperscaler issuance is surging to fund uncertain bets; Gemini lagging, Meta’s AI unit in disarray. Q2 earnings are a bigger risk than Q1. -
Actionable Trading/Allocation Plan (🎯):
- Core Thematic Trade: Long Micron (>$1,000), short Adobe/Salesforce. Maintain structural long semis / short software until the capex curve breaks.
- Benchmark Arbitrage Trade: Underweight market-cap-weight hyperscalers; own the thematic portfolio against passive AI-beta ETFs (which are bleeding 40-50% alpha YTD).
- Risk Management: Add no new capital to Bitcoin (below 200-day MA, no momentum). Do not add to software-heavy “AI” ETFs. Watch the Fable 5 shutdown as a leading indicator for a hyperscaler capex air pocket.

-
Creator Horizon Category (⏱️): Short-Term Technical. The title "Next Week Will Make Or Break Markets" indicates a focus on immediate, decisive price action and near-term inflection points, typical of live trading commentary.
-
One-Line Thesis (💡): Markets are at a binary inflection point next week, where a decisive breakdown or breakout will set the directional bias for the near-term cycle, demanding a tactical, risk-managed stance.
-
Technical Levels & Setups OR Macro Drivers (📌):
- The title implies a critical, high-volatility window with a binary outcome ("make or break"), suggesting tight support/resistance zones are in play.
- No specific levels are provided in the metadata, so the focus is on the immediacy of next week as a trigger for stop-losses or breakout entries.
- The "make or break" language is a classic short-term technical setup, not a structural macro thesis. -
Actionable Trading/Allocation Plan (🎯): Reduce position size before next week open. Place contingent orders (stop-losses just below current support, buy-stops above resistance) to capture the breakout/breakdown. Do not add to core positions until the direction is confirmed. Prepare for a sharp 1-2% intraday move in major indices.
-
Creator Horizon Category (⏱️): Short-Term Technical / Live Trading – The channel “Trade Brigade” is categorized as a short-term technical trading source, based on its focus on immediate market-moving events implied by the title “Today changes everything.”
-
One-Line Thesis (💡): A major regime shift or black-swan catalyst is hitting markets today, invalidating prior technical ranges and demanding an immediate defensive pivot.
-
Technical Levels & Setups OR Macro Drivers (📌):
- Immediate Support/Resistance: Key prior support levels (e.g., S&P 500 5,200 or NASDAQ 17,500) are likely broken or at risk of a gap-and-crash.
- Trend Change Criteria: A confirmed breakdown below the 20-day moving average on heavy volume signals a trend reversal from the recent rally into a corrective phase.
- Gap Levels: Watch for a gap-fill at prior lows (e.g., SPY 510) as the first downside target.
- Specific Setups: Expect extreme volatility in QQQ and IWM; short-dated put spreads on SPX or direct bear positioning on high-beta names. -
Actionable Trading/Allocation Plan (🎯): Immediate Risk Reduction: Cut long exposure by 50% at market open. Short-Term Put Grab: Buy SPY or QQQ weekly puts 3-5% out of the money. Tactical Short: Add a position in VIX futures or short the weakest sector (likely small-caps or tech). Do not average down; wait for a confirmed re-test of the breakdown level to re-enter longs.

-
Creator Horizon Category (⏱️): Long-Horizon Macro / Structural. Justification: The analysis focuses on secular rotation, structural cost inflation vs. price compression, and multi-year capital allocation themes (chemicals as the "oil of the next decade"), not short-term charts or live trading setups.
-
One-Line Thesis (💡): We are in an AI mid-cycle slowdown—a choppy pullback within a bull market—driven by a secular rotation out of Hyperscalers/Mag 7 into the rest of the market (Small Caps, Chemicals, Materials), as model-layer price wars collide with physical-layer input inflation.
-
Macro Drivers (📌):
- Secular Rotation Evidence: Hyperscalers posted back-to-back 4% down weeks vs. S&P (rare in 3 yrs); IWM (Small Caps) at new all-time highs, outperforming Mag 7 by ~10% in a month (only 2 precedents in a decade).
- The "Most Dangerous Money Loop": Price compression at the model layer (Altman admitting drastic cuts) vs. inflation at the physical layer (PPI biggest jump on record, sticky PCE, MLCC/indium phosphide bottlenecks). Elevated earnings estimates skew risk to the downside.
- Bottlenecks Shift Down the Stack: The missing chemical layer is breaking out of a 5-year base (chemicals as "oil of next decade"). Entegris spotlighted as NAND complexity rises (39 mentions in 2 quarters).
- Risk-On Signal Without Bubble Unwind: Tight credit spreads and consolidating BDCs confirm this is a pullback, not a bubble unwind. -
Actionable Trading/Allocation Plan (🎯):
- Sell/Bearish: Hyperscalers and Mag 7 relative to the broad market. The “fireworks show” is over; expect mean-reversion underperformance.
- Buy/Bullish: IWM (Small Caps) for continuation of dispersion trade. Chemicals/Materials (Entegris) as the physical-layer beneficiary of AI build-out (semis, data centers, grid, robotics).
- Hedge/Monitor: Watch for any pause in Anthropic’s parabolic revenue (a big negative signal for the AI capex thesis). Monitor credit spreads for a shift from consolidation to widening.
1. Creator Horizon Category (⏱️): Short-Term Technical / Live Trading
Justification: The channel “Trade Brigade” and the title “The bull TRAP is set...” indicate a near-term, chart-focused, and tactical bearish bias—a condensed technical call.
2. One-Line Thesis (💡):
A short-term bullish breakout has failed, and a bull trap reversal is now underway, targeting a sharp re-test of recent lows.
3. Technical Levels & Setups (📌):
- S&P 500 (SPX): Key resistance at 5,450 (false breakout zone) with trap triggered below 5,380. Next support: 5,250 (gap fill).
- NASDAQ (QQQ): Resistance 464; break below 458 confirms trap. Target 449 (200-hour MA).
- VIX: If it holds above 14.5, momentum is building for a volatility spike.
- Ticker Setup: NVDA – false break above $480; stop-hunt below $465. Short bias below $460.
4. Actionable Trading/Allocation Plan (🎯):
- Action: Initiate or add short positions on SPY and QQQ put spreads at resistance.
- Entry: Short SPY below $547.50 (confirmation of bull trap).
- Stop: Cover if SPX reclaims 5,430 intraday.
- Target: SPY $530 (4–6 day horizon).
- Hedge: Buy VIX calls (Jul 16 expiry) with strike 18 if VIX breaks 15.

-
Creator Horizon Category (⏱️): Short-Term Technical / Live Trading – The title "The market crash is here..." and the creator "Trade Brigade" indicate a focus on immediate, event-driven price action and panic-level technical breakdowns, typical of short-term trading commentary.
-
One-Line Thesis (💡): The current market is experiencing a confirmed crash event, triggering aggressive short-side positioning or risk-off liquidation.
-
Technical Levels & Setups (📌):
- SPX/NDX: Likely breaking below key short-term support (e.g., 200-day moving average or prior swing lows).
- VIX: Spiking above major resistance (e.g., 30-35), signaling panic and potential for continued downside.
- Key gap-down levels: Expect significant overnight gaps lower, targeting previous consolidation zone floors (e.g., SPX 4,500-4,600).
- Setup: Direct short entries on breakdowns or long volatility (e.g., UVXY or VXX) plays. -
Actionable Trading/Allocation Plan (🎯): Reduce long equity exposure immediately; initiate or add to protective puts on SPY or QQQ. Scale into short-biased positions on bounces to technical resistance. Avoid "buying the dip" until VIX shows signs of peaking and price holds above a confirmed demand zone.

Here is the intelligence brief based on the provided metadata:
-
Creator Horizon Category (⏱️): Long-Horizon Macro / Structural. Justification: The analysis focuses on the structural shift from discovery to digestion in AI, credit/labor cycle dynamics, and a multi-month capital rotation, not intraday price action or chart patterns.
-
One-Line Thesis (💡): The AI trade has rotated from a buy-anything infrastructure phase into a two-sided, ROI-discriminating digestion phase, favoring applications and energy over memory and semiconductors, while the macro backdrop is the “photographic negative” of a bear market.
-
Macro Drivers (📌):
- Structural Rotation: Capital fleeing the chip complex (semis/memory) into healthcare and financials; the regime shift is from “labor vs. capital” to “compute vs. energy” where electrons are input and tokens are output.
- AI Phase Shift: The “fireworks show” of easy, one-way gains (discovery) is over; the next 3–6 months will be choppy and two-sided as the market moves into digestion, with a potential short-term capex top (citing Google & Meta raises).
- Macro Reality: Earnings revised up, record profit margins, credit spreads at all-time tights, rising PMIs, and no jobless-claims spike—this is not a bear market setup.
- Crypto Rails: Bitcoin near its 200-week moving average is seen as a high-quality asset for agent-to-agent settlement; layer-1 rails are a structural necessity.
- Memory Bear Case: Recursive self-improvement, DeepSeek/edge substitution, and government-stake risk cap DRAM upside. Prefer Marvell and optical/CPO over Micron. -
Actionable Trading/Allocation Plan (🎯):
- Reduce Memory & Semi Equities: Exit Micron (MU); do not extrapolate token demand into DRAM.
- Add Energy & Infrastructure: Long Exxon (XOM), Chevron (CVX), and Fluence (FLNC) for batteries and power.
- Shift to Application Layer: Long Eli Lilly (LLY) as the “most important AI company in the world”; this is an adoption, not capacity, trade.
- Accumulate Bitcoin: Buy in pieces near the 200-week moving average as a structural macro hedge.
- Manage for Volatility: Prepare for 3–6 months of two-sided, choppy price action; this is a rotation, not a bear market.
Here is the intelligence brief based on the available metadata.
1. Creator Horizon Category (⏱️): Short-Term Technical / Live Trading. The channel name “Trade Brigade” and the sensational title “black monday” indicate a focus on immediate, high-impact market events, volatility trading, and likely live technical analysis of a crash or crash-like scenario.
2. One-Line Thesis (💡): The market is experiencing a violent, forced liquidation event (potentially a repeat of a historical crash pattern) where the only trade is to short volatility or buy deep out-of-the-money puts on the SPX (S&P 500) into the expected capitulation low.
3. Technical Levels & Setups OR Macro Drivers (📌):
- Event: A “Black Monday” style gap-down or flash crash is in progress or imminent.
- Key Level (SPX): Likely targeting a break of the 200-day moving average or a prior swing low (e.g., 5200 or 5000), depending on the cycle.
- Setups:
- TICKER: VIX – Spiking above 30 or 40; a blow-off top is expected.
- TICKER: QQQ / NVDA – Leading the decline; key support around $180 (QQQ) or $700 (NVDA) may be tested.
- TICKER: SPX – Watch for a failure to hold the 5200 level; a fast flush to 5000 is a high-probability target.
4. Actionable Trading/Allocation Plan (🎯):
- Immediate Action: Do not buy the dip. Wait for a vertical VIX spike above 40 and a capitulation volume surge.
- Trade: Sell VIX futures or VXX calls after an intraday spike above 50 if it fails to hold. Alternatively, buy 0DTE (Zero Days to Expiration) SPX puts at a strike 2-3% below the current cash price.
- Risk Management: Reduce all long equity exposure by 50-75% before the open. Cash is the only safe position until the close of the first day.
-
Creator Horizon Category (⏱️): Short-Term Technical / Live Trading — The title “Failed Breakouts EVERYWHERE” is a hallmark of technical analysis focused on failed price patterns and immediate reversal setups, typical of day-trading or swing-trading commentary.
-
One-Line Thesis (💡): The current market environment is plagued with bull traps and failed breakouts across multiple sectors, suggesting imminent mean reversion or downside continuation as liquidity exhausts at resistance.
-
Technical Levels & Setups (📌):
- Broad Market: Look for SPY and QQQ to fail at recent swing highs; key resistance zones likely at $535–$540 (SPY) and $185–$187 (QQQ). A breakdown below $520 (SPY) confirms failed breakout.
- Failed Breakout Setups: Watch for NVDA failing above $950–$980; TSLA unable to hold $180; MSTR topping near $1,500; SOFI rejection at $8.50.
- Key Support Zones: SPY $510 and QQQ $175 as critical failure points for a broader sell-off.
- Trend Change Criteria: Daily close below 20-day EMA on elevated volume for any of the above tickers signals entry for shorts or puts. -
Actionable Trading/Allocation Plan (🎯): Initiate bearish swing trades on tickers with clear overhead resistance and declining volume on breakout attempts. Short SPY below $520 with a target of $505; buy put spreads on NVDA and MSTR with expiration 1–2 weeks out. Reduce long exposure to high-beta names; shift to cash or SHY until market confirms direction.

-
Creator Horizon Category (⏱️): Long-Horizon Macro — Content focuses on structural build-out themes, earnings cycles, and capital allocation shifts, not intraday technicals.
-
One-Line Thesis (💡): The AI infrastructure build-out is entering a supply-side stress phase that will separate winners from losers, but the structural $90 trillion Jensen thesis and the AI-vs-non-AI 60/40 portfolio framework remain intact.
-
Macro Drivers (📌):
- Supply-Side Bottlenecks: Fujikura earnings collapse, Modine supply constraints, semi test-equipment industry calling "worst-ever supply crunch" — bottlenecks now visible in price action.
- Breadth Deterioration: Only 3 of 11 S&P sectors positive in last month; Morgan Stanley Tech Momentum Index showing fatigue; "crappy beta" tech outperforming fundamental AI names.
- Korea Retail Warning: Record margin balances and lunch-table stock talk indicate speculative excess in local markets.
- Structural Demand: Jensen frames $90 trillion build-out over 10-15 years (85% of global economy); Dell raised FY27 EPS guide to $18 (from $12) and revenue to $165-195B.
- Agentic Traffic Repricing: Cisco's G2 Patel revised agentic WAN traffic from 2.5x to 9x over next decade — 4x repricing of infrastructure stack.
- AI-Pharma Convergence: Eli Lilly deploying 1,000+ Blackwell GPUs, Lilly Pod supercomputer, Verve gene-editing acquisition; revenue up 55% YoY with PEG below 1.
- Inflation/Power Risks: Exxon/Chevron CEOs warn oil to $160; ERCOT peak load at 135 GW with 4% reserves; Goldman estimates only 50-60% of scheduled data center capacity comes online.
- New 60/40 Framework: Torsten Slok identifies AI vs. non-AI as the new 60/40; benchmark weights remain 80-90% wrong. -
Actionable Trading/Allocation Plan (🎯):
- Core Long: Maintain overweight to AI infrastructure (semis, hardware, power) with tight stops; use 20/50-day MA cross or 200-day break as systematic exit signals (proven in 1929, 1987, 2000, 2008).
- Tactical Fade: Reduce exposure to "crappy beta" tech names that are now outperforming fundamental leaders — this character change precedes drawdowns.
- High-Conviction Long: Add Eli Lilly as the overlooked AI-pharma convergence play (55% revenue growth, PEG <1, doubling Mag 7 since 2017).
- Risk Management: Watch Korea margin balances and Fujikura/Modine earnings for further supply-chain weakness; if breadth continues deteriorating, cut AI-exposed longs by 30%.

-
Creator Horizon Category (⏱️): Short-Term Technical / Live Trading – The title “INSANE Month End Rebalancing” and channel “Trade Brigade” indicate a focus on mechanical, event-driven technical flows rather than structural macro shifts.
-
One-Line Thesis (💡): Month-end portfolio rebalancing (M2M buying/selling) will create forced, high-velocity dislocations in SPX and key momentum names, offering short-term scalping opportunities into the close.
-
Technical Levels & Setups (📌):
- SPX: Key resistance at 5,700 (capped by month-end gamma); support at 5,620 (call wall pivot). Close above 5,700 invalidates bearish rebalance flows.
- Bond proxy rotation: TLT and XLU likely see forced buying (duration rebalancing) if equities pullback; $39.50 on TLT is pivotal.
- SPX/QQQ gamma flip: Large dealer short gamma below 5,600 on SPX could accelerate month-end selling into the final hour.
- No ticker-specific setups: Title suggests macro index-level rebalancing, not individual stock breakdowns. -
Actionable Trading/Allocation Plan (🎯): Sell SPX/nasdaq on any intraday rally above 5,690, targeting a slide to 5,620 by 3:30 PM ET. Alternatively, fade long-bond weakness by buying ZT futures into the close if equities break 5,600. Avoid holding positions overnight.

-
Creator Horizon Category (⏱️): Long-Horizon Macro — The content is a structural framework for onboarding to AI, focusing on building foundational skills and understanding agentic evolution, not live market or price action.
-
One-Line Thesis (💡): The long-duration structural shift toward Agentic AI systems will revalue both human capital and software infrastructure, making foundational technical literacy (Python, terminal, workflow automation) a critical non-discretionary allocation for investors and operators.
-
Macro Drivers (📌):
- Human Capital Repricing: The AI adoption gap is not about intelligence but confidence; the bottleneck is basic computer literacy (files, folders, terminal), creating a structural demand for reskilling.
- Agentic Transition: The shift from LLMs as Q&A tools to autonomous agents (tools, files, workflows) implies massive infrastructure buildout for orchestration, memory, and tool integration.
- Educational Infrastructure: Recommended resources (Coursera, Alex Finn tutorials) point to a rising capex cycle in educational platforms and low-code / no-code agent builders.
- Personal Productivity as Alpha: The fastest path to AI competency is building personal, bespoke tools (planners, trackers, small websites), suggesting a premium on platforms that enable consumer-level agent creation. -
Actionable Trading/Allocation Plan (🎯):
- Long educational tech (Coursera, Udemy) and low-code/agent platforms (C3.ai, UiPath) as durable beneficiaries of the reskilling and agentic transition.
- Short companies reliant on static SaaS models that cannot agentify their workflows; the shift to autonomous agents threatens legacy subscription revenue.
- Monitor hardware proximity: Increased agentic compute demand favors NVIDIA, but also watch for specialized inference chips (e.g., Groq, AMD) as agents require low-latency execution.
- Allocate capital to venture / private equity targeting AI-native productivity tools (e.g., Notion, Linear, Replit) that serve exactly the "build small things" cohort described in the video.

-
Creator Horizon Category (⏱️): Short-Term Technical — The title explicitly references imminent market “slowing down” ahead of a specific data release (PCE inflation), typical of live-trading or near-term directional positioning by a channel like Trade Brigade.
-
One-Line Thesis (💡): Markets are consolidating in a risk-off posture into tomorrow’s PCE inflation release, with traders likely positioning for a downside squeeze or breakdown depending on the data outcome.
-
Technical Levels & Setups OR Macro Drivers (📌):
- PCE inflation data on 2026-05-29 is the sole near-term macro catalyst; the market is slowing down into this event, implying a tightening of trading ranges.
- No specific support/resistance levels or ticker setups are provided in the metadata, so the actionable setup is a data-dependent breakout/breakdown on the PCE print.
- The phrase “slowing down” suggests declining volume and reduced intraday volatility, typical of a pre-event compression that often precedes a sharp move. -
Actionable Trading/Allocation Plan (🎯): Stand aside or reduce risk exposure into the PCE release. If long, tighten stops. For intraday traders, wait for the initial PCE reaction to fade before entering a direction (likely a fade of the first spike unless data shows a major miss/beat). Scalp the SPY or QQQ range, not a trend.
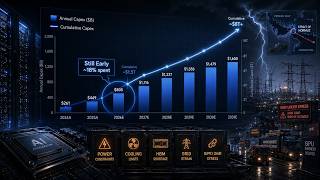
1. Creator Horizon Category (⏱️): Long-Horizon Macro — The creator frames AI as a physical-world capex cycle, analyzes structural bottlenecks and 1970s-style regime risks, and discusses capital allocation across multi-year thematic portfolios.
2. One-Line Thesis (💡): The secular AI buildout remains intact but is entering a two-sided risk phase, where physical bottlenecks, rising oil/rates, and momentum unwinds demand rotating from memory/industrial plays to platform/connectivity and defensive AI (IPPs, Nvidia).
3. Macro Drivers (📌):
- Physical Capex Bottlenecks: HBM, racks, liquid cooling, copper, substations, gas turbines causing cost inflation, project delays, and revenue-recognition risk; only ~12% of $8T buildout spent.
- 1970s Regime Template: Rising crude (largest US draw since 1982), Fed repriced +100bps hawkish, CPI/PCE drifting toward 4%, 10yr up +75bps since Strait of Hormuz.
- Momentum & Correlation Breaks: S&P extended (monthly/weekly RSI >70), hyperscaler basket (META, GOOGL, AMZN, MSFT) below 20-day MA, industrials MACD sell signal, Korea/Japan diverging from US.
- Inference & Token Growth: Google I/O’s parabolic token growth; Vera Rubin memory spend +435%; retail crowding into DRAM ETF.
- Financial System Redesign: Handoff underway toward tokenization and crypto as next phase.
4. Actionable Trading/Allocation Plan (🎯):
- Favor: Platform/connectivity names (e.g., Marvell, Nvidia) and Independent Power Producers (IPPs, e.g., Vistra) as defensive AI; initiate/concentrate into tokenization/crypto exposure.
- Reduce/Underweight: Memory plays (DRAM ETF, Intel), industrials, and semis exposed to physical bottlenecks; cut equal-weight hyperscaler basket.
- Hedge: Use the 1970s regime playbook (rising oil, rising rates, multiple compression) — overweight energy/commodities, shorten duration, reduce equity beta despite secular AI narrative; watch 10yr +75bps move and dollar strength as S&P denial signal.

-
Creator Horizon Category (⏱️): Short-Term Technical – The title “Did markets just DOUBLE TOP!?” and the channel name “Trade Brigade” indicate a focus on immediate price action, chart patterns, and tactical trading setups.
-
One-Line Thesis (💡): Markets are at a critical juncture where a failure to break above recent highs could trigger a sharp reversal, making a “double top” pattern the key short-term risk.
-
Technical Levels & Setups (📌):
- Key Resistance: Monitor the SPX high from prior sessions; a break above invalidates the double top.
- Key Support: Initial support at the neckline of the potential double top; a daily close below this level confirms the pattern.
- Pattern Trigger: A close below the intra-swing low between the two peaks is the confirmation signal for shorts.
- Tickers: Likely focus on SPY, QQQ, and high-beta momentum names (e.g., NVDA, TSLA) that are most reactive to index-level patterns. -
Actionable Trading/Allocation Plan (🎯): Sell into strength near the prior highs if volume is low; if the SPX breaks and holds below the neckline, initiate tactical short positions with a stop just above the recent double top peak. Reduce long exposure in all products until the pattern resolves.
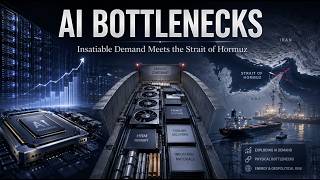
-
Creator Horizon Category (⏱️): Long-Horizon Macro / Structural. Justification: The analysis synthesizes inflation regime shifts, global supply chain bottlenecks, energy scarcity, and structural earnings cycles to derive a multi-month asset allocation thesis, not short-term price action.
-
One-Line Thesis (💡): The AI-driven parabolic rally is ending as physical world bottlenecks (energy, supply chains, drought) create a scarcity regime; rotate from AI semis into crypto (Bitcoin, Dogecoin) and Silver as the next parabolic beneficiaries.
-
Macro Drivers (📌):
- Inflation Regime Shift: US CPI hit 3.8% YoY (highest non-COVID since 2012), PPI hotter, import prices surging—negative real yields globally (US, Japan, Germany, UK) force a "short abundance, long scarcity" trade.
- Physical Bottlenecks: Strait of Hormuz still shut (COVID-era supply chain stress), worst US spring drought since 1895, motor oil shortages (Exxon/Shell/Costco), Mosaic curtailing fertilizer on sulfur shortage, NAPA as an AI chip constraint, Ford CEO Farley calling datacenter boom a "full-blown energy crisis" (only 2nd-3rd inning).
- Earnings & Momentum Exhaustion: AI semis 5 standard deviations on momentum, 62% above 200-day; DRAM 6-month rate-of-change has rolled over (historically coincided with SOXX/NDX peaks); Q1 earnings up 27% (only seen in recessions) but Hindenburg Omen triggered on NYSE/NASDAQ simultaneously (19th occurrence ever, <50% win rate next 5 months).
- Structural Rotation Signals: Equal-weight consumer discretionary vs. staples at lowest level since Liberation Day (26 household durables, only 4 positive YTD; DoorDash -34%, WingStop -50%); Korean machinery/construction indices diverging from SOXX; power semi names parabolic on unarrived demand.
- Policy & Liquidity Tailwinds for Crypto: Coinbase/Bedrock/Stripe integration, UK relaxing stablecoin rules, Clarity Act at 72% odds; negative real yields globally as the Bitcoin endgame setup; Dogecoin (XDG) flagged as retail signal for next parabola. -
Actionable Trading/Allocation Plan (🎯):
- Sell: Fully exit Micron and any AI semiconductor exposure (SOXX); avoid the risk of rate-of-change exhaustion and parabolic reversal.
- Buy: Accumulate Silver and Bitcoin (no 52-week-high bubble signs); size into Dogecoin (XDG) as the retail momentum proxy for the next parabolic leg.
- Hedge: Position for rising volatility, speed crashes, and rolling parabolas; curve steepening supports commodities over tech; overweight real assets (energy, food, metals) relative to digital compute.
- Monitor: Ford’s energy crisis comments, Strait of Hormuz reopening timeline, and Supreme Court freight broker ruling (30-50% operator extinction event) as catalyst triggers for further scarcity repricing.

1. Creator Horizon Category (⏱️):
- Long-Horizon Macro / Structural. Justification: The analysis focuses on a structural regime shift (agentic AI, power bottlenecks, passive benchmark arbitrage), earnings cycles, capital allocation, and late-cycle portfolio construction—not intraday price action.
2. One-Line Thesis (💡):
The “AI bubble” narrative is wrong; the dominant regime is a structural, cap-ex-driven rotation into AI, power, and commodities—driven by agentic AI demand and passive benchmark arbitrage—ending the Kindleberger “manias, panics, crashes” cycle.
3. Macro Drivers (📌):
- Agentic AI Shift: November’s Open Claude launch kicked off the “agentic stage” (token consumption 15–50x growth); bandwidth bottleneck shifted from GPUs to power.
- Demand Reality: S&P earnings +27.1% Y/Y; semi sales +88% Y/Y (March); Anthropic’s Q1 revenue 80x vs. planned 10x; cloud backlog $1.3–1.4T.
- Valuation Divergence: Market PEG 1.03; Nvidia P/E at decade low vs. Cisco P/E 130 at 2000 peak; low consumer confidence contradicts euphoria.
- Benchmark Arbitrage: Passive funds underweight AI names; rotation started late November (agentic stage). $8T market cap added by compute/model layers vs. $1.2T loss by service apps.
- Late-Cycle Bottlenecks: PMI logistics index 69.9 (fastest since Mar 2022); CPI tracking 3.7%; three-month bills heading below CPI (negative real yields); shortages in oil, fertilizer (food inflation).
- Tokenization Catalyst: Tokenization rollout scheduled July 26; Bitcoin ETF shares at all-time highs as boomers allocate.
4. Actionable Trading/Allocation Plan (🎯):
- Core Overweight: Nvidia (power bottleneck beneficiary), Silver, Bitcoin, Ethereum (negative real yields, tokenization tailwind). Vistra likely next add (utility play).
- Tactical Rotate: Sold two-thirds of Micron after exhaustion readings; rotate into Nvidia, Silver, Bitcoin.
- Sector Longs: Power basket breakout stocks (Hon Hai, Vistra, Eaton, Fluence, Sterling Infrastructure); advanced packaging (Soitec), grid electrification (ABB).
- Risk: Late-cycle inflation (CPI 3.7%), weak breadth (47 stocks near highs), AI knowledge-work disruption (info/financial jobs negative).
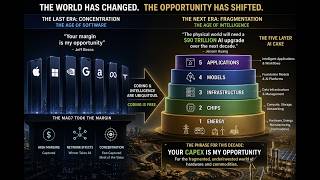
1. Creator Horizon Category (⏱️): Long-Horizon Macro. The analysis focuses on structural shifts in the earnings cycle (AI capex replacing the old business cycle), GDP drivers, and multi-year capital allocation frameworks rather than short-term price action.
2. One-Line Thesis (💡): The market’s earnings acceleration is being driven by a structural “AI business cycle” (semis → power/infra → humanoids), making traditional benchmarks (overweight software/consumer, underweight physical buildout) the primary source of alpha via benchmark arbitrage.
3. Macro Drivers (📌):
- New Business Cycle Phases: Early (semis, advanced packaging, optical fiber); Mid (power, data centers, chemicals, energy); Late (AI applications, agents, humanoids).
- Earnings Acceleration: Forward EPS accelerating without a prior drawdown; analysts revising estimates up for the first time in 15 years; capital goods PMI near 60.
- Physical Infrastructure Squeeze: Caterpillar’s $62B backlog; power generation sales forecast to triple by 2030; global compute shortage (Anthropic forecasting $50–100B run rate).
- Inflation Warning Signs: Unleaded gas breakout, back-month futures rising; global oil inventories hitting all-time lows; China exporters raising prices; crop/fertilizer breakouts.
- Breadth & Risk Signals: Median S&P stock 13% below 52-week high; financials below 200DMA; software/PE near YTD lows; turbulence model issued first cross-asset warning (not yet full trigger).
- Benchmark Arbitrage: Traditional indices overweight the last cycle’s winners (software, consumer) and underweight the AI buildout (semis, power, chemicals, optics, infrastructure).
4. Actionable Trading/Allocation Plan (🎯):
- Go Long the Physical AI Buildout: Overweight semis (Nvidia at a 10-year low forward PE), power equipment (picks and shovels for grid tripling), chemicals (exposure via advanced packaging/polymers), and optical fiber.
- Short/Sell the Old Cycle Benchmarks: Underweight software (golden age of margins contracting) and consumer-led growth (legacy business cycle drag).
- Hedge Inflation: Buy call spreads on unleaded gasoline, oil, and crop/fertilizer; watch inflation swaps and long-end bond yields (30Y UK gilts, 10Y JGBs).
- Position for Programmable Money: Buy Ethereum above the 200-week MA at 2456 (two closes above as trigger) if the Clarity Act passes; Bitcoin as a hot-inflation hedge (trigger: CPI above 3-month yields).
- Avoid Complacency: Monitor the turbulence model for a full trigger; financials below 200DMA signal systemic stress; do not chase breadth-less rallies in the S&P.

-
Creator Horizon Category (⏱️): Long-Horizon Macro – The analysis focuses on a multi-decade structural shift (physical AI buildout), capital cycles, and macro policy impacts, not short-term price action.
-
One-Line Thesis (💡): Go long the Physical AI buildout (Semis, Industrials, Materials, Energy) and go short the code-based funding vehicle (Hyperscalers/SaaS); this is a first-inning structural shift, not a cyclical trade.
-
Macro Drivers (📌):
- Sector Dominance Shift: Semiconductors are now 17% of the S&P 500 (~$10T), surpassing software; Nvidia, Broadcom, & Micron alone represent $7.5T.
- Capex Supercycle: Jensen’s “5-layer cake” frames a $90 trillion physical AI buildout against a $120T global economy; this capex path is structural.
- Industrial Boom Confirmation: Capital goods imports vs. consumer imports at 1991 highs; rail, trucking, and chemicals at record levels—driven by AI paranoia, not housing/autos.
- Macro Pressure: CPI on path above 4% ; negative real yields returning; services PMI highest since 2022; fiscal stimulus from “One Big Beautiful Bill” compounds bottlenecks.
- Supply Scarcity: DRAM capacity must double or triple; optical/ceramic capacitor shortages; power semis broke out vertically after 5 years flat.
- Earnings Concentration: Micron + Exxon + Chevron + Broadcom = 85% of S&P revisions; MAG 7 ex-Nvidia earnings growth only 6.4%.
- Bitcoin Signal: MACD weeklies turning; proxy trade (Qs + gold + copper) setting up catch-up into year-end. -
Actionable Trading/Allocation Plan (🎯):
- Core Long: Accumulate Semis (especially Nvidia , Broadcom , Micron ), Industrials , Materials , Energy.
- Tactical Long: Power semiconductors (Texas Instruments , Intel ); optical/silicon photonics (Coherent , Lumentum , Corning , Marvell ). Add Bitcoin exposure.
- Core Short: Hyperscalers (funding vehicle for capex with declining ROIC). Avoid/Gross-Short code-based SaaS —this is not a mean-reversion opportunity.
- Macro Hedge: Position for CPI above 4% and sustained bottlenecks; underweight traditional growth (Russell 1000 Growth in permanent reversal).

-
Creator Horizon Category (⏱️): Long-Horizon Macro / Structural — The content synthesizes structural compute shortages, inflation dynamics, and capital cycles, not short-term price action.
-
One-Line Thesis (💡): The market is repricing for a physical scarcity regime (compute, energy, materials) that is inflationary, non-transitory, and structurally bullish for semis, energy, and digital assets as release valves.
-
Macro Drivers (📌):
- Compute Shortage: Physical crunch in CPUs, memory, and chips; Anthropic token rationing, Uber CTO budget max-out, Nvidia chip prices +48% in two months, Intel parabolic from $25 to ~$70.
- Capex Supercycle: Elon Musk’s Terra Fab ($5–13T capex projection); Oracle reframed as compute company; ~80% of US data center pipeline delayed.
- Inflation Deepening: "Chipflation" via Korean export data, Oil 12th-month contract +24% YTD, Goldman raised inflation forecast; CPI above 4% flagged as bond crash risk (Paulson warning).
- Energy Bottleneck: Jensen Huang and Musk converging on power as downstream constraint; batteries (EOS, Fluence) becoming critical; power names called a "gift on the dip."
- Digital Assets as Circuit Breaker: Bitcoin weekly MACD buy signal; Ethereum took out March highs; negative real rates approaching with governments unable to cut rates or service debt.
-
Actionable Trading/Allocation Plan (🎯):
- Long Semis & Infrastructure: Add Nvidia, Intel (structural CPU shortage), and CoreWeave (revenue $9B→$30B annualized); buy the dip in energy/power names (EOS, Fluence).
- Long Commodities & Inflation Hedges: Overweight energy, materials, capital goods; prepare for CPI >4% to trigger bond volatility—short duration or go long Bitcoin.
- Rotate Out of Software: Anthropic revenue surge signals potential software cancellation risk; rotate from growth to physical-asset-heavy scarcity plays.
- Monitor Bond Crash Risk: If 10Y yield breaks resistance on CPI data, increase allocation to digital assets as "release valve" when fiscal/monetary policy hits constraints.
-
Creator Horizon Category (⏱️): Long-Horizon Macro / Structural. The thesis is driven by multi-decade inflation parallels (1970s), structural scarcity vs. abundance shifts, and capital-cycle analysis, not short-term price action.
-
One-Line Thesis (💡): Short scarcity (software, private credit, financials) vs. long abundance (commodities, hardware, capital goods, Bitcoin), as inflation structurally reasserts via real yields turning negative.
-
Macro Drivers (📌):
- Inflation Regime Shift: Headline CPI +0.9% MoM (highest since June 2022); Core PCE >0.3% for 3rd consecutive month (only 2nd time in 25 years); gas 40-day rate of change highest in 22 years.
- Commodity Scarcity Deepens: China bans sulfuric acid exports; helium, diesel, plastics, fertilizer all surging; ISM reports every commodity up; compute/electrical components/rare earths constrained.
- Policy Reversal: Rate cuts fully priced out; global rate hikes beginning; Fed funds rate about to fall below CPI (negative real yields imminent).
- Software Destruction: Anthropic's "Mythos" leak triggered Treasury emergency meeting & Project Glasswing; models now break 27-year-old software; Palantir gave back entire month’s outperformance in a week.
- Private Credit Stress: Carlyle limits redemptions at 15.7%; fundraising at decade-low; ~50% of levered exposure tied to software redemption pressure (forced selling loop).
- Bitcoin Own Period: Weekly MACD crossover; 22% outperformance vs. software (largest in 2 years); correlation breaking; negative real yields + Fed on hold historically produce vast majority of BTC returns.
- Hardware Boom: 100-name thematic basket (rack, chemicals, optical fiber, advanced packaging, power) at all-time highs; Nvidia at lowest PE in a decade with earnings still growing.
- Compute Demand: Anthropic revenue parabolic; 500+ million-dollar customers (from a dozen two years ago); 8 of Fortune 10 are Claude customers; partnering with Google/Broadcom for TPU access. -
Actionable Trading/Allocation Plan (🎯):
- Go long the thematic basket of 100 hardware & physical-world names (rack, chemicals, optical fiber, advanced packaging, power).
- Go long Bitcoin as negative real yields become the dominant macro driver; target the "sweet spot" quadrant where BTC historically generates all returns.
- Go long Nvidia on compressed PE (decade low) with earnings still growing; write the piece on the mispricing.
- Go long capital goods ex-air & defense; computer equipment investment at 1% of GDP with straight-line uptrend.
- Go long Silver as critical AI commodity; Brazil (EWZ) near 5-year highs; Tesla and battery stocks for storage re-rating.
- Short software (IGV), private equity, financials (private credit exposure), and any levered names with software redemption overhang.
- Avoid S&P 500 directionality; trade the pendulum (scarcity vs. abundance) not the index trend.
No highlights match
Try resetting the creator filter or clearing your search.
Chronological Synthesis
Sentiment across time. Two lenses: a timeline of every video with day-level sentiment, and creator arcs showing how each voice evolved.
No analyzed videos yet
The chronological views appear once videos have AI summaries.
Briefing Archive
Day-over-day timelines, cross-creator synthesis, and the Executive Alpha signal.
1. Executive Summary (📰)
The Compound’s 2026-09-21 videos present a split view: a tactical selloff-rebound case for stocks/semis tied to AI competition, and a structural US innovation-boom case qualified by political, protest, and grant-cut risks. No tickers, exact price levels, entry/stop/target parameters, probabilities, or allocation sizes are established by the available evidence.
2. Narrative Over Time (⏳)
- 13:41 ET — The Compound, “Why Elon Musk Wants AI to Slow Down”: Frames Musk’s AI-slowdown stance as competitive catch-up, claims Anthropic and OpenAI are far ahead, and says only regulatory capture could let rivals catch them. Treats the stock/semis selloff as an opportunity on a two-month horizon.
- 17:00 ET — The Compound, “Are Politicians Slowing America’s AI Boom?”: Shifts to macro: claims the US is finally ahead of China on tech and that the innovation boom will create US jobs, while warning that politically illiterate officials, grant cuts, and protest spillover could cancel projects.
- Evolution: Earlier video is tactically contrarian on the selloff; later video is structurally bullish on US tech but cautious on policy/protest friction. The two are not directly reconciled in the evidence.
3. Key Technical Levels & Signals (📈)
- The Compound (Video #1, 13:41 ET): No exact ticker, price level, entry, stop, target, ratio, position size, or probability appears. Cited signals: “semis did” get crushed; a “black Monday”/“black month” stock crush was expected; creator views the selloff as an opportunity looking out “two a month from now” [sic].
- The Compound (Video #2, 17:00 ET): No exact ticker or price level appears. Cited operational/macro data: Taiwan fabs built “18 hours a day”; bathroom break after “14 hours”; US rank “17th in math.”
- Overall: No actionable technical levels or zones are established by the available evidence.
4. Long-Horizon Macro & Structural Views (🌍)
- AI model race: The Compound (Video #1) claims Anthropic and OpenAI are “so far ahead no one could really catch them unless there’s a regulatory capture type of moment”; Musk’s slowdown is attributed to being “way behind.”
- Semis/stock selloff: The Compound (Video #1) frames the selloff as a two-month opportunity, but provides no valuation, catalyst schedule, or benchmark trigger.
- US innovation boom: The Compound (Video #2) claims the US is finally ahead of China on tech and that jobs will be created in the US innovation boom; neither claim is independently substantiated in the evidence.
- Policy/protest risk: The Compound (Video #2) warns politicians with “flip-phones and blackberries,” talking points, and grant cuts could “cut the knees off tech,” while protests spilling into canceled projects are a stated worry.
- Allocation view: No top-down allocation, ticker, weighting, or sector sizing is established by the available evidence.
5. Scenario Analysis (🔄)
- Bull: Trigger — The Compound (Video #1) says the current stock/semis selloff is an opportunity looking out “two a month from now”; The Compound (Video #2) says the US is ahead of China on tech and innovation-boom jobs are created. Support: both videos contribute non-conflicting bullish elements. Probability/target: Not established by the available evidence.
- Base: Trigger — The Compound (Video #2) describes the current condition as US tech leadership and job creation while its policy/protest worries remain unrealized. Support: only Video #2 explicitly supplies a base condition; Video #1 does not. Probability/target: Not established by the available evidence.
- Bear: Trigger — The Compound (Video #1) notes semis were crushed and a “black Monday”/“black month” stock crush was expected; The Compound (Video #2) warns protests spill into canceled projects or politicians/grant cuts “cut the knees off tech.” Support: both videos supply distinct bear triggers. Probability/target: Not established by the available evidence. No direct numeric disagreement appears; the main tension is Video #1’s tactical selloff optimism versus Video #2’s macro policy caution.
6. Chronological Stream (📌)
[13:41 ET] | The Compound | [Why Elon Musk Wants AI to Slow Down](https://www.youtube.com/watch?v=f1B_BysbTTM) | Claims Musk wants AI to slow because his model effort is behind Anthropic/OpenAI, and treats the semis/stock selloff as a two-month opportunity.[17:00 ET] | The Compound | [Are Politicians Slowing America’s AI Boom?](https://www.youtube.com/watch?v=JKeipc9nyQ0) | Claims the US is ahead of China on tech and creating innovation-boom jobs, but warns political illiteracy, grant cuts, and protest spillover could cancel projects.
7. Evidence-Bound Watchlist (🎯)
- Verify whether the referenced semiconductor/stock selloff continues or reverses over the creator’s stated two-month horizon; no tickers, levels, or probabilities are provided.
- Track OpenAI and Anthropic model releases/benchmarks to test the claim that they are far ahead and that only regulatory capture could let rivals catch up.
- Monitor US tech policy, grant cuts, protests, and project cancellations, plus third-party US-China tech competitiveness and job-creation data; literal context points include Taiwan fabs at “18 hours a day,” bathroom break after “14 hours,” and US “17th in math.”
Weekly Intelligence Brief — AI, Fed, and Rotation (Sep 13–20, 2026)
1. Executive Summary (📰)
Creators split between an AI-capex/market-bottom bull case and a Fed/rates-driven multiple-compression caution. The week’s key reconciling point: SPY 76025 and AI-lab revenue/Fed messaging, not AI-doomer rhetoric alone.
2. Narrative Over Time (⏳)
- Sep 13–14: “AI fear” and “AI slowdown” headlines dominate; Jensen/Trump stage a “hoax” debunk; Trade Brigade flags gap-down pressure.
- Sep 15–16: FOMC prep, crypto/FOMC levels, Satya/Musk/SpaceX/NASA themes, and AI decision-making panels broaden the macro frame.
- Sep 17–18: Post-FOMC digestion, Brad Gerstner’s AI revenue thresholds, Meta data-center social license, $7T expiration, and Tom Lee/Dan Ives’ young-tech-bull claim.
- Sep 19–20: Weekend technicals ask “was that the bottom?”; Trade Brigade and TheChartGuys focus on 76025, weekly 12 EMA, and rotation; Jordi Visser argues crypto is the breakout macro trade.
3. Key Technical Levels & Signals (📈)
- Trade Brigade: SPY 76025 pivot; 76367 bullish trigger; 75875 Friday low; 75665 PPI low; 76464 fib 61.8; 76785 midpoint; 77156/75182 expected move. Weekly hammer cited; daily trend still down.
- TheChartGuys: S&P weekly 12 EMA and FOMC lows; IGV 9972/11057; MAGS 7116/7125; Tesla 35405; SPCX 142.87; XLF/SPY and XLV weekly EMA risk.
- Crypto Prep: BTC 76,000 support break lacked follow-through; 77,300, 78,000, 80,000, 70,000; ETH 23.55; FOMC 25bp hike cited at 92–94%; Clarity Act advancement “maybe 40%.”
- Jordi Visser: 46-name crypto index new highs; BTC another 15% from here (creator target).
- Stock Market Live: $7T expiration; chips +6; MSTR +7; BTC +4; SPY +0.04; sector rotation unstable.
- Gerstner/Tom Lee/Dan Ives: Anthropic revenue $2B/$4B/$11B; run-rate $65B vs $75B expected; need $180B; S&P 2.6% off ATH; semis 19–20% drawdown; earnings +25%; chip demand 13:1.
4. Long-Horizon Macro & Structural Views (🌍)
- AI capex/data centers framed as multi-decade “oil” or supercycle; bottlenecks: power, permitting, local votes, regulation, China competition.
- AI safety debate split: All-In guests dismiss doomer “hoax”; Compound/Animal Spirits flag cybersecurity and policy-error risk more than extinction.
- Fed/rates: hike largely priced; disagreement on whether it removes uncertainty or compresses multiples.
- Crypto/AI convergence: Jordi argues tokenization and AI agents make crypto the key September/October inflection.
- Structural projects: SpaceX/Terafab, NASA Artemis/2028 nuclear, Meta data centers, California high-speed rail, AI portfolio management by 2027.
5. Scenario Analysis (🔄)
- Bull: Trigger: SPY takes out 76367 and holds 76025; AI-lab monthly revenues near $4B/$8B; crypto 46-name index continues new highs. Supported by Trade Brigade, TheChartGuys, Tom Lee/Dan Ives, Gerstner, Jordi. Target: Jordi BTC +15% only literal target; probabilities not established.
- Base: Trigger: SPY ranges between 75182–77156; rotation persists; AI diffusion slow; Fed hike priced but not resolved. Supported by Trade Brigade, TheChartGuys, Satya/Nadella, Gerstner. Probabilities/targets not established.
- Bear: Trigger: loss of 76025 and 75665; semis weakness; policy error/cyber incident; AI slowdown rumors validated; data-center votes block buildout. Supported by Trade Brigade bear path, TheChartGuys FOMC-low loss, Animal Spirits, cautionary Gerstner. Probabilities/targets not established.
6. Chronological Stream (📌)
- [23:29 ET 9/13] | Stock Market Live | AI FEAR EVERYWHERE | AI headlines into Fed week; rates transmission.
- [07:30 ET 9/14] | Trade Brigade | Pre-Market Prep – GAP DOWN | AI slowdown rumors pressure markets.
- [08:55 ET 9/14] | TheChartGuys | How To Trade When Life Changes | Routine management, not market setup.
- [17:36 ET 9/14] | All-In Podcast | Jensen Huang | AI-safety fears, RSI, Nvidia, regulation.
- [18:52 ET 9/14] | All-In Podcast | Trump calls Jensen | AI/data centers “oil” next 20–25 years.
- [21:48 ET 9/14] | Stock Market Live | AI HOAX | Trump/Jensen debunk hoax; rate-hike odds conflict.
- [22:30 ET 9/14] | All-In Podcast | Besties React | AI debate politicized pre-election.
- [23:59 ET 9/14] | All-In Podcast | Musk & Shotwell | SpaceX IPO, Mars, compute, Starlink.
- [06:00 ET 9/15] | Capital Allocators | Should AI Make Decision? | AI research aid; decision-making 2027.
- [07:32 ET 9/15] | Trade Brigade | Heavy Markets Ahead FOMC | Pre-FOMC heaviness; no levels.
- [13:00 ET 9/15] | All-In Podcast | Elon Peer Reviews | Adversarial AI safety testing; China acceptance.
- [13:29 ET 9/15] | All-In Podcast | Satya Nadella | Azure $80B; token compression; agent risks.
- [15:18 ET 9/15] | TheChartGuys | Crypto Prepares For FOMC | BTC 76k, ETH 23.55, FOMC catalysts.
- [16:15 ET 9/15] | All-In Podcast | Musk Terafab | Taiwan hedge; fab capacity maxed.
- [17:13 ET 9/15] | All-In Podcast | JD Vance | AI, fraud, Iran, H-1B, midterms; truncated.
- [22:42 ET 9/16] | Stock Market Live | Kevin got bullied | Bonds, inflation rally, FOMC live.
- [23:20 ET 9/16] | All-In Podcast | Brad Gerstner | No AI bubble; revenue thresholds critical.
- [06:00 ET 9/17] | The Compound | Ray Dalio | AI extremes unlikely; semis/software rotation.
- [07:35 ET 9/17] | Trade Brigade | V Shaped Reversal | Key level, futures/options prep.
- [11:03 ET 9/17] | TheChartGuys | Year one of trading | Risk management first.
- [13:00 ET 9/17] | The Compound | Stocks or Index Funds? | Bonds >5%, TIPS, boomer wealth.
- [13:31 ET 9/17] | All-In Podcast | Dina Powell McCormick | Meta data centers; social license.
- [15:21 ET 9/17] | The Compound | Miami Vices | Non-market segment.
- [20:30 ET 9/17] | All-In Podcast | Nick Shirley | California rail costs; fraud probe law.
- [21:03 ET 9/17] | All-In Podcast | Jason to Nick | Media capture; AG pressure.
- [06:00 ET 9/18] | The Compound | Tom Lee & Dan Ives | Fed hike done; young tech bull.
- [12:27 ET 9/18] | All-In Podcast | Jared Isaacman | NASA Artemis 2027/2028, China race.
- [15:29 ET 9/18] | All-In Podcast | America’s Next 250 | Patriotic montage; no market thesis.
- [17:04 ET 9/18] | The Compound | Tech Bull Just Starting | Memory/Micron; data centers; low PE.
- [17:08 ET 9/18] | The Compound | Market Says Fine | Mortgage 6–7%, 10Y 4–5%, stocks +13%.
- [17:50 ET 9/18] | The Compound | BTS Tom Lee/Dan Ives | Consumer discretionary capital cycle.
- [17:52 ET 9/18] | Stock Market Live | Triple Warshing | $7T expiration; chips/crypto bid.
- [20:30 ET 9/18] | All-In Podcast | Bill Gurley | Catastrophes; CAPA; regulatory capture.
- [14:19 ET 9/19] | Trade Brigade | Was that the bottom? | SPY weekly hammer; 76025 pivot.
- [17:04 ET 9/19] | The Compound | Robot Baristas | Product demo; no financial thesis.
- [08:30 ET 9/20] | Jordi Visser | Market Didn’t Crash | Crypto breakout; AI/tokenization inflection.
- [10:00 ET 9/20] | TheChartGuys | Has The Market Bottomed? | Weekly higher lows; semis/memory rotation.
7. Evidence-Bound Watchlist (🎯)
- Verify SPY acceptance/rejection at 76025 and whether 76367 is taken out; Trade Brigade’s weekly higher-low thesis depends on it.
- Verify AI-lab monthly revenue claims near $4B/$8B and collective run-rate toward $180B; Gerstner’s bull case is threshold-dependent.
- Verify FOMC/rates pricing and 10Y/oil stress; Stock Market Live, Jordi Visser, and Animal Spirits flag different rate/oil transmission risks.
1. Executive Summary (📰)
Creator commentary on 2026-09-11 is non-directional on near-term trades: Trade Brigade’s metadata-only CPI live prep establishes a macro catalyst but no bias, while The Compound’s later transcripts emphasize long-horizon US/Japan debt, Treasury issuance, BOJ policy, and retirement-account access constraints. No exact levels, targets, probabilities, or position sizes are present in the source evidence.
2. Narrative Over Time (⏳)
- 09:50 ET — Trade Brigade published a live pre-market prep explicitly framed around the CPI Inflation Report and live market reaction. Evidence is metadata-only; no directional bias, instruments, levels, or trade parameters are available.
- 15:09 ET — The Compound shifted the day’s tone toward long-horizon macro/structural risk, naming US and Japan debt metrics, singling out the US as worst, citing excessive Treasury issuance, real rates, and Bank of Japan policy as hyper important, and warning something could break across all industries.
- 15:48 ET — The Compound added a household/structural access theme: the WSJ retirement sequence—max 401k, backdoor option, mega backdoor Roth 401k conversion, cash balance pension—was acknowledged, but hosts emphasized income level and employer access as binding constraints.
- Net trajectory: from a scheduled macro catalyst with no disclosed trade plan, to broad sovereign-debt/central-bank concerns, then to retirement-plan eligibility constraints. No creator provided a confirmed directional market call.
3. Key Technical Levels & Signals (📈)
- No exact price levels, zones, entries, stops, targets, or risk/reward ratios are present in any source summary.
- Trade Brigade: CPI Inflation Report is the cited macro catalyst; the session is described as live pre-market technical analysis for futures and options traders, scheduled around 8:00 AM EST. No instruments, tickers, or levels are named in available metadata.
- The Compound: no tickers, price levels, valuations, entries, stops, targets, or position sizes are present. Cited signals are qualitative: US/Japan debt metrics, US Treasury issuance, real rates, BOJ policy path, and retirement-plan access.
- Where exact values are absent, they are unavailable rather than inferred.
4. Long-Horizon Macro & Structural Views (🌍)
- US/Japan debt metrics: The Compound claims the US, not Japan, has the worst debt metrics; the specific metric is not identified and remains uncorroborated.
- Treasury issuance and fiscal risk: Creator cites excessive US Treasury issuance and an unnamed “another issue or group of issues” of equal size.
- Real rates and cross-industry break risk: Real rates are called relevant, but The Compound says “something else” may be breaking across all industries simultaneously.
- Bank of Japan: BOJ policy is called “hyper important,” with a claim that it is “not going to give up anytime soon” and an unverifiable asymmetric-information assertion.
- Regional/AI themes: Korea is called “pretty interesting now”; AI/robot information intermediation is mentioned but not developed into a testable thesis.
- Retirement structure: The Compound hosts do not dispute the WSJ retirement-savings ladder but stress that mega backdoor Roth 401k conversion and cash balance pension access depend on employer plan availability and income level.
5. Scenario Analysis (🔄)
- Bull: Supported only by The Compound retirement discussion: if employer plan rules and income level permit, the listener may access mega backdoor Roth 401k conversion and potentially other options discussed. Trade Brigade and The Compound debt discussion establish no bull scenario. Probability/target: Not established by the available evidence.
- Base: Supported by The Compound debt discussion—creator says we could easily be talking about this again in six months—and by The Compound retirement discussion—hosts accept the WSJ sequence and say no material omission besides access/income constraints. Trade Brigade establishes no base scenario. Probability/target: Not established by the available evidence.
- Bear: Supported by The Compound debt discussion—creator asks whether something will break and says it is impacting all industries at the same time—and by The Compound retirement discussion—employer may not offer mega backdoor Roth 401k conversion or a cash balance pension. Trade Brigade establishes no bear scenario. Probability/target: Not established by the available evidence.
- No direct directional conflict appears across creators; the disagreement is coverage-based, not a reconciled market view.
6. Chronological Stream (📌)
[09:50 ET] | Trade Brigade | [LIVE] Pre-Market Prep – CPI Inflation Report Live Market Reaction | Metadata-only CPI live prep; no directional bias or levels disclosed.(URL: https://www.youtube.com/watch?v=MAW6QDqZp_4)[15:09 ET] | The Compound | What Country Has the Worst Debt Metrics? | US/Japan debt, Treasury issuance, real rates, and BOJ policy flagged as long-horizon risks; no tickers or levels.(URL: https://www.youtube.com/watch?v=XItYluh4jjI)[15:48 ET] | The Compound | Should Ben Bring Back the Mustache? | WSJ retirement ladder accepted, but access and income constraints limit mega backdoor Roth and cash balance options.(URL: https://www.youtube.com/watch?v=JJfG6tqIhrc)
7. Evidence-Bound Watchlist (🎯)
- CPI Inflation Report: Confirm consensus, actual, and surprise against an official economic calendar/source; assess whether the live market reaction matches Trade Brigade’s metadata-only CPI framing.
- US/Japan debt metric: Identify the exact debt metric behind The Compound’s “US worst” claim; verify against Treasury, IMF, or OECD data, and track Treasury issuance, deficit, debt-service, BOJ communications, and real-rate developments.
- Retirement-plan access: Verify whether the mega backdoor Roth 401k conversion and cash balance pension options described by The Compound are available by employer plan and income eligibility, as the hosts explicitly qualify access.
1. Executive Summary (📰)
Single-source brief: The Compound’s Josh Brown frames Apple’s sub-$2,000 foldable, TSM-made A20 two-nanometer on-device AI, and a $100 iPhone 18 Pro/Pro Max price increase as long-horizon handset-demand catalysts. The same view tempers near-term impact: foldable supply is claimed insufficient to move Q4, with 2027 positioned as the potential blockbuster window.
2. Narrative Over Time (⏳)
- 2026-09-10 13:52 ET: The Compound published “Josh Brown on Apple’s Foldable iPhone” (https://www.youtube.com/watch?v=Uou5HxG1msM). This is a single-source, single-timestamp snapshot; no prior or subsequent creator evidence exists in the analyzed period.
- Sentiment is long-horizon structural rather than tactical: creator focuses on Q4, 2027, handset demand, new product category, and on-device AI.
- Intra-video conflict: referenced counterpoint Malcolm claims “there is no AI”; creator Josh Brown disagrees, claiming Apple’s on-device work is far in advance of rivals. Apple’s lack of an active public LLM is conceded but treated as not disqualifying, using a search-engine analogy.
- No multi-video evolution or corroboration is available; all claims remain attributable to this source.
3. Key Technical Levels & Signals (📈)
- No chart technical levels, zones, entry/stop/target levels, or trade setups were cited. Those are unavailable.
- Product-price signals attributed to creator:
- Foldable launch under $2,000, versus roughly $2,500 tech-blogger consensus; creator calls this an upside surprise.
- iPhone 18 Pro and Pro Max up $100, described as within expectations.
- Demand signal: creator expects waiting lists for the foldable.
- Supply signal: creator says foldable supply cannot be made in enough volume to move the needle in Q4.
- AI/semiconductor signal: TSM-manufactured A20 two-nanometer chip designed for on-device AI and agentic workflows.
4. Long-Horizon Macro & Structural Views (🌍)
- Apple foldable is framed as a potential new product category, with sub-$2,000 pricing versus roughly $2,500 consensus as a demand catalyst.
- On-device AI via A20 two-nanometer TSM silicon is viewed as aligned with Apple’s safety/security brand and agentic-workflow ambitions.
- iPhone 18 Pro/Pro Max $100 price increase is treated as within expectations and supportive of high unit sales.
- Q4 foldable supply constraint is acknowledged; 2027 is positioned as the possible blockbuster year.
- Apple’s lack of an active public LLM is not treated as disqualifying; creator cites Apple not owning a search engine while selling a billion iPhones.
- Watch and AirPods are called nice but secondary; the primary question is handset volume and whether foldable becomes a massive category.
5. Scenario Analysis (🔄)
- Bull: Trigger: foldable launches under $2,000 versus roughly $2,500 blogger consensus, driving waiting lists; A20 on-device AI is far ahead of rivals; 2027 becomes a blockbuster foldable year. Supported by The Compound/Josh Brown. Probability/target: Not established by the available evidence.
- Base: Trigger: foldable supply cannot move the Q4 needle; iPhone 18 Pro/Pro Max rise $100 within expectations and sell a ton; Watch/AirPods remain secondary. Supported by The Compound/Josh Brown. Probability/target: Not established by the available evidence.
- Bear: Trigger: referenced Malcolm claim that “there is no AI” is invoked; creator concedes Apple lacks its own LLM or has one internally not really in use; foldable supply is explicitly unable to move Q4. Supported by referenced Malcolm counterpoint and creator concessions. Probability/target: Not established by the available evidence.
- Disagreement is explicit on AI: Bull assumes on-device leadership; Bear rests on the no-AI critique. The source does not reconcile these views or assign probabilities.
6. Chronological Stream (📌)
- [13:52 ET] | The Compound | Josh Brown on Apple’s Foldable iPhone | Claims Apple’s sub-$2,000 foldable, TSM A20 two-nanometer on-device AI, and $100 iPhone 18 Pro/Pro Max price rise support handset demand, though Q4 foldable supply is limited and 2027 is the blockbuster window.
7. Evidence-Bound Watchlist (🎯)
- Foldable launch pricing: confirm whether it is under $2,000 versus roughly $2,500 blogger consensus, and whether waiting lists emerge.
- TSM A20 two-nanometer production and Apple on-device AI/agentic-workflow claims.
- Q4 foldable supply impact, 2027 blockbuster evidence, iPhone 18 Pro/Pro Max $100 increase sell-through, and Apple LLM status.
-
Executive Summary (📰)
Both creators describe markets poised between consolidation and a volatility trigger, but from different time horizons: Jordi Visser (long-horizon) calls the bond “crash” narrative overblown, backs equities on earnings revisions, and frames AI agents plus crypto tokenization as the dominant structural theme; TheChartGuys (short-term) sees tightening “equilibrium” ranges as precursors to a near-term volume/volatility break, without naming an instrument or direction. No creator establishes explicit trade levels, probabilities, or risk/reward ratios. -
Narrative Over Time (⏳)
- ~08:30 ET | Visser — Argues bond-fear is misplaced: 20+ year Treasuries are −3% YTD versus −32% in 2022; junk spreads are at record tights; BVAL is low; inflation swaps are “asleep.” Earnings revisions and margins globally support equities. Nvidia is approaching all-time highs, which Visser treats as a leading indicator for the AI cycle. Introduces the structural thesis: AI agent workflows are no longer optional, and agent-built tokenized portfolios are the key opportunity. Notes Treasury Secretary Bessent expects Japan to act to boost the yen as part of yield-suppression coordination.
- ~10:30 ET | TheChartGuys — Pivots to market microstructure: markets are forming higher lows and lower highs that compress into an “equilibrium.” Claims a trading edge in spotting this pattern and expects a spike in volume and volatility to break the range; opportunity is “limited” during compression and becomes “significant” at the break. No direction, instrument, or timeframe is specified. -
Key Technical Levels & Signals (📈)
- Visser: 20+ year Treasury total return −3% YTD (vs −32% in 2022); SMH +88% Y/Y; Nikkei +52% Y/Y; MSCI World +16% Y/Y; MSCI EM +30% Y/Y; MSCI World Bank Index +29% Y/Y; manufacturing PMI 55; oil near $86 with the 6th contract forward +22% Y/Y; junk spreads at tightest level ever with triple-C spreads widening; S&P essentially unchanged June–September with price above a rising 200-day moving average; Nvidia approaching new all-time highs.
- TheChartGuys: No specific levels, instruments, or price zones cited; only the qualitative pattern of higher lows/lower highs converging into an equilibrium range, with a break confirming on a volume/volatility spike. -
Long-Horizon Macro & Structural Views (🌍)
- Visser: AI agent adoption is a structural inflection point; time for “learning” AI workflows has passed.
- Visser: Tokenization via AI agents can assemble diversified portfolios with strong Sharpe ratios — framed as the most important investment opportunity.
- Visser: Bond-fear narratives are contradicted by low bond volatility, historically tight junk spreads, and the US/Japan government coordination to suppress yields.
- Visser: Global profit margins and earnings revisions argue for holding equities despite headline volatility.
- TheChartGuys: No macro or structural view offered; evidence is purely short-term technical methodology. -
Scenario Analysis (🔄)
- Bull — Supported by Visser. Trigger: Nvidia confirms a new all-time-high close, semiconductor leadership resumes, and US/Japan yield-suppression coordination holds. Probability: Not established by the available evidence. Target: Not established by the available evidence.
- Base — Supported by Visser. Trigger: S&P remains range-bound (essentially unchanged June–September) while consolidation continues and the 200-day moving average catches up; no new highs until after midterms. TheChartGuys’ equilibrium methodology is directionally agnostic and does not contradict this path. Probability: Not established by the available evidence. Target: Not established by the available evidence.
- Bear — Supported only through Visser’s stated risk factors; TheChartGuys is neutral. Trigger: Nvidia fails at resistance, invalidating the AI-trade setup, or a JGB yield breakout proceeds without the assumed Japanese government intervention. Probability: Not established by the available evidence. Target: Not established by the available evidence. -
Chronological Stream (📌)
- [08:30 ET] | Jordi Visser | The Bond Market “Crash” Is a Trap — AI Agents Are About to Ignite Crypto | Bond panic is overblown; AI agents and tokenized portfolios are the structural opportunity, with Nvidia as the leading indicator.
- [10:30 ET] | TheChartGuys | 👀 Let's talk about EQs | Tightening equilibrium ranges signal an imminent volume/volatility break; wait for confirmed direction. -
Evidence-Bound Watchlist (🎯)
- Nvidia price action — verify whether the stock records a confirmed new all-time-high close; treat as the key confirmation of Visser’s AI-cycle view.
- US/Japan coordination — track Treasury Secretary Bessent’s statements and any actual Japanese yen-boosting measures or JGB yield movement; the claim of coordinated yield suppression is unverified.
- Equilibrium break confirmation — monitor major equity indices for converging higher-lows/lower-highs patterns and a subsequent volume/volatility expansion; direction is unspecified and must come from the break itself.
Weekly Intelligence Brief — Sep 6, 2026
1. Executive Summary (📰)
The week ran from a bearish open (bond sell-off, ugly gaps) through a mid-week "structure break" scare, closing with a fragile risk-on tone as labor data printed and the memory-trade rally lifted semis. The dominant opposing macro narratives: US fiscal-debt sustainability bears vs. technology/earnings bulls on AI productivity.
2. Narrative Over Time (⏳)
- Aug 31, pre-market traders cited overnight selling and economic weakness ("rot economy"), while The Compound asked whether the AI CapEx boom is viable. All-In's David Friedberg set up the week's core macro debate: $10T of debt refinancing at higher rates.
- Sep 1 opened ugly — Trade Brigade flagged a global bond sell-off, gap down, "crushing markets." The Compound's episode previewed Snowflake earnings as AI-demand tell, and a sudden Wall Street momentum crash was discussed.
- Sep 2 shortened Labor Day week deepened bearish technical reads: "structure breaking," drift into downtrend. The ChartGuys called the tape a low-volume, uncertain consolidation with key tightening ranges in memory/semis (MU, SNDK, WDC) unresolved.
- Sep 3 weakness remained ("Testing Trump's pullout plan"), but rotation, not retreat, framing emerged. TheChartGuys saw bounce attempts but no follow-through.
- Sep 4 labor report became the critical catalyst — NFP saw reduced reaction as rate-hike odds "chilled." Dan Skelly (Morgan Stanley) argued S&P Q2 earnings (28% index-level growth) reflect sticky tariff pass-through and AI productivity; bears re-argued for austerity/recession risks.
- Sep 5–6 markets turned more constructive: a failed breakdown on SPY weekly chart, memory-stock-led semiconductor reversal. Jordi Visser challenged the "bond crash" narrative, framing AI agents as the emerging theme ahead of CPI and FOMC.
3. Key Technical Levels & Signals (📈)
- 30-Year Treasury 5.2%, average federal debt cost 3.4%, $40T outstanding — All-In / Friedberg.
- SPY monthly measured move target ~$850 from bull-flag breakout — Trade Brigade.
- Failed weekly breakdown on SPY: sellers failed to follow through below prior week's low; bar closed higher (bullish lean) — Trade Brigade.
- Bull break from MU (Micron) / SNDK (SanDisk) tightening ranges expected to lift NQ; bear break signals further semis-led downside — TheChartGuys.
- Semis ratio SMH/QQQ: bulls need to hold weekly lows to avoid a confirmed weekly downtrend — TheChartGuys.
- Gold/silver weekly consolidation "healthy" only if bulls defend current lows and print weekly higher lows — TheChartGuys.
- Other specific index/price levels beyond the above: not established in the available evidence.
4. Long-Horizon Macro & Structural Views (🌍)
- Fiscal solvency risk: Friedberg argues the Fed cannot control the long end given $10T refinancing over 12 months, ~$2T deficit, and 5.2% 30-year yields; every 1% rate move costs ~1.25% of GDP.
- Treasury buybacks: The Compound discussed a government plan to push rates down, noting Druckenmiller's op-ed on debt risk.
- AI capex sustainability is a split: bears question whether demand justifies hyperscaler CapEx with private-credit/neocloud (CoreWeave) leverage; bulls (Visser) see AI agents + tokenization as the largest long-term opportunity.
- Sticky pricing pass-through: companies retained 60–70% of tariff-related increases, supporting margins; the AI-driven "labor lever" is expected within 12–24 months — Skelly.
- Frothy-cycle signals: acquisition/scale-building called "rampant bull-market behavior"; "AI debt binge" flagged — The Compound.
- Broadening: the rotation is "the healthiest thing vs. 2000"; "wall of worry" constructive — The Compound.
- Aging-science-framework and negotiation-theory items (Weinstein; Cain/Voss) are structural, non-market.
5. Scenario Analysis (🔄)
- Bull: Continued tariff pass-through + AI productivity without headcount sustains elevated earnings (Skelly; The Compound's "No recession rest of 2020s"); SPY failed-breakdown confirmed with monthly measured move to ~$850 (Trade Brigade); memory-stock rally holds (TheChartGuys); Snowflake beat-and-raise analogous to prior +38% one-day reaction; Visser sees Nvidia breaking all-time highs while AI agents ignite tokenization. Probabilities/targets: Only Trade Brigade's ~$850 SPY target is literally present.
- Base: Markets remain range-bound/consolidating below decisive breakouts until clear catalysts — CPI on Sep 6 Friday, FOMC to break tightening ranges; low-volume, holiday-distorted tape (TheChartGuys, Trade Brigade). Direction probabilities: not established by the available evidence.
- Bear: US fiscal insolvency risk re-prices higher yields, hurting long-end bonds and equities (Friedberg; Compound's "Druckenmiller" concern); AI debt binge/private-credit stress; Q3 style software "dead-cat bounce"; if Snowflake disappoints or semis/MU ranges break down, August-September downtrend resumes toward a 2022-style repricing (Skelly vs. bear camp conflict). Probabilities: not established by the available evidence. Mixed confidence: Visser's bond-fear dismissal conflicts directly with Friedberg's fiscal-solvency framework.
6. Chronological Stream (📌)
- [Aug 31 01:47] | The Compound | What Happens If the AI Boom Collapses — Ultra-bear case: hyperscaler CapEx and the data-center buildout may not be justified by demand.
- [Aug 31 12:00] | Capital Allocators | Daylian Cain on Theory of Pie — Deal synergy, not market power, defines who can claim half.
- [Aug 31 12:41] | The Compound | Government's Plan to Push Rates Down — Analyzes Treasury buybacks; covers Druckenmiller op-ed, debt risk, Bitcoin, private fraud.
- [Aug 31 14:07] | Trade Brigade | UGLY Pre-Market Start — Claims an ugly open with overnight "supported" selling persisting.
- [Aug 31 16:00] | All-In Podcast | $40T Debt Problem About to Get Worse — $10T refinancing at ~3.4% avg vs. 5.2% 30-year; Fed can't affect long end.
- [Aug 31 22:30] | All-In Podcast | Weinstein on UAPs / nuclear detonations — Speculative; no market carry.
- [Sep 1 04:06] | Stock Market Live | First of Month — Asks if September opens like last month; FOMC flagged.
- [Sep 1 10:30] | Capital Allocators | Chris Voss on No-oriented Questions — Saying no surfaces candid feedback from busy executives.
- [Sep 1 11:30] | Trade Brigade | Global Bond Sell-off Gap Down — Bond sell-off crushing markets; pre-market analysis.
- [Sep 1 14:56] | The Compound | Snowflake Preview + Momentum Crash — Snowflake near-term AI/software tell; debate over software "death."
- [Sep 1 15:24] | The Compound | Ask The Compound 238 — Metadata only; no market claims identified.
- [Sep 1 15:43] | TheChartGuys | Time for Weekly Consolidation? — Bulls stalling at resistance, supports holding — boring sideways.
- [Sep 1 17:22] | All-In Podcast | ROI-KPIs Killing American Science — Structural commentary; non-market.
- [Sep 2 01:58] | Stock Market Live | Sorry September — September worst-month seasonality; high yields, low vol.
- [Sep 2 10:00] | The Compound | Next Michael Burry — Claims no recessions rest of 2020s; AI debt binge risk.
- [Sep 2 11:30] | Trade Brigade | Structure Breaking, Markets Drift Downtrend — Downtrend drift as structure breaks.
- [Sep 2 16:04] | The Compound | Rampant Bull-Market Behavior — Spending-sustainability debate vs. 2000-style froth.
- [Sep 2 21:28] | The Compound | Josh Nailed Snowflake — Snowflake is "ground zero" for agentic AI, reprise of +38% post-earnings pop uncertain.
- [Sep 3 01:44] | TheChartGuys | Imminent Opportunity Ahead — MU/SNDK/WDC tightening ranges set to break; NQ bounce rests on memory/semis.
- [Sep 3 02:26] | Trade Brigade | 2022 Bear Market Incoming? — Rhetorical question; key support/resistance mapped across SPY/QQQ/IWM.
- [Sep 3 02:45] | Stock Market Live | Software vs. Chips vs. Staples — "Rotate rather than retreat"; IGV & SMH earnings are catalysts.
- [Sep 3 11:30] | Trade Brigade | Weakness Remains — Pre-market tests "Trump's pullout plan."
- [Sep 4 03:35] | Stock Market Live | Non Farm Vigilantes — NFP less reactive since rate-hike odds "chilled… for now."
- [Sep 4 10:00] | The Compound | Pick Stocks Like Morgan Stanley — Skelly: tariff pass-through + AI productivity drive 28%/14% EPS.
- [Sep 4 11:26] | The Compound | Stocks, Bonds, or Cash — Cash as flexible choice; one-third of years cash beats stocks over 100 yrs.
- [Sep 4 11:30] | Trade Brigade | Critical Labor Report Reaction — Live reaction to US labor report as key catalyst.
- [Sep 4 16:59] | The Compound | Why Bears Keep Missing — Positive S&P story is earnings, rotation; "wall of worry" keeps bull case open.
- [Sep 4 23:52] | All-In Podcast | GPT-6 / AGI, NYC AI Bans, Venezuela Deal — Model caps + policy + energy geopolitics; mixed macro signals.
- [Sep 5 14:08] | TheChartGuys | Balancing Markets Tighten — FOMC positioned to break tightening ranges.
- [Sep 6 01:56] | Trade Brigade | Are Markets Saved? — Memory trade revives semis; SPY failed breakdown leans bullish, but Friday CPI is swing factor.
- [Sep 6 12:30] | Jordi Visser | Bond Crash Trap; AI Agents → Crypto — Equities supported by earnings; semis near new highs; bond-fear narrative overblown.
- [Sep 6 14:30] | TheChartGuys | Let's Talk About EQs — Equilibrium tightening precedes volume/volatility break; trades may be range-bound until then.
7. Evidence-Bound Watchlist (🎯)
- CPI print (Friday Sep 6): Confirm whether it invalids or validates the bullish failed-breakdown sequence; is the 30-year Treasury yield still ~5.2% and are junk spreads truly at tightest-ever levels?
- Memory-trade follow-through: Watch MU/SNDK/WDC tightening-range breaks and the SMH/QQQ weekly ratio for confirmation or failure.
- Snowflake earnings and AI-capex data: Federal data on the $2T deficit, any Treasury buyback plan announcements, and FOMC guidance remain unresolved claims needing confirmation.
Weekend Intelligence Brief — September 4–6, 2026
1. Executive Summary
The September 4 US labor report was the central catalyst, but creators diverged on its significance: short-term traders (Stock Market Live, Trade Brigade) framed an NFP print with "chilled" rate-hike odds, while The Compound's three Friday videos built a structural bull case on earnings breadth, tariff passthrough, and AI-driven margins. By Sunday, Trade Brigade declared an upward SPY bias after a "failed breakdown," citing semiconductor leadership and a $850 monthly measured-move target, with Friday's CPI report flagged as the key risk.
2. Narrative Over Time
- Sep 4, pre-NFP (before 8:30 AM ET): Stock Market Live opened its live stream (11:35 PM ET Sep 3) claiming NFP would be less market-reactive than typical since rate-hike odds had "chilled...for now." Trade Brigade's pre-market prep (7:30 AM ET) framed the same labor report as "CRITICAL" for futures and options traders.
- Sep 4, mid-morning (6:00–7:26 AM ET): The Compound published two long-horizon segments — Dan Skelly's Morgan Stanley playbook (S&P 500 earnings +28% index / +14% median, tariff passthrough retained at 60–70%) and Josh/Duncan's stocks-vs-bonds-vs-cash debate (Josh favors cash's optionality despite stocks' expected-return edge).
- Sep 4, afternoon–evening (12:59–7:52 PM ET): Post-NFP, The Compound pressed the bull case: "the next 20% the S&P" is missed by bearish over-indexing, rotation is "the healthiest thing versus 2000," and earnings rise without headcount. All-In pivoted to AI policy and tech sentiment: GPT-6 Astra AGI claims, NYC's K-8 AI ban, US–Venezuela oil deal.
- Sep 5 (10:08 AM ET): TheChartGuys offered a quieter Saturday read: markets in balancing/tightening ranges with FOMC positioned to break them; direction unspecified.
- Sep 5, late (9:56 PM ET): Trade Brigade synthesized the post-NFP tape: memory-trade strength (Micron, SanDisk) "revived" semiconductors; SPY weekly "failed breakdown" implies upward bias; CPI on Friday is the next trigger.
3. Key Technical Levels & Signals
| Level / Signal | Creator | Notes |
|---|---|---|
| SPY ~$850 | Trade Brigade (Sep 6) | Monthly measured-move target from bull-flag breakout |
| SPY weekly "failed breakdown" | Trade Brigade | Sellers did not follow through below prior week's low; bar closed higher (bullish, no level cited) |
| Hourly inverted head-and-shoulders trigger | Trade Brigade | Activated Thursday via gap-and-go (no level cited) |
| SPY monthly bar: upper-third close, higher high/low above breakout | Trade Brigade | No level cited |
| NASDAQ "junk drawer" | Trade Brigade | Index still range-bound; semiconductors "waking back up" |
| Tightening/balancing ranges | TheChartGuys (Sep 5) | No index, ticks, or levels disclosed (metadata-only) |
| NFP release as catalyst | Stock Market Live (Sep 4) | No levels given (metadata-only) |
Additional technical specifics were not established by the available evidence.
4. Long-Horizon Macro & Structural Views
- Earnings breadth (Skelly, The Compound): Q2 S&P earnings growth of 28% (index) vs. 14% (median) implies broadening beyond megacap tech; "incredible" 15% revenue growth versus 6% nominal GDP.
- Pricing power persistence (Skelly): Companies retained 60–70% of tariff-driven price increases; rolling them back would break the bull case.
- AI labor lever (Skelly): A productivity/margin uplift from AI-enabled no-hire/no-fire operations is expected in 12–24 months; not yet visible in data.
- Capital rotation (Skelly; Bears video): Sector rotation labeled "healthiest thing versus 2000"; sentiment shifted from FOMO to "50/50"; "wall of worry" supportive.
- Cash vs. bonds vs. stocks (Josh/Duncan): Bonds yield ~5%, cash ~3.5% with zero volatility; Josh favors cash, Duncan prefers stocks — an allocation fork with no consensus.
- Automated factory CapEx (Bears video): Manufacturing investment is real but increasingly automated; the 18–35 workforce cohort cannot fill all demand — claims require employment-data verification.
- AI policy (All-In): GPT-6 Astra "AGI" claim (Brockman via WaPo, unverified); NYC K-8 school AI ban; US–Venezuela oil deal with undisclosed terms; "Tech Euphoria 2.0."
5. Scenario Analysis
Three consolidated paths across all eight sources:
-
Bull path: SPY holds its weekly "failed breakdown" structure and pushes toward the $850 monthly measured-move target (Trade Brigade). Supporting evidence would include semiconductor leadership from Micron/SanDisk continuing, a benign CPI print Friday, and — structurally — sustained earnings growth without headcount plus sticky tariff pricing and AI CapEx continuity (Skelly, Bears video). Probability: Not established by available evidence (Trade Brigade's directionality is qualitative despite the numeric target).
-
Base path: Markets remain in tightening/balancing ranges until the FOMC breaks them — direction unresolved (TheChartGuys, Sep 5). This reconciles with Trade Brigade's "junk drawer" NASDAQ characterization: sector rotation provides leadership while the index consolidates. Skelly's tariff-broadening thesis and Josh's cash-over-stocks caution both support a range-bound, two-way tape into CPI.
-
Bear path: A hot CPI report on Friday could "pressure the market lower" and invalidate the bullish technical setup (Trade Brigade's stated risk). Stock Market Live's framing — that rate-hike odds remain "chilled...for now" — implies a hot print could re-accelerate hike pricing. Structurally, the bear case rests on Skelly's own caveats: pricing-power rollback or AI "boogeyman" reassertion; or, per All-In, expanded AI bans/regulation (NYC precedent) or a US–Venezuela deal collapse. Probability: Not established.
6. Chronological Event Log
- [2026-09-03 23:35 ET] | Stock Market Live | NFP stream opens; creator expects subdued reaction because rate-hike odds have "chilled...for now."
- [2026-09-04 06:00 ET] | The Compound | Skelly: Q2 earnings +28% index/+14% median; tariff passthrough not given back; AI labor lever 12–24 months out.
- [2026-09-04 07:26 ET] | The Compound | Josh picks cash over stocks/bonds despite stocks' long-run expected return; bonds at ~5%, cash ~3.5%.
- [2026-09-04 07:30 ET] | Trade Brigade | Pre-market live prep for "CRITICAL" US labor report; futures/options audience.
- [2026-09-04 12:59 ET] | The Compound | Post-NFP bull case: earnings rise without headcount; rotation healthier than 2000; "the next 20% the S&P" miss risk.
- [2026-09-04 19:52 ET] | All-In Podcast | GPT-6 Astra AGI claim (unverified); NYC K-8 AI ban; Venezuela oil deal; Polymarket AI-sentiment events.
- [2026-09-05 10:08 ET] | TheChartGuys | Balancing markets tighten; FOMC positioned to break ranges; scenarios "still shape up."
- [2026-09-05 21:56 ET] | Trade Brigade | Memory trade (Micron/SanDisk) revives semis; SPY weekly failed breakdown → upward bias; $850 measured move; CPI Friday is the risk.
7. Watchlist
- CPI report (Friday, Sep 11): The single most-cited catalyst across sources; will test Trade Brigade's bull structure and Stock Market Live's "chilled" rate-hike claim. Verify print vs. consensus before weighing direction.
- Semiconductor leadership (Micron, SanDisk): Confirmation needed that the memory trade persists as sector leadership; watch for follow-through in breadth beyond semis.
- SPY $850 measured-move target: Requires monthly close validation; no stop/invalidation level was cited by Trade Brigade.
- FOMC range-break (TheChartGuys): Determine which indices/ranges are referenced and the direction of any break before assigning meaning.
- GPT-6 Astra "AGI" claims (All-In): Third-party benchmark results and OpenAI technical documentation would confirm or refute the WaPo-sourced Brockman claim.
- Earnings breadth confirmation (Skelly): Next quarters' index vs. median EPS print will validate the 28%/14% broadening signal; also watch earnings-call commentary on tariff price retention.
- AI labor-lever data (Skelly): Headcount, productivity, and AI-adoption statistics can validate or falsify the 12–24 month margin thesis.
- NYC K-8 AI ban expansion (All-In): Track rollout and replication in other jurisdictions; paired with Polymarket's AI-safety-bill and best-model odds as sentiment barometers.
- US–Venezuela oil deal: Terms and legislative/sanctions path are undisclosed; monitor official statements for supply implications.
- Factory employment vs. automation investment (Bears video): Scrutinize 18–35 labor-force participation and factory construction data to test the "automated factories" claim.
Daily Market Intelligence Brief
Date Range: 2026-09-05 (both videos published same session)
1. Executive Summary (📰)
Creators describe a compressed, range-bound tape awaiting macro catalysts: TheChartGuys flag tightening balances ahead of FOMC, while Trade Brigade finds constructive SPY structure into Friday CPI, leaning bullish with a $850 monthly measured-move target.
2. Narrative Over Time (⏳)
- 10:08 ET — TheChartGuys (metadata-only evidence): Markets are in tightening/balancing ranges; the FOMC is positioned as the near-term catalyst to break them. Scenario probabilities are still "shaping up," with no directional lean stated.
- 21:56 ET — Trade Brigade (transcript evidence): Late-session creator commentary turns explicitly constructive. Friday's memory-trade rally (Micron, SanDisk) revived semiconductors after hot NFP data pressured markets; SPY's "failed breakdown" on the weekly and a triggered hourly inverted head-and-shoulders underpin upward bias into CPI.
- Agreement/Evolution: Both creators converge on a compressed-tape premise; sentiment shifted from directionally neutral (ChartGuys, FOMC-focused) to constructive-with-event-risk (Trade Brigade, CPI-focused) across the day. No creator expressed sustained bearish conviction, though Trade Brigade flags hot CPI as the explicit invalidation risk.
3. Key Technical Levels & Signals (📈)
- SPY monthly measured move from bull-flag breakout: ~$850 (Trade Brigade).
- SPY weekly "failed breakdown": sellers did not follow through below prior week's low; bar closed higher, leaning bullish (Trade Brigade).
- SPY hourly: inverted head-and-shoulders triggered upward via a "gap and go" on Thursday (Trade Brigade).
- Monthly bar: closed in the upper third, above breakout level, printing a higher high/higher low (Trade Brigade).
- NASDAQ: remains in the "junk drawer," but semiconductors are waking up (Trade Brigade).
- ChartGuys levels: unavailable — any specific tickers or range boundaries were not present in metadata-only evidence.
4. Long-Horizon Macro & Structural Views (🌍)
- Semiconductor leadership via memory trade — Micron/SanDisk strength is cast as the sector driver reviving index upside despite labor-data pressure (Trade Brigade).
- Macro event sequencing — FOMC and CPI are treated as the range-break triggers that determine near-term regime (both creators, respectively).
- Categorization framework — markets classified as balance/consolidation rather than trending; the phase shift back to trend awaits catalyst confirmation (ChartGuys).
- No other structural or top-down capital-allocation views presented in available evidence.
5. Scenario Analysis (🔄)
- Bull — Trigger: SPY holds the failed-breakdown weekly low and confirms upside through Thursday's gap-and-go; CPI does not surprise hot; memory-trade leadership (Micron/SanDisk) persists to extend the semiconductor advance. Support: Trade Brigade (ChartGuys neutral, direction unspecified). Target: ~$850 monthly measured move (Trade Brigade). Probability: Not established by the available evidence.
- Base — Trigger: Markets remain in tightening/balancing ranges; FOMC becomes the deciding catalyst; probabilities still "shaping up." Support: TheChartGuys (Trade Brigade does not arbitrate a base path). Target/Probability: Not established by the available evidence.
- Bear — Trigger: A hot Friday CPI print pressures markets lower and invalidates the bullish SPY setup (Trade Brigade); alternatively, FOMC breaks ranges downward (ChartGuys — direction uncited, indeterminate). Target/Probability: Not established by the available evidence. Disagreement: ChartGuys explicitly avoids a directional call, so the two creators cannot be said to conflict here; they differ in specificity only.
6. Chronological Stream (📌)
- [10:08 ET] | TheChartGuys | Balancing Markets Tighten | FOMC set to break tightening/balancing ranges; most likely scenarios still taking shape. (Metadata-only evidence — levels and direction not verified.)
- [21:56 ET] | Trade Brigade | Are Markets Saved? | SPY failed breakdown plus memory-trade semi revival lean bullish into CPI, with $850 monthly target and hot CPI as invalidation risk. (Transcript evidence.)
7. Evidence-Bound Watchlist (🎯)
- Friday CPI report — the designated catalyst; magnitude and surprise direction vs. expectations will test the Trade Brigade bullish setup.
- SPY price action around prior weekly low — confirm whether buyers defend the failed-breakdown structure or a follow-through lower invalidates it.
- Semiconductor memory trade (Micron, SanDisk) — monitor continuation of leadership as the sector-confirmation signal.
- FOMC meeting announcement — TheChartGuys' cited range-break catalyst; watch for which direction, if any, ranges resolve.
Weekend Intelligence Brief — September 6, 2026
Note on times: All ET times below are converted from the UTC publication stamps cited in the source material (UTC−4).
1. Executive Summary (📰)
The weekend's dominant dispute is whether heavy corporate/AI spending is a durable growth engine or late-cycle froth pricing in unsustainable outcomes, with valuations questioned and M&A behavior flagged as "rampant bull market" signals. On the technical side, a Labor-Day-thinned consolidation has left indices holding support without follow-through, making semiconductor/memory range-breaks and the Sept 4 labor report the decisive near-term catalysts — though several creators expect the NFP reaction to be muted. Structurally, GPT-6/AGI claims and an NYC school AI ban added policy and sentiment color to the AI cycle debate.
2. Narrative Over Time (⏳)
- Wed Sept 2 (12:04–17:28 ET): The Compound opened the sustainability debate — bulls: continued heavy spending prevents an economic slowdown; bears: spending is unsustainable and valuations "make no sense" (previously validated) — then pivoted to Snowflake as "ground zero for the agentic future," citing the prior quarter's +38% one-day surge as precedent.
- Wed night Sept 2 (21:44–22:45 ET): TheChartGuys mapped a holiday-thinned consolidation: SPY/NQ confirmed daily downtrends with no follow-through, memory ranges (MU, SNDK, WDC) tightening toward a directional break. Trade Brigade's metadata titled "2022 Bear Market Incoming?" while Stock Market Live framed "rotate rather than retreat," keyed to upcoming IGV/SMH earnings.
- Thurs Sept 3 (07:30 ET): Trade Brigade's pre-market claimed "WEAKNESS REMAINS" as markets tested "Trump's pullout plan."
- Thurs night/Fri morning (23:35–07:30 ET): Stock Market Live argued NFP would be less reactive because rate-hike odds had "chilled...for now." The Compound's Morgan Stanley interview attributed Q2's 28% index-level vs 14% median earnings growth to sticky tariff passthrough (60–70% retained) and AI productivity; a separate segment weighed stocks vs bonds vs cash. Trade Brigade ran a "CRITICAL Labor Report" pre-market.
- Fri Sept 4 (12:59–19:52 ET): The Compound argued bears "miss the next 20% the S&P" when over-indexing to negative narratives; rotation was called the "healthiest thing versus 2000." All-In closed with GPT-6 AGI claims, NY school bans, and a US–Venezuela oil deal. No video in this set reported actual NFP results.
3. Key Technical Levels & Signals (📈)
All levels below are as attributed; none are independently verified.
- SPY: Previous ATH defended by bulls; daily downtrend confirmed with no follow-through; weekly 12-EMA holds; backtest of prior ATH described as clean (TheChartGuys).
- NQ: Slightly lower low without follow-through; value-area low defended; weekly bull-flag potential; a 4-hour uptrend is the precondition for a daily bounce, with a lower high "most likely" given current damage (TheChartGuys).
- MU / SNDK / WDC: Tightening ranges set to break; an early-August MU range-break preceded a solid NASDAQ bounce; SNDK stronger vs WDC (TheChartGuys).
- SMH/QQQ ratio: Weekly downtrend confirmation would signal sustained semiconductor relative weakness; bulls must hold lows (TheChartGuys).
- Gold/Silver: After a 20% gold / 50% miner run, weekly consolidation is "do-or-die" — bulls must print a weekly higher low or the consolidation turns unhealthy (TheChartGuys).
- TSLA: "Haphazard" daily uptrend (+23%); weekly 12-EMA respected keeps it constructive (TheChartGuys).
- MAGS/SPY: At weekly equilibrium; lower high would signal mega-cap relative weakness (TheChartGuys).
- PLTR: Stop-out cited at 16618, day's bounce +2.82% (TheChartGuys; level as cited, ticker-format ambiguity unresolvable from source).
- Rates/yields: Bonds ~5%, cash ~3.5% with zero volatility (The Compound, thought-experiment framing).
- Trade Brigade's SPY/QQQ/IWM levels and Sept 3 "2022 bear market" triggers are not established — metadata only, no figures in evidence.
4. Long-Horizon Macro & Structural Views (🌍)
- Earnings resilience without headcount: S&P 500 Q2 growth cited at 28% (index) vs 14% (median) on ~15% revenue growth vs ~6% nominal GDP; productivity gains and a 12–24-month AI labor "lever" still ahead (The Compound/Morgan Stanley interview).
- Sticky tariff passthrough: Companies retained 60–70% of tariff-driven price increases rather than reversing them — a "presumption" the analyst aims to prove, not an established fact (The Compound).
- Spending-supercycle debate: Bull: sustained heavy spending keeps growth going. Bear: it is unsustainable and valuations make no sense; asset-manager M&A/custodian scale-building is a froth tell (The Compound, "Animal Spirits").
- Sector broadening as cycle support: Current rotation termed the "healthiest thing versus 2000"; sentiment "pensive," a "wall of worry" — versus late-cycle warnings from the same franchise (The Compound).
- Automation over labor: Factory CapEx real, but manufacturing jobs may not follow; no technical incentive to draw down CapEx while outputs improve (The Compound).
- AI structural headlines: GPT-6 "AGI" claim (unverified), NYC K-8 AI ban, US–Venezuela oil deal, Polymarket odds tracked on best AI model and AI-safety bill (All-In, metadata).
- Institutional business-mix shift: Morgan Stanley wealth revenues cited from ~8% of firm revenues (2005) to ~60% pro forma (The Compound/Morgan Stanley interview).
5. Scenario Analysis (🔄)
Bull — Trigger: heavy corporate/AI spending persists, memory/semiconductor ranges break upward (MU, SNDK, WDC), NFP reacts mildly, and earnings continue outrunning headcount growth. Supporters: The Compound (multiple), TheChartGuys (conditional). Target: The Compound claims bears "miss the next 20% the S&P" — cited as their claim, unquantified and unverified. Probability: Not established by the available evidence.
Base — Trigger: continued low-volume consolidation into fall; SPY holds near prior ATH without follow-through; NFP is absorbed with reduced reactivity as rate-hike odds stay "chilled." Supporters: TheChartGuys, Stock Market Live. Probability: Not established by the available evidence.
Bear — Trigger: spending proves unsustainable; semiconductor ranges break downward confirming an SMH/QQQ weekly downtrend; gold/silver lose their lows; Trade Brigade's rhetorical "2022 Bear Market Incoming?" gains technical support. Supporters: The Compound's bear case ("Animal Spirits"), TheChartGuys' bear branch, Trade Brigade (headline only). Disagreement: The Compound itself splits both ways; Trade Brigade's bear framing is metadata-only and unverified. Probability: Not established by the available evidence.
6. Chronological Event Log (📅)
- [2026-09-02 12:04 ET] The Compound | Sustained-spending bull case vs "unsustainable" bear case on extreme valuations; M&A flagged as bull-market froth. https://www.youtube.com/watch?v=Afe_EKoZ_Cs
- [2026-09-02 17:28 ET] The Compound | Snowflake "ground zero for agentic AI"; prior +38% earnings pop cited as precedent. https://www.youtube.com/watch?v=oZENIu7YZdw
- [2026-09-02 21:44 ET] TheChartGuys | SPY/NQ downtrends lack follow-through; MU/SNDK/WDC range-breaks are the swing factor. https://www.youtube.com/watch?v=WjPbTiig264
- [2026-09-02 22:26 ET] Trade Brigade [metadata-only] | "2022 Bear Market Incoming?" — levels/game plan not in evidence. https://www.youtube.com/watch?v=HOhzUFQYTO0
- [2026-09-02 22:45 ET] Stock Market Live [metadata-only] | "Rotate rather than retreat"; IGV/SMH earnings keyed as catalysts. https://www.youtube.com/watch?v=GrYlnzg6NTg
- [2026-09-03 07:30 ET] Trade Brigade [metadata-only] | Pre-market: "weakness remains," markets test "Trump's pullout plan." https://www.youtube.com/watch?v=WLcYJjNjaQE
- [2026-09-03 23:35 ET] Stock Market Live [metadata-only] | NFP central but less reactive as rate-hike odds "chilled." https://www.youtube.com/watch?v=sqEfLvN41_U
- [2026-09-04 06:00 ET] The Compound | Tariff passthrough + AI productivity drive the 28%/14% earnings split; labor lever 12–24 months out. https://www.youtube.com/watch?v=hpTOnDgTjHQ
- [2026-09-04 07:26 ET] The Compound | Cash preferred over stocks for flexibility; stocks beat 100-year frequency view. https://www.youtube.com/watch?v=fQIorYQNT2Y
- [2026-09-04 07:30 ET] Trade Brigade [metadata-only] | "CRITICAL Labor Report" pre-market; claims require full video. https://www.youtube.com/watch?v=We1X1kZrya8
- [2026-09-04 12:59 ET] The Compound | Earnings up without headcount; rotation "healthiest vs 2000"; bears risk missing "next 20%." https://www.youtube.com/watch?v=NfzKHHFN1OM
- [2026-09-04 19:52 ET] All-In [metadata-only] | GPT-6 "AGI" claim; NYC school AI ban; US–Venezuela oil deal. https://www.youtube.com/watch?v=DvFe9bR2eHA
7. Watchlist (🎯)
- Labor-report aftermath: No creator in this set reported actual NFP figures. Verification needed: actual print vs consensus and whether market reaction matched the "chilled rate-hike odds" forecast (Stock Market Live, Trade Brigade).
- Semiconductor/memory range-breaks (MU, SNDK, WDC) and SMH/QQQ ratio: TheChartGuys' bull/bear branches bifurcate here; a weekly downtrend confirmation in the ratio would validate sustained relative weakness.
- Earnings-breadth confirmation: Next quarters' S&P index-vs-median EPS growth and management commentary on tariff-pricing retention (The Compound/Morgan Stanley thesis).
- AI capex and policy signals: GPT-6 third-party benchmark results, NYC DOE policy scope, US–Venezuela oil-deal terms, and shifts in Polymarket AI-safety odds (All-In, metadata-only).
- Froth indicators: M&A and custodian-consolidation headlines as "rampant bull market" tells (The Compound); MAGS/SPY relative strength for mega-cap leadership risk (TheChartGuys).
- Housing/inflation linkage: Monitoring whether housing activity accelerates inflation — flagged by The Compound but with no metric or timeframe supplied; requires external data before weighing.
Items flagged [metadata-only] derive from titles/descriptions only; their specific claims must be validated against full video content before being treated as evidence.
Daily Intelligence Brief — September 4, 2026
1. Executive Summary (📰)
Two non-overlapping sentiment tracks framed the session: The Compound defended S&P upside as earnings- and rotation-driven (warning that negative-narrative investors risk missing "the next 20% the S&P"), while All-In pivoted to tech-policy shocks — an unverified GPT‑6 "AGI" claim, a NYC school AI ban, and a US-Venezuela oil deal. Neither creator supplied quantifiable price levels, probabilities, or position frameworks; all forward claims remain evidence-light.
2. Narrative Over Time (⏳)
- 12:59 ET — The Compound frames equities as structurally resilient. Posits that S&P strength is not one macro narrative but persistent earnings-without-headcount gains, automated factory CapEx, AI/data-center spending, and a rotation deemed "healthiest… versus 2000." The prevailing mood is characterized as "pensive," not bearish. No numeric price, valuation, or EPS level is offered in support.
- 19:52 ET — All-In shifts the narrative to AI tipping-points and policy friction. GPT‑6 Astra's release is paired with an AGI claim (quoted to Greg Brockman via WaPo), counterbalanced by NYC's K‑8 AI ban, a "sobering siren" Altman interview (Axios), and a Bernie Sanders AI-ban discussion. A US-Venezuela oil deal introduces a geopolitics/energy subplot. Brevity of the timeline is a function of sequential releases, not a single evolving sentiment path; the two creator tracks did not directly contest one another.
3. Key Technical Levels & Signals (📈)
- No price levels, stop-losses, targets, or oscillator signals were cited by either creator.
- The Compound — "the next 20% the S&P": directional claim only; no entry index level, EPS path, or multiple basis provided. Not independently verifiable from source material.
- The Compound — 2000 cycle analogy: qualitative structural signal ("healthiest [rotation]… versus 2000"), not a level or defined breadth threshold.
- All-In — no technical signals; referenced event catalysts (GPT‑6 Astra, Polymarket questions on "best AI model end of 2026" and "US AI safety bill before 2027") carry no reported odds or figures.
- All-In — US-Venezuela oil deal: cited as a macro driver without supply-quantity, pricing, or legislation terms in available metadata.
4. Long-Horizon Macro & Structural Views (🌍)
- Earnings without headcount growth (The Compound): Rising output per worker underpins the equity thesis; headcount is not needed for margin expansion.
- Automation-led factory CapEx (The Compound): New factories will be substantially automated; the 18–35 labor cohort may not fill roles, dampening the employment pass-through.
- AI/data-center CapEx persistence (The Compound): With outputs "getting better," there is no technical incentive to draw down CapEx — but benefits are concentrated, captured by the creator's metaphor that "Shake Shack is not supplying french fries to data centers."
- Rotation breadth (The Compound): Broadening leadership versus late-2000 concentration is read as healthy cycle support.
- AI euphoria vs. policy adoption risk (All-In): AGI claims fuel "Tech Euphoria 2.0" while NYC's K‑8 AI ban and legislative pushes (Sanders) signal potential regulatory diffusion.
- Energy geopolitics (All-In): US-Venezuela oil deal could shift crude supply and regional alignment; terms undisclosed.
5. Scenario Analysis (🔄)
- Bull: Sustained earnings-without-headcount plus continued data-center/factory CapEx lets the S&P deliver the claimed additional upside (The Compound); All-In's bull requires independent third-party verification of GPT‑6 "AGI" claims and failure of a US AI-safety bill before 2027. Probability/target: Not established by the available evidence.
- Base: A resilient economy, "wall of worry" sentiment, and healthy rotation persist (The Compound); in All-In's base case, the AGI claim is contested but industrial adoption accelerates while school bans stay localized and the Venezuela deal proceeds without legislative blockage. Probability/target: Not established by the available evidence.
- Bear: The negative narrative wins if CapEx is drawn down or automation/demographic mismatch bites (The Compound's stated bear case); All-In flags bear contagion if NYC-style AI bans expand, AI-safety legislation gains momentum, or the oil deal collapses over sanctions. Disagreement noted: All-In treats policy/regulatory spread as a live risk; The Compound explicitly sees positioning as overweight negative narratives, a partial conflict neither creator resolves.
6. Chronological Stream (📌)
- [12:59 ET] | The Compound | Why the Bears Keep Missing This Market (https://www.youtube.com/watch?v=NfzKHHFN1OM) | S&P resilience rests on productivity-led earnings, automated factory CapEx, and healthy rotation; dismisses negative-narrative crowding.
- [19:52 ET] | All-In Podcast | GPT‑6 Hits AGI? Tech Euphoria 2.0, SF Mansion Shortage, NYC Bans AI in Schools & Venezuela Oil Deal (https://www.youtube.com/watch?v=DvFe9bR2eHA) | GPT‑6 "AGI" claim tempered by school AI bans, AI-safety politics, and a pending oil deal.
7. Evidence-Bound Watchlist (🎯)
- S&P upside verifiability: Test The Compound's "next 20%" claim against a concrete index level, consensus EPS path, and multiple assumptions — none established in the cited material.
- GPT‑6 Astra verification: OpenAI technical documentation and third-party benchmark results to validate or refute the Wagner/Greg Brockman AGI claim reported by WaPo.
- Policy-friction scale: NYC DOE implementation timeline and any spread of K‑8 AI bans to other jurisdictions; also any official release of US-Venezuela deal terms (the All-In portion is metadata-only and carries no disclosed conditions).
Daily Intelligence Brief — Thursday, September 4, 2026
1. Executive Summary (📰)
Today's dominant near-term catalyst is the September 4 US labor report, with creator sentiment split between muted-expectation framing (rate-hike odds "chilled") and "critical event" urgency. Long-horizon commentary stands apart, focused on tariff price passthrough, earnings breadth, and AI-driven margin expansion.
2. Narrative Over Time (⏳)
- 11:35 PM ET (Sep 3) — Stock Market Live opens its live stream ahead of the NFP print, arguing the report "may trigger less market movement than typical" because rate-hike odds have cooled. No levels or positions disclosed.
- 6:00 AM ET — Dan Skelly (The Compound) shifts narrative from the single event to structural earnings: Q2 S&P 500 index-level growth of 28% vs. 14% median-company growth reflects tariff price passthrough plus AI productivity on a no-hire/no-fire workforce.
- 7:26 AM ET — The Compound panel debates stocks vs. bonds vs. cash on 100-year outperformance frequencies; Josh chooses cash for flexibility despite stocks' highest expected long-run return, while Duncan selects stocks.
- 7:30 AM ET — Trade Brigade opens live pre-market prep, labeling the labor report "CRITICAL" and tracking real-time futures/options reaction.
3. Key Technical Levels & Signals (📈)
- No tickers, price levels, zones, or signals are disclosed in any of the four source summaries. Stock Market Live and Trade Brigade reference live trading platforms and chart-based analysis, but no specific setup, entry, stop, or target appears in the available evidence. Treat all four videos as lacking quantitative technical content.
4. Long-Horizon Macro & Structural Views (🌍)
- Tariff passthrough is sticky (Skelly): Companies retained 60–70% of tariff-related cost increases and have not given pricing back; this is framed by Skelly as a "presumption" he seeks to prove, not an established fact.
- Earnings breadth (Skelly): Q2 index-level S&P growth (~28% YoY) far outpaced median-company growth (~14% YoY); Q2 revenue growth of ~15% versus ~6% nominal GDP is called "incredible."
- AI labor lever (Skelly): A no-hire/no-fire workforce has persisted for "a couple of years"; AI-driven margin uplift from reduced labor needs is projected to hit within 12–24 months.
- Allocation framework (Josh and Duncan): Cash is characterized as yielding ~3.5% with zero volatility; bonds ~5%; stocks carry the highest long-run expected return. Josh cites historical frequency claims — cash beat stocks about one-third of years, bonds beat stocks ~3.5 of every 10 years — as his rationale for choosing cash's optionality. DunDuncan prefers stocks.
- Firm-level shift (Skelly): Morgan Stanley wealth management grew from ~8% of firm revenues (2005) to ~60% pro forma post–Smith Barney, E*TRADE, and Morgan Stanley at Work.
5. Scenario Analysis (🔄)
- Bull Path — Trigger: AI productivity continues to compound and the projected 12–24 month "labor lever" materializes as genuine margin uplift, extending elevated index and median earnings growth. Supported by Skelly (Video #2). Probability: Not established by the available evidence. Targets: None provided.
- Base Path — Trigger: Economy remains resilient; tariff price passthrough sticks; earnings broadening persists without a recession trigger. Supported by Skelly (Video #2). Probability: Not established by the available evidence. Targets: None provided.
- Bear Path — Trigger: Pricing power breaks (companies forced to give back tariff hikes) or AI "boogeymen" (labor/software apocalypse) reassert, deepening any leadership/rotation implosion. Supported by Skelly (Video #2). Probability: Not established by the available evidence. Targets: None provided.
Note: Videos #1, #3, and #4 contain no scenario tables, probabilities, or targets in the available evidence; no cross-creator disagreement on scenario structure can be established.
6. Chronological Stream (📌)
- 11:35 PM ET (Sep 3) | Stock Market Live | Non Farm Vigilantes – SEP 4 Stock Market LIVE | NFP is the catalyst but rate-hike odds are "chilled," potentially muting reaction.
- 6:00 AM ET | The Compound | How to Pick Stocks Like Morgan Stanley (TCAF 258) | Q2 S&P earnings growth (28% index / 14% median) reflects sticky tariff passthrough and AI productivity with a labor lever still 12–24 months out.
- 7:26 AM ET | The Compound | Stocks, Bonds, or Cash: What Would You Choose? | Cash's flexibility beats stocks' long-run return; cash historically beat stocks in ~one-third of years.
- 7:30 AM ET | Trade Brigade | [LIVE] Pre-Market Prep – CRITICAL Labor Report Live Market Reaction | Live pre-market technical read for futures and options traders ahead of the labor report.
7. Evidence-Bound Watchlist (🎯)
- NFP print vs. consensus — Verify actual September 4 labor report figures against expectations; then compare any market reaction to Stock Market Live's "chilled rate-hike odds" claim.
- Rate-hike odds movement — Track fed funds futures pricing to confirm or refute the claim that hike probabilities remain "chilled...for now."
- Tariff-pricing commentary — Monitor next earnings calls for announcements of price rollbacks, which would invalidate Skelly's 60–70% passthrough-stickiness assumption, versus reaffirmed pricing power.
Daily Intelligence Brief — September 3, 2026
1. Executive Summary (📰)
Creators describe a low-volume, pre-Labor-Day market in consolidation, torn between "rotating rather than retreating" (Stock Market Live) and persistent pre-market weakness (Trade Brigade). Semiconductors and memory names are the designated pivot for the next directional move; the only long-horizon projection (The Compound) is an unresolved debate over whether heavy corporate spending sustains growth or signals froth.
2. Narrative Over Time (⏳)
- Sep 2, 16:04 UTC (The Compound) — Opens the cycle on a macro debate: sustained corporate spending carries growth while bears call the spending and "nonsensical" valuations unsustainable. The creator was defending a prior bearish call as "dead right."
- Sep 2, 21:28 UTC (The Compound) — Shifts to single-name focus: Snowflake's prior beat-and-raise produced a +38% next-day move; Dell's +12% after-hours margin-gain response is cited as evidence the market prices margin expansion ahead of reports.
- Sep 3, 01:44 UTC (TheChartGuys) — Most detailed read: daily downtrends confirmed in SPY/NQ with no follow-through, bulls defending prior ATH and value-area lows. Memory names (MU, SNDK, WDC) in tightening ranges "set to break"; SMH/QQQ ratio at a weekly make-or-break. Gold/silver described as "do-or-die" weekly consolidations. AVGO's bearish earnings bought back up.
- Sep 3, 02:26 UTC (Trade Brigade) — Headlines "2022 Bear Market Incoming?"; metadata only, no levels extracted.
- Sep 3, 02:45 UTC (Stock Market Live) — Live stream; thesis is "rotate rather than retreat," with IGV (software) and SMH (semis) earnings as dominant catalysts.
- Sep 3, 11:30 UTC (Trade Brigade) — Pre-market live segment: "WEAKNESS REMAINS — Markets Test Trump's Pullout Plan." Metadata only; catalyst reference ambiguous.
3. Key Technical Levels & Signals (📈)
- SPY — confirmed daily downtrend, no follow-through; bulls defend prior all-time high; weekly 12 EMA holds; backtest of prior ATH "clean" (TheChartGuys).
- NQ — slightly lower low, no follow-through; bulls defend value-area low; requires a 4-hour uptrend to trigger a daily bounce (~user timeframe daily); creator assesses a lower high as most likely on next bounce given current damage (TheChartGuys).
- MU / SNDK / WDC — tightening ranges; MU range on DRAM "never had a tightening range like this"; SNDK strongest (attempting breakout); WDC weakest vs peers. Early-August MU break preceded a solid NQ bounce (TheChartGuys).
- SMH/QQQ ratio — weekly downtrend confirmation would signal sustained semis weakness; bulls must hold lows; upside break would form monthly higher low (TheChartGuys).
- MAGS/SPY — at weekly equilibrium; a weekly lower high in the ratio would signal mega-cap tech relative weakness (TheChartGuys).
- TSLA — "haphazard" daily uptrend (+23% move); follows weekly 12 EMA; bears need to break that level (TheChartGuys).
- PLTR — daily lower-low no-follow-through; creator's stop hit at 16,618; day bounce +2.82% (TheChartGuys).
- Gold / Silver — weekly consolidation healthy only if bulls print a weekly higher low; another leg down would be "unhealthy" (TheChartGuys).
- MRNA — tightening daily range; +10% day inside the "mother bar"; breakout required for direction (TheChartGuys).
- Exact support/resistance numbers for SPY, QQQ, IWM, and sector levels: unavailable (Trade Brigade metadata only).
4. Long-Horizon Macro & Structural Views (🌍)
- Spending sustainability (The Compound) — Bull: continued heavy spending prevents economic slowdown. Bear: spending is unsustainable, late-cycle; M&A and custodian consolidation are "rampant bull market behavior."
- Housing-inflation linkage (The Compound) — Housing activity treated as a potential inflation accelerant; no metric given.
- Agentic AI as structural layer (The Compound) — Snowflake positioned as "ground zero for the agentic future," with LLMs running inside the data warehouse to avoid data duplication.
- Sector rotation theme (Stock Market Live) — Software, chips, and staples in rotation; earnings from IGV and SMH the deciding catalysts.
- Political catalyst (Trade Brigade) — "Markets test Trump's pullout plan"; specifics unavailable (metadata only, unverified).
5. Scenario Analysis (🔄)
- Bull — Trigger: SPY/NQ confirm daily bounces; MU/SNDK/WDC tightening ranges break upward, producing NQ weekly higher low; SMH/QQQ avoids weekly downtrend confirmation (TheChartGuys). Sustained corporate spending keeps the economy growing (The Compound), and "rotation rather than retreat" persists into IGV/SMH earnings (Stock Market Live). Snowflake repeats a beat-and-raise with a strong equity reaction (The Compound — explicitly caveated as unpredictable). Probability/target: Not established by the available evidence.
- Base — Trigger: continued low-volume, holiday-impacted consolidation; SPY holds prior ATH with no follow-through; MU/MRNA/SNDK ranges tighten without clear breakout; metals remain at do-or-die lows; IGV/SMH earnings land without decisive direction (TheChartGuys, Stock Market Live). Probability: Not established by the available evidence.
- Bear — Trigger: SPY/NQ fail to hold prior ATH/value-area low; memory ranges break downward; SMH/QQQ confirms weekly downtrend; gold/silver lose current lows; spending proves unsustainable and valuations "come due" (The Compound's bear case; TheChartGuys levels). Trade Brigade's title flags a possible 2022 analog but provides no evidence. Probability: Not established by the available evidence. Creators disagree on direction — TheChartGuys tests the bull case, Trade Brigade's titles lean bearish.
6. Chronological Stream (📌)
- [12:04 ET] | The Compound | Rampant Bull Market Behavior | Bulls and bears debate whether heavy corporate spending sustains growth or signals late-cycle froth.
- [17:28 ET] | The Compound | Josh Nailed Snowflake | Snowflake's data-warehouse AI positioning could reprise last quarter's +38% post-earnings move; creator disclaims certainty.
- [21:44 ET] | TheChartGuys | Imminent Opportunity Ahead | Market consolidation hinges on daily bounce confirmations and the MU/SNDK/WDC range break direction.
- [22:26 ET] | Trade Brigade | 2022 Bear Market Incoming? | Bear-market question posed; coverage (SPY, QQQ, IWM, sectors, core list, trade ideas) requires full viewing — metadata only.
- [22:45 ET] | Stock Market Live | Software Vs. Chips Vs. Staples | "Rotate rather than retreat"; IGV and SMH earnings are the deciding catalysts.
- [07:30 ET] | Trade Brigade | Pre-Market Prep – Weakness Remains | Pre-market weakness persists as markets test "Trump's pullout plan" — metadata only.
7. Evidence-Bound Watchlist (🎯)
- Memory/semi range breaks: Confirm whether MU, SNDK, WDC resolve their tightening ranges upward (bull trigger for NQ) or downward (bear trigger), with SMH/QQQ weekly trend status as the confirming signal (TheChartGuys).
- IGV and SMH earnings events: Verify earnings dates and results for these ETFs against the "rotation rather than retreat" thesis (Stock Market Live).
- Macro catalyst clarification: Obtain specifics on "Trump's pullout plan" and any quantifiable 2022-analog evidence from Trade Brigade's full videos (metadata only; historical/unverified — do not upgrade to transcript-backed).
Daily Market Intelligence Brief — September 2, 2026 (Session Window: Sept 1 – Sept 2)
1. Executive Summary
Creator sentiment over the session window is tilted cautiously risk-off near-term: three independent sources cite September seasonality, a sudden momentum crash, and market structure breaks, while other voices stress that short-term support is still holding and that a recession may not arrive this decade. Snowflake's upcoming earnings are the most concretely scheduled catalyst for the software and AI-demand debate.
2. Narrative Over Time
- [10:56 ET, Sept 1] — The Compound (WAYT?): Frames trading around Snowflake earnings and a "sudden" momentum crash; questions whether software stocks are truly dead and debates Tim Cook's legacy.
- [11:24 ET, Sept 1] — Ask The Compound episode 238 publishes with metadata only; no substantive claims to track into the narrative.
- [11:43 ET, Sept 1] — TheChartGuys: Pivots to price action — bulls stalling at resistance while short-term support holds; asks if sideways action is bullish or bearish.
- [13:22 ET, Sept 1] — All-In Podcast / Eric Weinstein: Non-market structural commentary on science funding (ROI and KPI critique); no effect on market narrative.
- [21:58 ET, Sept 1 (UTC Sept 2 01:58)] — Stock Market Live: Introduces the seasonal bear case, calling September the worst month of the year with high yields and low volatility.
- [06:00 ET, Sept 2] — Animal Spirits 480: Broadens the horizon — claims no recessions for the rest of the 2020s, an AI debt binge, a software "dead cat bounce," and rising yields as a positive signal.
- [07:30 ET, Sept 2] — Trade Brigade (Pre-Market): Sharpens the technical bearish read — market structure breaking, drifting into a downtrend.
Synthesis: An intraday/technical softening from Sept 1 afternoon to Sept 2 pre-market, layered over divergent macro claims (no-recession confidence vs. AI debt-binge risk).
3. Key Technical Levels & Signals
- Numeric price/index levels: Unavailable. No source summary quotes an exact resistance, support, or target.
- Bulls stalling at resistance while short-term supports hold — TheChartGuys (levels unspecified)
- Market "structure break," markets "drifting into a downtrend" — Trade Brigade (no levels given)
- Sudden momentum crash on Wall Street — The Compound / WAYT? (duration and metric undefined)
- High yields with low volatility; September described as worst month of the year — Stock Market Live
4. Long-Horizon Macro & Structural Views
- AI debt binge flagged as a systemic risk driver for the current expansion — Animal Spirits 480
- Claimed no recessions for the rest of the 2020s; rising yields framed as a positive economic signal — Animal Spirits 480
- Gen Z entering the housing market may act as a demographic tailwind — Animal Spirits 480
- Software stocks characterized as a possible dead-cat bounce, with investor "dividend neglect" and bull-market M&A activity noted — Animal Spirits 480
- Tim Cook's Apple tenure framed as potential greatest-CEO candidacy — broader structural evaluation, no trading relevance — WAYT?
- Critique of ROI/KPI-driven science funding with a proposed "retainer" model for top scientists — All-In Podcast (structural, non-financial market topic)
- Sentiment disagreement: Animal Spirits suggests software is a dead-cat bounce; WAYT? frames the software-stocks-are-dead claim as an open, unproven debate.
5. Scenario Analysis
- Bull — Trigger: If Snowflake's earnings show robust AI demand and software resilience, the bearish software narrative loses force (WAYT?); near-term support holds, bulls clear resistance (TheChartGuys); macro case reinforced by the no-recession claim and rising yields as positive (Animal Spirits 480). Probability/targets: Not established by the available evidence.
- Base — Trigger: The momentum crash stabilizes, price continues sideways between resistance and support (WAYT?, TheChartGuys), and no decisive data resolves the software debate; markets stay rangebound. Probability/targets: Not established by the available evidence.
- Bear — Trigger: Snowflake disappoints on AI signals, the momentum crash persists, and/or short-term supports give way (WAYT?, TheChartGuys); structure breaks into a downtrend (Trade Brigade); September seasonality and the AI debt binge materialize (Stock Market Live, Animal Spirits 480).
- Where creators disagree: TheChartGuys note support is still holding (open outcome), while Trade Brigade asserts a downtrend is underway; Animal Spirits' no-recession call conflicts in spirit with the seasonal bearish and AI-debt-risk framing elsewhere. Disagreement is left unresolved, not averaged.
6. Chronological Stream
- [10:56 ET] | The Compound | Is Tim Cook the Greatest CEO of All Time? | WAYT? | Snowflake is the critical tell; momentum crash raises near-term questions.
- [11:24 ET] | The Compound | Ask The Compound 238 | Metadata-only; no market substance to extract.
- [11:43 ET] | TheChartGuys | Time For Weekly Consolidation? | Bulls stall at resistance while short-term supports hold — bullish or bearish unknown.
- [13:22 ET] | All-In Podcast | Eric Weinstein: ROI Obsession and Consensus Are Killing American Science | Structural critique of institutional science funding; no market driver.
- [21:58 ET] | Stock Market Live | Sorry September - SEP 2 - Stock Market LIVE | September seasonality is the bearish backdrop amid high yields and low volatility.
- [06:00 ET] | The Compound | The Next Michael Burry | Animal Spirits 480 | No recessions through the 2020s despite an AI debt binge and software dead-cat bounce risk.
- [07:30 ET] | Trade Brigade | [LIVE] Pre-Market Prep – STRUCTURE BREAKING | Structure breaking; markets drifting into a downtrend.
7. Evidence-Bound Watchlist
- Snowflake earnings event — Verify reported results and guidance against the claim that it will serve as a signal for AI demand and software-sector health (WAYT?).
- Momentum-crash and structure-break progression — Seek quantifiable VIX/volatility and index-level follow-through to test the qualitative "momentum crash" (WAYT?) and "downtrend drift" (Trade Brigade) claims.
- September seasonality claim — Cross-reference the "worst month of the year" assertion (Stock Market Live) with historical SEP returns and current yield/volatility conditions.
Daily Intelligence Brief — 2026-09-01 (ET)
1. Executive Summary (📰)
Creator sentiment shifted from guarded to bearish across Aug 31–Sep 1, anchored on a single macro theme: US fiscal debt and rising long-end yields. The Compound floated Treasury buybacks as a rate-lowering plan, while All-In (Friedberg) countered that the Fed cannot control the long end; Trade Brigade then opened Sep 1 pre-market on a global bond sell-off gap down.
2. Narrative Over Time (⏳)
- 08:41 ET (Aug 31) — The Compound opened the window with a structural frame: Treasury bond buybacks as a government plan to push rates down, alongside Druckenmiller's debt-risk op-ed and "why Bitcoin woke up."
- 10:07 ET — Trade Brigade pivoted to the immediate session: an "UGLY" start, with overnight selling "supported so far" — bearish but not yet breaking down.
- 12:00 ET — All-In (Friedberg) escalated the macro case with transcript-backed numbers: $40T debt, ~$2T deficit, $10T refinancing due, and a 30-yr at 5.2%. Core claim: the Fed cannot meaningfully affect long-term yields — directly opposing the buyback thesis.
- 18:30 ET — All-In (Weinstein) was non-market speculation (UAPs/nuclear), immaterial to sentiment.
- 00:06 ET (Sep 1) — Stock Market Live framed the month-turn open ambiguously ("A lot happened but a little changed"), flagging FOMC as relevant.
- 07:30 ET — Trade Brigade reported the theme's resolution into the open: global bond sell-off driving a pre-market gap down, "crushing markets."
Net arc: a quiet debt-framing morning gave way to a hard fiscal-solvency case at midday, which by next pre-market became an active global bond sell-off hitting equities.
3. Key Technical Levels & Signals (📈)
- 30-year Treasury yield at 5.2% — All-In/Friedberg (transcript). Analyst note: a 180 bp spread over the 3.4% average cost of federal debt.
- Average cost of federal debt at 3.4% — All-In/Friedberg.
- ~$10T federal debt refinancing due over 12 months — All-In/Friedberg.
- ~$2T fiscal deficit (current year) — All-In/Friedberg.
- $40T total federal debt outstanding — All-In/Friedberg.
- Excess interest cost: 1.25% of GDP per 1% rate change — All-In/Friedberg.
- No entry, stop, target, or risk/reward figures were established in any source. Trade Brigade (metadata) cited a "gap down" and "overnight selling" without levels.
4. Long-Horizon Macro & Structural Views (🌍)
- US fiscal solvency risk is the dominant structural theme (The Compound; All-In/Friedberg): $40T debt, ~$2T deficit, and $10T of refinancing at higher rates.
- Fed efficacy on the long end is contested: Friedberg argues the Fed cannot meaningfully control long-term yields, implying fiscal policy — not monetary policy — is the binding constraint.
- Treasury buybacks as a proposed policy tool to push rates down (The Compound, metadata-only; unverified against official announcements).
- Persistent inflation from excess government spending on social programs (All-In/Friedberg).
- Bitcoin's awakening cited as a market development (The Compound, metadata-only).
- Private market fraud flagged as a risk topic (The Compound, metadata-only).
- Housing and transportation costs cited as economic stress factors (The Compound, metadata-only).
5. Scenario Analysis (🔄)
- Bull — Trigger: the US government confirms a credible Treasury buyback program that stabilizes or lowers long-end yields; Bitcoin strength persists as a risk-on signal (The Compound, metadata-only). Probability/target: Not established by the available evidence. Disagreement: Friedberg (All-In) explicitly argues the Fed cannot meaningfully move long-term yields, so buyback efficacy is disputed.
- Base — Trigger: no policy change; ~$10T of debt refinances at prevailing rates with the 30-yr near 5.2% and ~$2T deficit (All-In/Friedberg, transcript-backed). Probability/target: Not established by the available evidence. Implied condition: elevated long-end yields persist, with equities grinding lower in response.
- Bear — Trigger: global bond sell-off accelerates into an equity gap down (Trade Brigade, metadata-only); alternatively, aggressive fiscal spending cuts trigger recession and unemployment (Friedberg bear case, All-In). Probability/target: Not established by the available evidence.
6. Chronological Stream (📌)
- [08:41 ET] | The Compound | The Government's New Plan to Push Rates Down | Treasury buybacks framed as a plan to lower rates amid debt-risk concerns.
- [10:07 ET] | Trade Brigade | [LIVE] Pre-Market Prep – An UGLY Start To The Week | Overnight selling "supported so far"; bearish pre-market bias.
- [12:00 ET] | All-In Podcast | David Friedberg: America's $40 Trillion Debt Problem | Fed can't control the long end; $10T refinancing at higher rates.
- [18:30 ET] | All-In Podcast | Eric Weinstein's Theory on Aliens | Speculative UAP-nuclear thesis; non-market.
- [00:06 ET (Sep 1)] | Stock Market Live | THE FIRST OF THE MONTH – SEP 1 | Month-turn open uncertain; FOMC flagged.
- [06:30 ET] | Capital Allocators | Chris Voss on 'No'-Oriented Questions | Interview tactics; non-market.
- [07:30 ET] | Trade Brigade | [LIVE] Pre-Market Prep – GAP DOWN | Global bond sell-off "crushing markets."
7. Evidence-Bound Watchlist (🎯)
- US 30-year Treasury yield vs. 5.2% (All-In/Friedberg, transcript-backed) — confirm the level and direction of movement into the next session.
- Any official Treasury or Fed announcement on bond buybacks — verify or refute The Compound's headline claim (metadata-only; currently unverified).
- Global bond sell-off magnitude and pre-market equity gap on Sep 1 (Trade Brigade, metadata-only) — quantify the move using futures data for the publication timestamp.
Market Intelligence Brief — 2026-08-31
1. Executive Summary (📰)
Overnight and pre-market commentary skews bearish for the session (Trade Brigade cites "ugly" open, supported overnight selling), while longer-horizon narratives split sharply: bullish on Tesla's Optimus robotics franchise (All-In), bearish on AI capex sustainability (The Compound), and macro-attentive to government debt and Treasury buybacks (The Compound). No creator establishes tradeable price levels; all directional claims remain unverified.
2. Narrative Over Time (⏳)
- 2026-08-30, 19:00 ET — All-In opens the window with a long-horizon bull case: a private Optimus video shown by Elon Musk is described as real, non-CGI, and making "sick progress"; creator claims Optimus will be the best-selling product of all time. No public evidence released.
- 2026-08-31, 01:47 ET — The Compound counters with the ultra-bear macro case: questions whether AI demand justifies hyperscaler capex, data-center buildout, and neocloud debt financing (CoreWeave cited). No quantitative backing provided.
- 2026-08-31, 12:00 ET — Capital Allocators pivots to structural deal-making: the "theory of the pie" argues synergy, not market power, defines a deal's surplus — a framework for allocator negotiations, not a market signal.
- 2026-08-31, 12:41 ET — The Compound returns with a macro-policy angle: claims the government plans Treasury buybacks to push rates down; also flags Druckenmiller's op-ed on debt risk, Bitcoin's move, and private-market fraud. Metadata-only; no specifics.
- 2026-08-31, 14:07 ET — Trade Brigade closes with a short-term bearish technical read: an ugly expected open with overnight selling "supported so far." No levels offered in the available evidence.
3. Key Technical Levels & Signals (📈)
- Trade Brigade: "Overnight selling supported so far" — bearish short-term bias for the session; no exact price levels, supports, or resistances provided.
- All-In Podcast: No quantitative levels; catalyst is a private Optimus video, not a price point.
- The Compound (both videos): No numeric levels; topics are macro claims (AI capex, Treasury buybacks), all unquantified.
- Capital Allocators: No levels; conceptual negotiation framework only.
- Exact figures: None available across all sources.
4. Long-Horizon Macro & Structural Views (🌍)
- Tesla robotics as mega-product (All-In, transcript-backed): Optimus claim of "best-selling product of all time"; credibility rests on a private, unverified video.
- AI capex sustainability (The Compound, metadata-only): Questions whether demand justifies hyperscaler capex boom, data-center buildout, and neocloud/private-credit debt loads; flags OpenAI/Anthropic economics and Oracle's AI exposure.
- Government debt and rates (The Compound, metadata-only): Treasury buyback plan cited as a rate-lowering mechanism; Druckenmiller op-ed discussed as a debt-risk warning.
- Structural negotiation (Capital Allocators, metadata-only): Theory of the pie — unique synergy, not market power, defines deal value; weaker counterparties can claim half.
- Uncertain productivity payoff (The Compound, metadata-only): Whether AI actually improves corporate productivity is presented as an open question.
5. Scenario Analysis (🔄)
- Bull: Public release of the Optimus video confirms real, non-CGI progress (All-In), or evidence surfaces that AI is materially improving corporate productivity (The Compound). Probability/target: Not established by the available evidence.
- Base: The Optimus video remains private and speculative interest persists; AI capex debate continues unresolved with no confirming or refuting data. Probability/target: Not established by the available evidence.
- Bear: The Optimus video is revealed to be staged/CGI (discrediting All-In and Elon), or warning signs break the AI spending cycle (The Compound's ultra-bear path); Trade Brigade's "overnight selling" continues into the session. Probability/target: Not established by the available evidence. Note: Creator disagreement exists — All-In's unqualified Optimus optimism conflicts with The Compound's AI-boom-collapse skepticism; the disagreement is stated, not averaged.
6. Chronological Stream (📌)
- [19:00 ET, 2026-08-30] | All-In Podcast | Elon's Optimus will be the best-selling product of all time | Private video shows real, non-CGI robot progress; massive upside claim for Tesla robotics.
- [01:47 ET, 2026-08-31] | The Compound | What Happens If the AI Boom Collapses? | Ultra-bear case questioning whether AI demand justifies hyperscaler capex and debt-financed data centers.
- [12:00 ET, 2026-08-31] | Capital Allocators with Ted Seides | Daylian Cain on the Theory of the Pie | Deal value comes from unique synergy, not market power; weaker parties can claim half.
- [12:41 ET, 2026-08-31] | The Compound | The Government's New Plan to Push Rates Down | Claims Treasury buyback plan targets lower rates; debt risk, Bitcoin, and private-market fraud discussed.
- [14:07 ET, 2026-08-31] | Trade Brigade | Pre-Market Prep — An UGLY Start To The Week | Bearish short-term bias; overnight selling "supported so far."
7. Evidence-Bound Watchlist (🎯)
- Tesla / Optimus: Monitor Tesla official channels and Elon Musk's social media for public release of the Optimus video described by All-In; compare any release against the "real, non-CGI" claim. (Source: All-In Podcast)
- AI capex and debt cycle: Watch Nvidia quarterly earnings/guidance, hyperscaler capex announcements (Microsoft, Google, Amazon), and neocloud debt-financing terms (CoreWeave) for signs of deceleration or stress. (Source: The Compound)
- Treasury buyback specifics: Verify the claimed government plan to buy back Treasury bonds and push rates down via official Treasury/Fed announcements; read Druckenmiller's op-ed on debt risk. (Source: The Compound)
Weekly Intelligence Brief — August 24–30, 2026
1. Executive Summary (📰)
The week was defined by NVIDIA's earnings (Aug 26), which most creators judged strong, and by rising 10-year Treasury yields and Jackson Hole/Warsh commentary (Aug 28–29), which split sentiment between AI-capex durability (bullish) and a 2027 "bubble burst" / rate-risk thesis (bearish).
2. Narrative Over Time (⏳)
- Aug 24: The Compound (08:29 ET) framed an earnings/AI-driven bull market with skeptics "moving goalposts"; its 16:00 ET episode said real yields, not inflation, are driving long-end rates higher. All-In (12:45 ET) introduced a step-by-step open-source AI regulatory-capture thesis. Trade Brigade (06:30 ET) claimed an "ugly open at critical support" — level unverified.
- Aug 25: The Compound (01:48 ET) asserted the market embodies a 5-year no-recession assumption via hyperscaler leverage; its 07:55 ET episode argued a 2027 bubble burst on "peak AI spend." Trade Brigade (06:34 ET) set NVDA earnings as the key catalyst.
- Aug 26–27: Post-earnings, All-In (01:37 ET Aug 29) called it a "historic quarter" that reversed the AI-bubble/SaaSpocalypse narratives; ChartGuys (01:09 ET Aug 27) said "NVDA lifts market." Trade Brigade (06:31 ET) asked whether the rally will hold.
- Aug 28–30: The Compound's Four Horsemen (05:00 ET) presented the ultra-bear AI case (CoreWeave/Oracle/private credit fragility). Jackson Hole dominated: Trade Brigade (08:40 ET) framed Warsh as crash-or-save; Visser (07:30 ET Aug 30) calculated hike odds moved 35%→60% on Warsh and argued 10-year yields "belong above 8%." Trade Brigade (13:46 ET) asked, "Did Jackson Hole Mark The Top?"
3. Key Technical Levels & Signals (📈)
- Not disclosed: Trade Brigade's Aug 24 "critical support" level; SPY/QQQ/IWM levels (Aug 27 midweek); "did Jackson Hole mark the top" premise.
- Visser (Aug 30): 10-year yields "arguably belong above 8%"; Bitcoin 200-day slope turned up after 100+ days down — 4th such instance, prior lows held each time; Solana +46% MTD; tokenized index broke out; 29% of stocks above 50-day; Nvidia next-year growth guided 70% vs 44% expected; market cap/GDP at 240–250%, heading toward 300%; hyperscaler issuance = 9% of IG supply, doubled in a year.
- The Compound (Aug 27, transcript): Since 1928, ~95% of years had a ≥5% peak-to-trough drawdown; the worst 30-year annual return (from 1929) was ~8%/yr; after worst months, average 5-year forward return is >120%.
- The Compound (Aug 28, transcript): GitHub Copilot cited as ~$40 subscription vs ~$5,000 of tokens used.
4. Long-Horizon Macro & Structural Views (🌍)
- AI capex sustainability is the core dispute: The Compound's Four Horsemen and Bear Case for AI (Ed Zitron) see debt-financed fragility; All-In and The Compound's other episodes see earnings-validated strength — direct creator disagreement.
- Implicit no-recession regime: low VIX, low correlations, rotation into healthcare/financials/tech (The Compound, Aug 25).
- 2027 bubble thesis: "peak AI spend" as trigger (The Compound, Aug 25).
- Treasury/real-yield concern: real yields driving long end (The Compound, Aug 24); government debt risk and Druckenmiller/Bessent tension (Compound EP 479, All-In, Visser).
- Open-source AI regulation: regulatory capture via a "FINRA for AI" (All-In/Sacks); Dario's rules "would destroy Anthropic" (Sacks); patriotism argues for open source (Gavin Baker).
- AI pricing economics: $40 vs $5,000 token mismatch seen as unsustainable (The Compound).
- Tokenization/monetary rails: AI time-compression, compute scarcity, Bitcoin as protection (Visser).
5. Scenario Analysis (🔄)
- Bull: NVDA's "historic quarter" validates AI capex (All-In, Aug 29); Visser's Bitcoin 200-day slope up, tokenized breakout, prior lows held; probability/targets: Not established by the available evidence.
- Base: Continued low-VIX, low-correlation rotation with unresolved peak-AI-spend question (The Compound, Aug 25–27); yield suppression via interventions while long end stays elevated (Visser). Probability: Not established by the available evidence.
- Bear: 2027 bubble burst on peak AI spend (The Compound, Aug 25); Jackson Hole marked a top (Trade Brigade, Aug 29); 10-year toward 8%+ forcing policy error, dollar/yen 160 (Visser); "rot economy" fragility (The Compound/Zitron, Aug 28); Chamath's "death spiral" — subject unverified. Probability: Not established by the available evidence.
6. Chronological Stream (📌)
- [06:00 ET] Aug 24 | Capital Allocators | Clarity Beats Cleverness | 99% test-market sales lift; clarity over cleverness.
- [06:30 ET] Aug 24 | Trade Brigade | Ugly Open at Critical Support | Claims critical support; no level disclosed.
- [08:29 ET] Aug 24 | The Compound | Sandisk Boom | Earnings and AI capex keep bull alive; bears shift goalposts.
- [12:45 ET] Aug 24 | All-In | Regulatory Capture vs Open Source | FINRA-style body would codify closed-model standards.
- [16:00 ET] Aug 24 | The Compound | 10-Year Treasury | Real yields drive long end; three paths to new highs.
- [18:30 ET] Aug 24 | All-In | Trump Science Agenda | Funding redirected to quantum/fusion; China gaining.
- [01:48 ET] Aug 25 | The Compound | Big Tech Bets No Recession | Market implies 5-yr no-recession via hyperscaler leverage.
- [06:00 ET] Aug 25 | Capital Allocators | Never Give a Presentation | Write the words first; slides are teleprompters.
- [06:34 ET] Aug 25 | Trade Brigade | Bounce, Fade It? NVDA | Fade question; NVDA earnings as catalyst.
- [07:55 ET] Aug 25 | The Compound | Bubble Bursts in 2027 | Five reasons; "peak AI spend."
- [08:01 ET] Aug 25 | The Compound | ATC 237 | General personal finance Q&A; no thesis.
- [10:30 ET] Aug 25 | All-In | Flock CEO | Under a dozen abuses in 8 years; mandatory detection feature.
- [10:50 ET] Aug 25 | ChartGuys | Crypto Bulls | Bond news drives upside breakdown of equilibriums.
- [13:00 ET] Aug 25 | All-In | Sacks: Dario Would Destroy Anthropic | Amodei's regulation preferences fatal to Anthropic.
- [15:11 ET] Aug 25 | All-In | Fauci Hurt Science | Contradictory COVID guidance eroded trust.
- [02:39 ET] Aug 26 | The Compound | Airbnb, Delta AI Beneficiaries | Earnings to signal next AI phase; materials bullish setup.
- [05:00 ET] Aug 26 | The Compound | Animal Spirits 479 | Treasury buybacks, debt risk, Bitcoin "woke up."
- [06:30 ET] Aug 26 | Trade Brigade | NVDA Pre-Market | Technical prep around NVDA earnings.
- [10:00 ET] Aug 26 | All-In | Gavin Baker: Pro-Open Source | Patriotism implies open-source AI.
- [17:07 ET] Aug 26 | The Compound | Animal Spirits Promo | Same EP 479 topics; no specifics.
- [17:16 ET] Aug 26 | Trade Brigade | NVIDIA Q2 Live | Technicals + Jensen call; no levels in metadata.
- [18:00 ET] Aug 26 | All-In | Weinstein: State of Science | Science stalled; radical fixes; Renaissance as "secret Los Alamos."
- [00:41 ET] Aug 27 | The Compound | Don't Trust Your Gut | AI spend trend and NVDA as near-term catalysts.
- [01:09 ET] Aug 27 | ChartGuys | NVDA Lifts Market | NVDA-led strength; metals bull thesis under review.
- [01:42 ET] Aug 27 | The Compound | 10 Things Investors Need | Long-term bullish history; drawdowns are normal.
- [03:00 ET] Aug 27 | All-In | Weinstein (repeat) | Scientific stagnation; Civil Rights Act reform proposals.
- [03:04 ET] Aug 27 | Trade Brigade | Two Rarely Move Together | SPY/QQQ/IWM levels; trade ideas; pair unnamed.
- [06:31 ET] Aug 27 | Trade Brigade | NVDA Saves Markets? | Can the post-earnings rally hold?
- [01:14 ET] Aug 28 | The Compound | Sponsored Wedding | EP 479 recap; no market calls.
- [04:06 ET] Aug 28 | ChartGuys | Live Analysis Aug 31 | Sector setups for next session.
- [05:00 ET] Aug 28 | The Compound | Four Horsemen of AI Apocalypse | Ultra-bear AI; debt-financed buildout fragility.
- [08:40 ET] Aug 28 | Trade Brigade | Jackson Hole: Crash or Save? | Warsh as binary catalyst.
- [12:39 ET] Aug 28 | The Compound | Bear Case for AI | TCAF 257 presents the bear case (title claim).
- [18:31 ET] Aug 28 | The Compound | Problem With AI Pricing | Copilot pricing: $40 vs ~$5,000 tokens, unsustainable.
- [01:37 ET] Aug 29 | All-In | Nvidia's Historic Quarter | Earnings reversed AI-bubble/SaaSpocalypse narratives.
- [09:10 ET] Aug 29 | ChartGuys | Awaiting Market Conviction | Indecision after NVDA and Warsh; software bulls standout.
- [10:00 ET] Aug 29 | All-In | Sacks: China AI Optimism | Optimism is China's biggest AI advantage.
- [13:46 ET] Aug 29 | Trade Brigade | Did Jackson Hole Mark the Top? | Top question; core list and trade ideas.
- [14:00 ET] Aug 29 | All-In | Chamath: Death Spiral | "Beginning of a death spiral" — subject unstated.
- [07:30 ET] Aug 30 | Jordi Visser | Bessent Gets Drucked | Compute scarcity, yield suppression, Bitcoin 200-day up.
- [10:30 ET] Aug 30 | All-In | Friedberg: Gov Spending | Government spending ruins everything (claim).
- [14:00 ET] Aug 30 | All-In | Calacanis: Optimus | Optimus will be "best-selling product of all time."
7. Evidence-Bound Watchlist (🎯)
- NVIDIA follow-through: Reconcile All-In's "historic quarter" claim (earnings reversal of AI-bubble narrative) against the actual 10-Q/guidance figures.
- 10-year yield and Jackson Hole aftermath: Verify Visser's claim that Warsh moved hike odds 35%→60%; watch for Treasury buyback/TGA interventions or a push toward 8% long-end yields.
- Crypto/tokenization signals: Confirm Bitcoin's 200-day slope turning up and Solana +46% M/TD (Visser), plus any Japan/Korea or Stripe tokenization announcements.
Weekend Intelligence Brief
Period Covered: 2026-08-28 to 2026-08-29
1. Executive Summary (📰)
Markets ended the week at a pivotal juncture: Nvidia's blockbuster earnings and Salesforce's rebound appeared to reverse the AI-capex-bubble and "SaaSpocalypse" narratives, while Jackson Hole commentary from Kevin Warsh—framed around rate-hike probabilities—and escalating Treasury/Bessent-vs-Druckenmiller tensions kept macro risk elevated. A countervailing bear thesis on AI economics and infrastructure financing circulated across multiple creators, sharpening the debate on the durability of the AI capex cycle.
2. Narrative Over Time (⏳)
- 2026-08-28 (early): The Compound (ep. 479) opened the period discussing Treasury bond buybacks, government debt risk, and Bitcoin's recent move; no directional calls were made. Simultaneously, TheChartGuys aired a pre-market livestream for the Aug 31 session focused on sector analysis—no specific setups in metadata.
- 2026-08-28 (morning): The Compound's TCAF ep. 257 presented the ultra-bear case for AI, questioning whether hyperscaler capex and Nvidia's growth are justified by demand; later, a standalone "Bear Case for AI" video reinforced the thesis. TheChartGuys' "Awaiting Market Conviction" (Aug 29 metadata) flagged NVDA earnings reaction and Warsh rate-hike probability increases as key drivers.
- 2026-08-29: All-In Podcast reported Nvidia's historic quarter and SaaS comeback had "reversed" the AI bubble narratives, while highlighting Druckenmiller's callout of Bessent over bond market interference. Trade Brigade questioned whether Jackson Hole marked a top, analyzing SPY, QQQ, and IWM with trade ideas in CRWD, NET, FIG, FROG. Chamath's "death spiral" quote appeared without subject context.
3. Key Technical Levels & Signals (📈)
- Indices analyzed (Trade Brigade): SPY, QQQ, IWM—no levels provided.
- Core list(Trade Brigade): NVDA, AAPL, MSFT, AMZN, GOOGL, AVGO, META, MU, TSLA, JPM, AMD, INTC.
- Trade ideas (Trade Brigade): CRWD, NET, FIG, FROG.
- Sector strength (TheChartGuys): Software sector bulls "stand out" amid overall indecision.
- No specific price levels, entry/stop/target data are literally present in any source summary. All additional levels are unavailable.
4. Long-Horizon Macro & Structural Views (🌍)
- Treasury buybacks/debt: The Compound discussed Treasury bond buybacks and real government debt risk; All-In Podcast covered Bessent's reportedly $1T Treasury general account buybacks and Druckenmiller's callout.
- AI capex bear case: The Compound + guest Ed Zitron argue hyperscaler capex, CoreWeave/neocloud debt, and private credit financing of data centers may be disconnected from real AI economics and productivity gains. Microsoft's GitHub Copilot pricing change (2M customers, "$5,000 of tokens for $40") cited as evidence of unsustainable pricing.
- AI capex bull case: All-In Podcast claims Nvidia's and Salesforce's earnings reversed the AI bubble narrative.
- Fed policy expectations: Warsh's Jackson Hole comments interpreted by Trade Brigade (binary crash/save framing) and TheChartGuys (rate-hike probability increase).
- US-China AI competition: David Sacks claims China's advantage is "optimism"—no operational definition provided.
- Healthcare: Moderna's mRNA cancer vaccine discussed (All-In Podcast).
5. Scenario Analysis (🔄)
- Bull: All-In Podcast reports the AI capex bubble and SaaSpocalypse narratives were reversed by Nvidia's and Salesforce's earnings—the strongest evidence-bound trigger for the bull path. Software sector strength (TheChartGuys) is a supporting signal. Probability/target: Not established by the available evidence.
- Base: TheChartGuys' "Awaiting Market Conviction" describes an indecision market with no clear directional catalyst; Trade Brigade's "Did Jackson Hole Mark The Top?" is an open question, not a confirmation. Probability/target: Not established by the available evidence.
- Bear: The Compound and Ed Zitron argue AI spending is disconnected from demand, with warning signs (including CoreWeave/neocloud debt and private credit exposure) that could break the cycle; Trade Brigade frames Warsh's speech as a potential market-crash trigger. Chamath's "death spiral" quote is uncontextualized. Probability/target: Not established by the available evidence. Note the sharp disagreement between All-In's reversal claim and The Compound's bear thesis.
6. Chronological Event Log (📅)
- [2026-08-28 01:14 UTC] | The Compound | Treasury buybacks, debt risk, and Bitcoin discussed; no trades.
- [2026-08-28 09:06 UTC] | TheChartGuys | Live pre-market analysis for Aug 31; sector review, no specifics.
- [2026-08-28 10:00 UTC] | The Compound (TCAF 257) | Ultra-bear AI case presented with Ed Zitron.
- [2026-08-28 13:40 UTC] | Trade Brigade | Jackson Hole pre-market prep framing Warsh as crash-or-save catalyst.
- [2026-08-28 17:39 UTC] | The Compound | "The Bear Case for AI" video published.
- [2026-08-28 23:31 UTC] | The Compound | GitHub Copilot pricing analysis—$40 for ~$5,000 of tokens deemed unsustainable.
- [2026-08-29 01:37 UTC] | All-In Podcast | Nvidia historic quarter, SaaS comeback, Bessent vs Druckenmiller, debt crisis, cancer vaccine.
- [2026-08-29 14:10 UTC] | TheChartGuys | Awaiting market conviction; NVDA reaction, Warsh rate-hike probabilities, software bulls.
- [2026-08-29 15:00 UTC] | All-In Podcast | Sacks: China's AI edge is optimism (no supporting evidence).
- [2026-08-29 18:46 UTC] | Trade Brigade | Jackson Hole top question; SPY/QQQ/IWM and trade ideas analyzed.
- [2026-08-29 19:00 UTC] | All-In Podcast | Chamath: "beginning of a death spiral"—subject unstated in metadata.
7. Watchlist (🎯)
- NVDA earnings follow-through: Verify whether the post-earnings rally holds and whether guidance justifies the "historic quarter" claim (All-In). Check subsequent price action vs. The Compound's bear thesis.
- GitHub Copilot pricing (Microsoft): Verify the June 1st pricing change details, actual token economics, and customer churn reactions—creators claim the "$5,000 for $40" model is unsustainable.
- Hyperscaler capex guidance: Monitor Microsoft, Google, Amazon, Meta commentary for any changes in AI infrastructure spending—would confirm or refute the break-the-cycle scenario.
- CoreWeave & private credit exposure: Track debt issuance and lender terms to assess financing fragility claims.
- Treasury buybacks / Bessent policies: Verify the reported $1T buyback program; monitor yield curve response to Druckenmiller's criticism.
- Kevin Warsh / Jackson Hole: Confirm speech details and whether any rate-hike signal was actually delivered; compare Trade Brigade's binary framing to actual market response.
- Software sector strength: Confirm whether software relative outperformance persists as a bullish signal (TheChartGuys).
- Chamath's "death spiral" subject: Unresolved—requires viewing the full episode to identify the referenced asset or sector.
Daily Intelligence Brief
Date: 2026-08-29 (Post-Session)
Focus: Short-Term Market Conviction vs. Long-Horizon Structural Warnings
1. Executive Summary (📰)
Creators split between near-term indecision over NVDA earnings and Fed commentary, and a longer-horizon risk narrative featuring China AI optimism gaps and a possible tech "death spiral." No creator provided concrete price levels, probabilities, or risk/reward figures; all quantitative claims remain unverified.
2. Narrative Over Time (⏳)
- 10:10 ET — TheChartGuys published first, framing the session as "indecision markets" ahead of conviction: NVDA's earnings reaction and Warsh's rate-hike comments are the two catalysts to watch, with relative strength in software as the lone bullish signal.
- 11:00 ET — All-In Podcast pivoted to structural territory: David Sacks argued China's AI edge over America is optimism — a psychological/cultural claim with no data attached in the available evidence.
- 14:46 ET — Trade Brigade surfaced the session's key bearish question: whether Jackson Hole marked a top in SPY, QQQ, and IWM. The creator's framework segments into "Fundamental Evidence" and "Technical Evidence" sections, but neither was accessible from metadata.
- 15:00 ET — All-In Podcast closed the session with Chamath's unspecified "death spiral" warning, tagged under #tech and #news — a broad, thematic caution with no asset or subject identified.
Net evolution: the session moved from tactical indecision (morning) to structural risk questioning (afternoon), with no creator reaching a definitive directional conclusion.
3. Key Technical Levels & Signals (📈)
- SPY, QQQ, IWM — under top-question scrutiny by Trade Brigade; no levels cited.
- Core watchlist (Trade Brigade): NVDA, AAPL, MSFT, AMZN, GOOGL, AVGO, META, MU, TSLA, JPM, AMD, INTC.
- Trade ideas list (Trade Brigade): CRWD, NET, FIG, FROG.
- Exact price levels, support/resistance zones, or stops: unavailable across all creators' summaries.
4. Long-Horizon Macro & Structural Views (🌍)
- Fed rate-hike repricing: Warsh comments shift rate-hike probabilities higher (TheChartGuys) — a macro headwind if realized.
- China AI optimism edge: Sacks claims China outcompetes the US in AI via optimism; no operational definition provided (All-In Podcast).
- Jackson Hole as potential structural top: Trade Brigade questions whether the event marked a major index top; confirmation is pending.
- Tech "death spiral": Chamath's unspecified warning of structural deterioration in a tech-adjacent context (All-In Podcast). Subject unstated, unverifiable.
5. Scenario Analysis (🔄)
- Bull: Software-sector relative strength persists (TheChartGuys) and NVDA's earnings reaction proves constructive for market direction. Probability/target: Not established by the available evidence.
- Base: Indecision persists with no clear directional catalyst; all three signal groups (NVDA reaction, Warsh commentary, Jackson Hole aftermath) remain unresolved. Probability/target: Not established by the available evidence. Supported by TheChartGuys' "awaiting conviction" framing.
- Bear: Any of three triggers suffice: (1) Warsh comments materialize into higher rate-hike odds (TheChartGuys); (2) Jackson Hole confirms a top in SPY/QQQ/IWM (Trade Brigade); (3) Chamath's "death spiral" scenario gains specificity and support (All-In). Probability/target: Not established by the available evidence.
6. Chronological Stream (📌)
- [10:10 ET] | TheChartGuys | Awaiting Market Conviction | NVDA earnings reaction and Warsh rate-hike comments leave markets in indecision; software bulls are the standout signal.
- [11:00 ET] | All-In Podcast | Sacks: China's Biggest AI Advantage Over America Is Optimism | David Sacks attributes China's AI edge to optimism; claim lacks supporting data.
- [14:46 ET] | Trade Brigade | Did Jackson Hole Mark The Top?! | Questions whether Jackson Hole topped SPY/QQQ/IWM, analyzing fundamental and technical evidence across a 12-stock core list.
- [15:00 ET] | All-In Podcast | Chamath: "This could be the beginning of a death spiral." | Unspecified structural-risk warning, tech-tagged, with subject unstated.
7. Evidence-Bound Watchlist (🎯)
- NVDA post-earnings price action — confirm direction of market reaction and whether TheChartGuys' "indecision" resolves bullishly or bearishly.
- Warsh commentary specifics — locate the full quote and assess whether rate-hike probability shifts are material or rhetorical.
- Chamath's "death spiral" subject — identify the referenced asset/sector via video transcript; verify against current macro data before treating it as a real risk.
Weekend Intelligence Brief — August 29–31, 2026
1. Executive Summary
The weekend's dominant theme is the bifurcation of the AI-capex narrative: NVDA's Q2 earnings were framed first as a market-saving catalyst (Trade Brigade, TheChartGuys), then as a narrative-reversing event (All-In), while The Compound's TCAF 257 advanced an ultra-bear case against the hyperscaler buildout's economics. Secondary threads: fiscal/debt tension between Bessent and Druckenmiller, an imminent Jackson Hole appearance by Kevin Warsh, and structural debates over open-source AI and US science policy.
2. Narrative Over Time
- Aug 26 (ET): All-In's Gavin Baker argued open-source AI is a patriotic imperative (11:00). Animal Spirits EP 479 (18:07) covered Treasury buybacks, Druckenmiller's op-ed, and government debt risk. Trade Brigade hosted live NVDA Q2 earnings coverage (18:16); All-In's Eric Weinstein interview aired at 19:00 with radical science-reform claims.
- Aug 27 (ET): The Compound warned against gut-driven trading ahead of NVDA (20:41 prev. day). TheChartGuys observed NVDA lifting the market while weighing a metals bull thesis (21:09). Trade Brigade claimed "NVDA EARNINGS SAVE MARKETS" in pre-market prep (07:31).
- Aug 28 (ET): The bear-AI case consolidated — TCAF 257 ("Four Horsemen of the AI Apocalypse," with Ed Zitron) questioned hyperscaler capex, CoreWeave/neocloud debt, and Oracle's AI bet; a companion episode attacked AI pricing economics (GitHub Copilot). All-In (21:37) countered, claiming NVDA and Salesforce earnings reversed the AI-bubble and SaaSpocalypse narratives, while flagging a $1T Treasury general-account buyback report.
3. Key Technical Levels & Signals
- Trade Brigade cited "key levels of support and resistance" for SPY, QQQ, IWM and S&P sectors; TheChartGuys proposed rotational scenarios for market health and a "metals bull thesis." No numeric levels were disclosed in the available evidence.
- Trade Brigade's coverage names core-list tickers NVDA, AAPL, MSFT, AMZN, GOOGL, AVGO, META, TSLA, JPM, MU, AMD, INTC and trade-ideas SMCI, AXON, TSEM, AAOI, NBIS, CRSP, without entries, stops, or targets.
- Headline claim (Trade Brigade): "These Two RARELY Move Together" — the two assets are unnamed in the evidence; untestable as presented.
- All other numeric price levels: not established.
4. Long-Horizon Macro & Structural Views
- AI capex durability: TCAF 257 questions whether hyperscaler capex, data-center buildout, and neocloud debt (CoreWeave, Oracle, private credit) are justified by demand; asks whether AI improves corporate productivity (The Compound).
- AI pricing economics: Microsoft's GitHub Copilot pricing change after ~2M customers implies $5,000 of tokens sold for $40 (creator claim); token costs allegedly haven't fallen as expected (The Compound, transcript-backed).
- Fiscal/debt: $1T Treasury general-account bond buybacks reported via CNBC; Druckenmiller called out Bessent for bond-market interference; "America's debt crisis" flagged (All-In, Animal Spirits).
- Open-source AI: Baker frames it as a patriotic/national-interest priority (All-In).
- Science policy: Weinstein claims US science has stalled, proposing Civil Rights Act changes, ending peer review, funding people over ideas (All-In). All claims unverified.
- Equity structure: ~95% of years since 1928 had ≥5% drawdowns; the worst 30-year return (from 1929) was ~8%/yr (The Compound, transcript-backed).
5. Scenario Analysis
- Bull: Trigger — NVDA and Salesforce earnings hold, reversing AI-capex-bubble and SaaSpocalypse narratives (All-In's claim); TCAF poses a "positive outcome" question but supplies no confirming evidence. Probability/target: not established.
- Base: NVDA earnings strong but the peak-AI-spending question unresolved; Bessent–Druckenmiller fiscal tension continues without crisis. Probability: not established.
- Bear: Trigger — TCAF's "warning signs that break the AI spending cycle"; Copilot token economics indicate structural unsustainability; debt risk forces bond-market intervention (Druckenmiller). Probability: not established. The Compound and All-In directly disagree on whether the earnings and capex data vindicate or indict the AI trade.
6. Chronological Event Log
- [2026-08-26 11:00 ET] | All-In | Open-source AI as patriotic imperative — https://www.youtube.com/watch?v=hTLXWbfVi8w
- [2026-08-26 18:07 ET] | The Compound | Animal Spirits 479: Treasury buybacks, debt risk, Bitcoin "woke up" — https://www.youtube.com/watch?v=FMzqnY2IacA
- [2026-08-26 18:16 ET] | Trade Brigade | NVDA Q2 earnings live coverage — https://www.youtube.com/watch?v=47X7sqYD1f0
- [2026-08-26 19:00 ET] | All-In | Weinstein: US science stalled, radical reforms — https://www.youtube.com/watch?v=a0lDsM_J_rc
- [2026-08-26 20:41 ET] | The Compound | Don't trust gut; NVDA catalyst; bullish materials claim — https://www.youtube.com/watch?v=u1fGG2Jg3Sg
- [2026-08-26 21:09 ET] | TheChartGuys | NVDA lifts market; metals bull thesis reviewed — https://www.youtube.com/watch?v=1Kdw3GVX2iY
- [2026-08-26 21:42 ET] | The Compound | Long-term stats: drawdowns frequent; worst 30-yr return positive — https://www.youtube.com/watch?v=_WDVGV-9B3c
- [2026-08-26 23:00 ET] | All-In | Weinstein (duplicate content, alt URL) — https://www.youtube.com/watch?v=y84ypzELP_s
- [2026-08-26 23:04 ET] | Trade Brigade | SPY/QQQ/IWM levels cited, not specified — https://www.youtube.com/watch?v=ptDO0PkE4AA
- [2026-08-27 07:31 ET] | Trade Brigade | "NVDA earnings save markets" — sustainability questioned — https://www.youtube.com/watch?v=CozNZ_pnRr8
- [2026-08-27 21:14 ET] | The Compound | Animal Spirits recap: debt, Bitcoin, sponsored-wedding theme — https://www.youtube.com/watch?v=FHkEXkDDVEI
- [2026-08-28 05:06 ET] | TheChartGuys | Pre-market analysis for Aug 31 session — https://www.youtube.com/watch?v=YcIMAPXVww8
- [2026-08-28 06:00 ET] | The Compound | TCAF 257: Four Horsemen of AI Apocalypse, Zitron bear case — https://www.youtube.com/watch?v=yoCkR0pn0ns
- [2026-08-28 09:40 ET] | Trade Brigade | Jackson Hole: Warsh binary crash/save framing — https://www.youtube.com/watch?v=JHPRSvGdtHA
- [2026-08-28 13:39 ET] | The Compound | "Bear Case for AI" (title variant of TCAF 257) — https://www.youtube.com/watch?v=xqZNa2m2mm0
- [2026-08-28 19:31 ET] | The Compound | GitHub Copilot pricing economics unsustainable — https://www.youtube.com/watch?v=aamUiSXvea0
- [2026-08-28 21:37 ET] | All-In | NVDA/Salesforce reverse bubble narratives; Bessent vs Druck — https://www.youtube.com/watch?v=1u5dMAKl_ks
7. Watchlist
- NVDA follow-through: verify whether post-earnings strength persists; All-In claims narratives reversed; Trade Brigade asks "will it hold?" — confirm via price action and subsequent guidance.
- Hyperscaler capex & neocloud debt: monitor capex guidance from Microsoft/Google/Amazon/Meta; CoreWeave debt issuance; Oracle cloud commentary; private-credit participation in AI infrastructure (TCAF 257).
- AI user economics: GitHub Copilot pricing change (June 1, ~2M customers); verify the $5,000-tokens-for-$40 claim against usage data (The Compound).
- Jackson Hole / Kevin Warsh: scheduled remarks framed as a binary catalyst; verify actual content and market reaction (Trade Brigade).
- Fiscal: Bessent's $1T Treasury general-account buyback; Druckenmiller's op-ed; debt-service-cost data; Treasury yield reaction (All-In, Animal Spirits).
- Bitcoin: "woke up" claim lacks magnitude/timeline; verify with price/volume (Animal Spirits).
- Open-source AI & science policy: monitor policy proposals and any corroborating data on Weinstein's claims; assess the Renaissance Technologies "secret Los Alamos" speculation against public records (All-In).
- Materials bull claim: no supporting levels or fundamentals provided; verification required (The Compound).
Daily Intelligence Brief — 2026-08-28
1. Executive Summary (📰)
Creator commentary is split between a structural AI bear case (token economics, pricing unsustainability) and an earnings-led rebuttal (NVIDIA, Salesforce) — with Jackson Hole framed as the immediate binary event risk. No technical price levels were cited across any of the sources.
2. Narrative Over Time (⏳)
- 09:40 ET — Trade Brigade opened the session by framing Fed official Kevin Warsh's Jackson Hole speech as a binary crash-or-save catalyst for markets, establishing event risk as the day's dominant short-term theme.
- 13:39 ET — The Compound published a broad structural bear case for AI, setting a skeptical macro tone without supporting specifics.
- 19:31 ET — The Compound sharpened that critique with a transcript-backed, concrete case: Microsoft's change to GitHub Copilot pricing is economically unsustainable because $5,000 of tokens is being consumed against a $40 subscription.
- 21:37 ET — All-In Podcast directly contradicted the bearish framing, claiming NVIDIA's and Salesforce's earnings reversed the AI-capex-bubble and SaaSpocalypse narratives, while adding a macro tension point — Bessent's bond-market intervention criticized by Druckenmiller amid debt-crisis concerns.
3. Key Technical Levels & Signals (📈)
- Unavailable. No price levels, zones, or technical signals were cited by any creator in the available evidence.
- The only numeric items cited are non-technical: $40 subscription vs. $5,000 of tokens consumed (The Compound), 2 million GitHub Copilot customers (The Compound), and a $1 trillion Treasury buyback figure (All-In, via linked CNBC article).
4. Long-Horizon Macro & Structural Views (🌍)
- Token economics for AI vendors are structurally strained. $5,000 of tokens priced at $40 is unsustainable; token costs have not declined as Microsoft expected (The Compound, transcript-backed).
- A structural AI bear case exists as a thesis, but no supporting data is yet evidenced (The Compound, metadata-only).
- US debt crisis and Treasury intervention are live macro tensions. Secretary Bessent's bond-market moves drew Druckenmiller's criticism; $1T buyback figure cited (All-In, metadata-only).
- Narrative reversal risk. Claims of an AI capex bubble and SaaSpocalypse were "reversed" by NVIDIA's and Salesforce's quarters, per All-In (metadata-only).
- Moderna's mRNA cancer vaccine flagged as a science watch item (All-In, metadata-only).
5. Scenario Analysis (🔄)
- Bull path — Trigger: NVIDIA's "historic" quarter and Salesforce's earnings hold; the AI capex bubble and SaaSpocalypse narratives continue to reverse (All-In). Probability: Not established by the available evidence. Target: Not established by the available evidence. Support: All-In Podcast.
- Base path — Jackson Hole delivers scheduled commentary without a shock; Warsh's remarks are digested without a binary move; token-pricing concerns remain an unresolved but non-immediate structural issue. Probability: Not established by the available evidence. Target: Not established by the available evidence. Support: Trade Brigade (event framing), The Compound (structural watch).
- Bear path — Trigger: Warsh's Jackson Hole speech triggers negative market reaction (Trade Brigade's "crash" scenario), or the GitHub Copilot token-cost problem spreads, validating The Compound's AI bear case; All-In adds Bessent/Druckenmiller bond-market tension as macro risk. Probability: Not established by the available evidence. Target: Not established by the available evidence. Note — explicit disagreement: All-In claims the AI bear narrative has already reversed, directly contradicting The Compound's freshly published bear case. No averaging applied.
6. Chronological Stream (📌)
- [09:40 ET] | Trade Brigade | [LIVE] Pre-Market Prep – JACKSON HOLE – Will Kevin Warsh Crash Or Save Markets?! | Warsh's Jackson Hole speech framed as a binary crash-or-save event for markets.
- [13:39 ET] | The Compound | The Bear Case for AI | A general bearish AI thesis presented; specifics unverified.
- [19:31 ET] | The Compound | The Problem With AI Pricing | Microsoft's June 1 GitHub Copilot pricing change is unsustainable — $5,000 of tokens consumed against a $40 subscription.
- [21:37 ET] | All-In Podcast | Nvidia's Historic Quarter, SaaS Comeback, Bessent vs Druck, America's Debt Crisis, Cancer Vaccine | NVIDIA/Salesforce earnings reversed AI bear narratives while Bessent's bond-market moves drew Druckenmiller's criticism.
7. Evidence-Bound Watchlist (🎯)
- Jackson Hole / Warsh remarks — confirm Warsh's speaking time and actual comments; verify market reaction for Trade Brigade's crash-or-save premise. Source: https://www.youtube.com/watch?v=JHPRSvGdtHA
- GitHub Copilot pricing — verify the June 1 change, the $5,000-tokens-vs-$40 claim, and token-cost trajectory cited by The Compound. Sources: https://www.youtube.com/watch?v=xqZNa2m2mm0, https://www.youtube.com/watch?v=aamUiSXvea0
- Post-earnings continuity and Treasury buybacks — monitor NVIDIA and Salesforce price action to see if the rally holds, and verify the $1T Bessent Treasury buyback details via the linked CNBC article. Source: https://www.youtube.com/watch?v=1u5dMAKl_ks
Daily Intelligence Brief — August 28, 2026 (Pre-Market)
1. Executive Summary (📰)
Sentiment is bifurcated between a macro-focused long-horizon narrative (fiscal risk, bond buybacks, Bitcoin revival) and a short-term technical pre-market session with no disclosed directional calls. Both sources are metadata-only; no actionable levels, targets, or probabilities are established.
2. Narrative Over Time (⏳)
- Aug 27, 21:14 ET — The Compound (ep. 479) surfaces macro and structural themes: Treasury bond buybacks, Stanley Druckenmiller's fiscal op-ed, government debt risk, private market fraud, and Bitcoin's "woke up" move. Commentary frames the "end of the Go-Go years" and cultural shifts in finance. No trade parameters disclosed.
- Aug 28, 05:06 ET — TheChartGuys publish a pre-market livestream targeting the Aug 31 session, describing sector-wide analysis and key setups without citing specific tickers, levels, or entries.
- Net evolution — The macro narrative (debt, fiscal sustainability, asset-class sentiment) precedes and frames the technical session, but the two sources do not cross-reference or reconcile views.
3. Key Technical Levels & Signals (📈)
- TheChartGuys — No tickers, price levels, zones, or signals are present in the available metadata. The stream title references Aug 31 but provides no numeric content.
- The Compound — No technical levels cited. Bitcoin movement is referenced qualitatively ("woke up") without price data.
- Exact values: Unavailable across all sources. All evidence is metadata-only and unverified.
4. Long-Horizon Macro & Structural Views (🌍)
- Treasury bond buybacks — Discussed as a potential central-bank/government action affecting the rate complex (The Compound).
- Government debt risk — Framed as a real fiscal sustainability concern; Druckenmiller's op-ed cited (The Compound).
- Bitcoin sentiment shift — Referenced as a notable market move (The Compound).
- "Most hated asset class" — Sentiment-reversal or contrarian theme discussed (The Compound).
- End of the "Go-Go years" — Suggested regime or behavioral shift in markets (The Compound).
- Private market fraud — Flagged as a risk to private asset valuations (The Compound).
- Housing & transportation costs — Identified as consumer/inflation pressure points (The Compound).
Analyst interpretation: These are watch topics only. Direction, magnitude, and conviction are not established by the metadata.
5. Scenario Analysis (🔄)
- Bull — Trigger: Normalization of the fiscal-debt narrative and confirmation of sustained Bitcoin upside. Supporting creators: The Compound. Probability/target: Not established by the available evidence.
- Base — Trigger: Continued macro drift without resolution — bond buyback speculation persists, Bitcoin consolidates, sector rotation continues with no clean setup. Supporting creators: The Compound, TheChartGuys (implicitly, via neutral framing). Probability/target: Not established by the available evidence.
- Bear — Trigger: Escalation of debt-risk concerns, private market fraud headlines, or a negative Bitcoin reversal. Supporting creators: The Compound (thematic only). Probability/target: Not established by the available evidence.
Note: The two creators do not conflict on scenario views — they operate at different horizons (macro vs. intraday) and neither discloses probabilities, targets, or entry conditions.
6. Chronological Stream (📌)
- [21:14 ET Aug 27] | The Compound | Would You Want a Sponsored Wedding? | Maco discussion of bond buybacks, debt risk, Bitcoin's move, and private market fraud; no trade calls.
- [05:06 ET Aug 28] | TheChartGuys | Live Stock Market Analysis - Aug 31 | Pre-market review of sectors and setups for the Aug 31 session; no disclosed levels.
7. Evidence-Bound Watchlist (🎯)
- Treasury buyback announcements — Verify any official statements or reports following The Compound's discussion, and their impact on 10Y/30Y yields.
- Bitcoin price/volume confirmation — Source the "woke up" claim against actual price and volume data for the Aug 27–28 window.
- Druckenmiller op-ed content — Locate the referenced fiscal-risk op-ed to validate or refute the debt-sustainability claims, and check for housing/transportation cost-index releases that would support the inflation-pressure theme.
All claims above are attributed creator statements from metadata-only evidence and remain unverified pending transcript or full-video review.
Daily Intelligence Brief — 2026-08-27
1. Executive Summary (📰)
The dominant catalyst is NVIDIA's Q2 earnings, which by the end of the session is credited with "saving markets" while its durability is openly questioned. A secondary thread pairs long-horizon macro concerns (government debt, Treasury buybacks, housing) with structural critiques of US science and open-source AI policy.
2. Narrative Over Time (⏳)
- Aug 26, 15:00 ET — Gavin Baker (All-In) frames open-source AI as a patriotic national-interest priority; no financial parameters.
- Aug 26, 22:07 ET — Animal Spirits (EP 479) opens a macro scan: Treasury bond buybacks, Druckenmiller op-ed, government debt risk, housing/transportation costs; "Bitcoin woke up" noted without magnitude.
- Aug 26, 22:16 ET — Trade Brigade launches a live NVDA Q2 earnings session with pre-market technicals; no levels disclosed in metadata.
- Aug 26, 23:00 ET — Eric Weinstein (All-In) pivots to structural science decline, peer-review failure, and speculative claims about Renaissance Technologies and UAPs.
- Aug 27, 00:41–01:09 ET — The Compound warns against gut-driven trading amid the "peak AI spending" debate; TheChartGuys assess whether NVDA earnings lift the market and test a metals bull thesis.
- Aug 27, 01:42 ET — The Compound (transcript-backed) grounds long-term optimism in historical return/drawdown baselines since 1928.
- Aug 27, 03:00–11:31 ET — Weinstein re-aired; Trade Brigade delivers midweek technicals (SPY, QQQ, IWM, sectors) and then declares NVDA earnings saved markets — asking whether the rally holds.
Aggregate sentiment: AI earnings catalyst resolved positively, with residual skepticism about sustainability and the peak-AI question unresolved.
3. Key Technical Levels & Signals (📈)
- NVDA as market-lifting driver and the "peak AI spending" debate catalyst — TheCompound, TheChartGuys, Trade Brigade (no price levels in evidence).
- SPY, QQQ, IWM, S&P sectors support/resistance claimed — Trade Brigade, exact levels not stated in evidence.
- Metals bull thesis under examination — TheChartGuys, no invalidation levels in evidence.
- Bullish materials sector setup asserted — TheCompound, no specifics.
- Transcript-backed historical baselines (TheCompound, video #7, not current technicals): ~95% of years since 1928 contained a ≥5% peak-to-trough drawdown; six months with ≥20% losses; worst 30-year annual return ~8% (starting 1929); only one calendar year in 100 posted 8–10% returns.
- "Bitcoin woke up" — Animal Spirits, no levels, magnitude, or timeframe.
Exact current price levels, entries, stops, and targets: not established by the available evidence across all sources.
4. Long-Horizon Macro & Structural Views (🌍)
- Open-source AI as national-interest priority — Gavin Baker via All-In (patriotic framing).
- US government debt risk and Treasury buybacks as persistent macro overhang — Animal Spirits.
- Peak AI spending question — whether AI capex growth can sustain current valuations — TheCompound.
- US scientific stagnation: peer-review failure, talent poaching by China, proposed funding reforms — Eric Weinstein (unverified, opinion-based).
- Historical equity optimism: even the worst 30-year US return was positive (~8%/yr); trends can persist far longer than expected (1940s–60s run; Japan's 30-year failure as the cautionary exception) — TheCompound.
- Housing/transportation cost pressure as a consumption/societal drag — Animal Spirits.
5. Scenario Analysis (🔄)
- Bull: NVDA earnings confirm resilient AI demand and companies (e.g., Airbnb, Delta) use AI to deliver earnings surprises (TheCompound; NVDA "lifts market," ChartGuys; "EARNINGS SAVE MARKETS," Trade Brigade). Probability/target: Not established by the available evidence.
- Base: NVDA earnings are mixed; the peak-AI-spending question stays unresolved without market-breaking news (TheCompound). Probability/target: Not established by the available evidence.
- Bear: NVDA guidance suggests AI spending is peaking, triggering de-rating in AI-related names (TheCompound). Macro overlay: prolonged drawdown risk per historical baselines (TheCompound transcript) and Japan-style regime failure as the named exception. Probability/target: Not established by the available evidence.
Disagreement is present: Trade Brigade/ChartGuys treat NVDA's earnings as a positive, market-saving catalyst; TheCompound explicitly flags peak-AI as an unresolved risk that could invert the trade. No source quantifies probabilities or targets.
6. Chronological Stream (📌)
[15:00 ET]| All-In Podcast | Gavin Baker: If you're a patriot, you should be pro-open source AI | Open-source AI framed as a US national-interest priority.[22:07 ET]| The Compound | Animal Spirits EP 479 OUT NOW! | Macro scan: Treasury buybacks, debt risk, housing costs; Bitcoin "woke up."[22:16 ET]| Trade Brigade | [LIVE] NVIDIA Q2 Earnings – Technicals & Jensen Conference Call | Live pre-market technicals on NVDA earnings; no levels in metadata.[23:00 ET]| All-In Podcast | State of American Science… with Eric Weinstein | US science stagnating; radical reform proposals; speculative claims on physics/Renaissance Tech.[00:41 ET]| The Compound | Why You Can't Trust Your Gut With Stocks | Trust data over instinct; AI-driven earnings surprises are the biggest opportunity; materials bullish.[01:09 ET]| TheChartGuys | NVDA Lifts Market | NVDA-driven market strength; metals bull thesis under rotation-based review.[01:42 ET]| The Compound | 10 Things Every Investor Needs to Know (transcript) | Stocks rise over long horizons despite frequent, lumpy drawdowns; worst 30-yr return still positive.[03:00 ET]| All-In Podcast | Eric Weinstein: State of American Science… (re-air) | Repeat of structural science critique.[03:04 ET]| Trade Brigade | These Two RARELY Move Together | Midweek technicals on SPY/QQQ/IWM/sectors + trade-idea names; unnamed pair in title.[11:31 ET]| Trade Brigade | [LIVE] Pre-Market Prep – NVDA EARNINGS SAVE MARKETS – Will it hold!? | NVDA credited with saving markets; sustainability questioned.
7. Evidence-Bound Watchlist (🎯)
- NVDA post-earnings price action and guidance — verify whether the "save markets" claim (Trade Brigade, 11:31 ET) holds and whether peak-AI fears (TheCompound) are confirmed or refuted.
- US government debt / Treasury buyback indicators — check Animal Spirits' referenced Druckenmiller op-ed and current debt-cost data against the "real debt risk" claim.
- Metals/materials positioning — validate ChartGuys' metals bull thesis and TheCompound's bullish materials setup against sector price action, since no invalidation levels were disclosed.
Daily Intelligence Brief — Market-Creator Commentary Synthesis
Coverage Window: 2026-08-25 11:30 ET – 2026-08-26 07:30 ET
1. Executive Summary (📰)
Creator sentiment concentrated around one converging short-term catalyst — NVDA earnings — set against a structural debate on AI capex sustainability and government debt risk. A crypto-bullish technical claim (bond-news follow-through) ran parallel. Two non-market segments (police surveillance, COVID-era science criticism) carried no investment content.
2. Narrative Over Time (⏳)
- Aug 25, 11:30 ET: All-In's Flock interview opened the window on a long-horizon product/regulatory note (mandatory abuse-detection feature in surveillance cameras) — no market catalyst.
- 11:50 ET: TheChartGuys shifted to short-term crypto bullishness, attributing upside "follow-through" to bond news and flagging altcoin entries.
- 14:00 ET: David Sacks (All-In) introduced a structural AI-policy risk framing: preferred regulation would "destroy" Anthropic.
- 16:11 ET: Fauci segment — non-market; public-trust-in-science commentary.
- 22:39 ET (Aug 25): The Compound pivoted to the AI-trade sustainability question head of NVDA earnings, naming ABNB and DAL as AI beneficiaries and calling a bullish materials setup.
- Aug 26, 06:00 ET: Animal Spirits widened into macro structure — Treasury bond buybacks, government debt risk (Druckenmiller op-ed), Bitcoin's resurgence, private market fraud.
- 07:30 ET: Trade Brigade closed the window with pre-market NVDA earnings prep — the cycle's single most-cited catalyst.
3. Key Technical Levels & Signals (📈)
- No exact price levels, zones, or targets were cited in any source summary. All per-video technical sections record "Not established by the available evidence."
- TheChartGuys: Claim of crypto "equilibriums breaking bull" to the upside, altcoin focus, bond news as catalyst — no figures given.
- Trade Brigade: NVDA earnings framed as the primary volatility event; pre-market technical analysis asserted, but no specific levels contained in the evidence.
4. Long-Horizon Macro & Structural Views (🌍)
- AI capex sustainability posed as an open question; NVDA earnings as a phase indicator for the AI trade (The Compound).
- ABNB, DAL positioned as AI beneficiaries via potential earnings surprises; materials sector described as "bullish setup" (The Compound).
- Government debt risk highlighted via Stanley Druckenmiller's op-ed; Treasury bond buybacks discussed as potential support mechanism (Animal Spirits).
- AI regulation as existential-sounding risk: David Sacks claims Dario Amodei's preferred policies would destroy Anthropic (All-In).
- Private market fraud as structural risk; "end of the Go-Go years" regime-change framing; housing/transportation costs as consumer drags (Animal Spirits).
5. Scenario Analysis (🔄)
- Bull: NVDA earnings confirm sustained AI demand and AI-using companies (ABNB, DAL) surprise to the upside — supported by The Compound's and Trade Brigade's framing; crypto upside breakouts continue per TheChartGuys. Probability/targets: Not established by the available evidence.
- Base: Mixed signals on AI spending produce sector rotation across the named beneficiaries; NVDA guides cautiously (The Compound). Probability/targets: Not established by the available evidence.
- Bear: Peak AI spending is confirmed, or restrictive AI regulation is enacted (Sacks, re: Anthropic); government debt risk crystallizes (Animal Spirits). Probability/targets: Not established by the available evidence.
- Explicit disagreement: The Compound treats peak-AI-spending as an open empirical question; Sacks asserts a categorical policy-driven destruction outcome — the two conflict on mechanism and severity, and this divergence is not reconciled in the source material.
6. Chronological Stream (📌)
- [11:30 ET] | All-In Podcast | Flock CEO on Catching Bad Cops | Under a dozen abuses in 8 years; mandatory abuse-detection feature; no market content.
- [11:50 ET] | TheChartGuys | Crypto Bulls Make a Statement | Bond news drives upside follow-through; altcoins in focus.
- [14:00 ET] | All-In Podcast | David Sacks: If Dario Got His Way on AI Regulation | Regulation would "destroy" Anthropic — structural policy claim.
- [16:11 ET] | All-In Podcast | Fauci Hurt Science | Contradictory COVID guidance eroded trust; no investment relevance.
- [22:39 ET] | The Compound | Are You a Fan of Airbnb? | AI-spending peak question; ABNB/DAL as AI beneficiaries; bullish materials.
- [06:00 ET] | The Compound | Are Free Markets Dead? | Treasury buybacks, government debt risk, Bitcoin resurgence, private market fraud.
- [07:30 ET] | Trade Brigade | Pre-Market Prep – NVDA Earnings | NVDA reported as the central catalyst for futures/options traders.
7. Evidence-Bound Watchlist (🎯)
- NVDA earnings release and guidance — the single converging catalyst cited by The Compound and Trade Brigade; verify whether AI infrastructure spending commentary supports or contradicts the peak-spending thesis.
- Crypto price action following bond news — validate TheChartGuys' "equilibriums breaking bull" claim, which currently lacks any specific levels.
- Government debt risk discussion — verify Druckenmiller's op-ed substance and any Treasury buyback or debt-service data referenced by Animal Spirits.
All creator claims above are quoted source material, not verified fact or instruction. No levels, targets, or probabilities were supplied in the underlying evidence and none are inferred here.
Daily Intelligence Brief — 2026-08-25
1. Executive Summary (📰)
Creators across The Compound and All-In podcasts maintain a structurally bullish stance on equities, anchored on powerful corporate earnings and hyperscaler AI capex, while flagging rising long-term Treasury yields, U.S. debt, and AI regulatory capture as the principal bear risks. Near-term attention centers on NVDA earnings as the next catalyst that could validate or break the prevailing regime.
2. Narrative Over Time (⏳)
Morning creator commentary (The Compound, 09:29 ET) framed the bull market as earnings- and AI-capex-driven, dismissing bearish counterarguments as "moving goalposts." By early afternoon (All-In, 13:45 ET), focus shifted to a structural warning: a predicted step-by-step regulatory capture process that could effectively ban open-source AI models. Mid-afternoon (The Compound, 17:00 ET), the macro risk resurfaced — rising long-term Treasury yields, driven by real yields rather than inflation, were deemed the key variable for stocks. Evening commentary (All-In, 19:30 ET) expanded to science policy: claims of a U.S. R&D stagnation and a China spending gap, with "bold bets" proposed as the countermeasure. Late evening (The Compound, 21:48 ET) crystallized the market's implicit assumption: no recession for five years, evidenced by hyperscaler leverage and low VIX. Next morning (All-In, 07:00 ET) contained an off-topic storytelling segment, followed by short-term technical pre-market prep (Trade Brigade, 07:34 ET) flagging a potential bounce and questioning whether to fade it ahead of NVDA earnings.
3. Key Technical Levels & Signals (📈)
- Long-term Treasury yields — rising; the move is attributed to real yields, not inflation (The Compound). Specific yield levels: unavailable.
- VIX — described as "very low" (The Compound). Specific index values: unavailable.
- Correlations — described as "low," enabling sector selection (The Compound). Specific correlation figures: unavailable.
- S&P 500 — valuations and three paths to new highs discussed via DataTrek fair-value grid, published every 2–3 weeks (The Compound). Specific price levels: unavailable.
- Pre-market bounce — identified in live session; directional stance posed as a question ("FADE it?!") rather than a claim (Trade Brigade). Specific levels: unavailable.
4. Long-Horizon Macro & Structural Views (🌍)
- Corporate earnings strength is the primary bull-market support; AI capex returns are the key question (The Compound).
- Market implicitly prices no recession for five years, evidenced by hyperscaler balance-sheet leverage and low aggregate volatility (The Compound).
- Regulatory capture risk: a "FINRA for AI" self-regulatory body could set compliance standards that open-source models cannot meet, codify them into law, and effectively ban open-source AI (All-In).
- U.S. science policy shift: redirecting federal funds from DEI/climate research toward quantum (by 2028), fusion (by 2035), and lunar missions (2028); claimed U.S. stagnation via Eroom's Law and aging NIH researchers (All-In).
- U.S.–China tech race: claimed R&D spending gap cited at $33B vs. $670B; 7 of 10 STEM PhDs claimed to be foreign (All-In).
- Rising long-term Treasury yields, not inflation, identified as the macro variable to watch for equities (The Compound).
5. Scenario Analysis (🔄)
- Bull: Corporate earnings remain powerful; AI capex delivers measurable returns; no recession materializes over the next five years; sector rotation continues. Supported by The Compound (episodes on Sandisk, Big Tech no-recession bet). Probability/targets: Not established by the available evidence.
- Base: Market breadth and rotation persist; real yields drift higher without breaking equities; hyperscaler capex continues as strategic spending. Supported by The Compound (10-Year Treasury episode). Probability/targets: Not established by the available evidence.
- Bear: A recession emerges or is perceived as imminent, breaking the 5-year no-recession assumption and raising both VIX and correlations; alternatively, AI regulatory capture succeeds in shutting out open-source models, or AI capex fails to generate expected returns. Supported by The Compound (rate/debt risk) and All-In (regulatory capture). Disagreement: The Compound dismisses bearish arguments as "moving goalposts," while All-In treats the regulatory risk as a credible, deliberate playbook. Probability/targets: Not established by the available evidence.
6. Chronological Stream (📌)
- [09:29 ET | 2026-08-24] | The Compound | Nobody Saw the Sandisk Boom Coming | Bull market strength is driven by earnings and AI capex while bears move goalposts.
- [13:45 ET | 2026-08-24] | All-In Podcast | David Sacks Predicts the Regulatory Capture Playbook to Ban Open Source AI | A step-by-step "FINRA for AI" process will impose closed-model standards that open models cannot meet.
- [17:00 ET | 2026-08-24] | The Compound | Why Every Trader on Earth is Watching the 10-Year Treasury Now | Real yields, not inflation, are driving Treasury yields — the key macro variable for equities.
- [19:30 ET | 2026-08-24] | All-In Podcast | Inside Trump's Science Agenda | Federal science funds are being redirected to bold bets while U.S. R&D stagnates relative to China.
- [21:48 ET | 2026-08-24] | The Compound | Big Tech Is Betting There's No Recession Coming | Low VIX, low correlations, and hyperscaler leverage imply a 5-year no-recession consensus.
- [07:00 ET | 2026-08-25] | Capital Allocators | Matthew Dicks: Why You Should Never Give Another Presentation | Business stories should be built from the narrative, not from slide decks. (No market content; flagged as non-financial.)
- [07:34 ET | 2026-08-25] | Trade Brigade | Pre-Market Prep – Here's the bounce... FADE it?! – NVDA Earnings Tomorrow | Pre-market technical bounce identified; NVDA earnings is the imminent catalyst.
7. Evidence-Bound Watchlist (🎯)
- NVDA earnings (tomorrow, per Trade Brigade) — the near-term catalyst that could validate or break the AI-capex thesis; verify official date/time and report contents.
- 10-Year Treasury real yields vs. inflation expectations — verify The Compound's claim that real yields, not inflation, are driving the rise; track DataTrek's next S&P 500 fair-value grid update.
- AI regulatory developments — watch for formation of any "FINRA for AI" self-regulatory body, standard-setting organization, or legislative proposals applying equal safety standards to open and closed models; track public statements from Dario Amodei and OpenAI on open-model regulation.
Daily Intelligence Brief — Crypto, AI Infrastructure & Market Structure
Date: 2026-08-24 | Session Window: 08/23 12:30 ET → 08/24 11:30 ET
1. Executive Summary (📰)
A single dominant structural thesis emerged — Bitcoin as the purest AI trade amid AI-driven terminal-value decay — while short-term tape commentary warned of an ugly open at an undefined critical support. Two of five sources carried no verifiable market claims; the rest are metadata-only and require confirmation.
2. Narrative Over Time (⏳)
- 08/23 12:30 ET — Visser: First major macro framing of the session. Bitcoin's three candles through the 200-day and a seven-sigma weekly move were cast as the third-wave adoption phase, mirroring AI infrastructure one year ago. Government intervention (Bessent yen action, Warsh supply-side task forces) framed as suppressing the 10-year range and supporting risk assets.
- 08/23 14:02 ET — TheChartGuys: No market claims; educational TA roadmap only. Flagged as non-contributing to sentiment.
- 08/23 20:30 ET — All-In Podcast: Structural debate layer added — David Sacks allegedly challenging Dario (likely Dario Amodei) on AI/data-center contradictions. No specifics verifiable from metadata.
- 08/24 11:00 ET — Capital Allocators: Non-market episode (marketing case study, "Kids love aquariums"). Transcript-backed but irrelevant to market sentiment; noted as anecdotal evidence.
- 08/24 11:30 ET — Trade Brigade: Late-session short-term bearish counterweight — "UGLY open at CRITICAL support" — but no ticker, level, or plan provided in metadata.
3. Key Technical Levels & Signals (📈)
- Bitcoin (per Visser): Three large candles through the 200-day; seven-sigma weekly move; the only two comparable prints in the last decade (April 2019, January 2023) roughly doubled within two months — creator claim, metadata-only.
- Ethereum (per Visser): 200-day turned up — creator claim, metadata-only.
- Gold & Silver (per Visser): "Joined" the move — no exact levels cited.
- S&P 500 vs. Semis (per Visser): Micron and IBM 90-day vol spiking while S&P does not move — flagged as unprecedented divergence. No values provided.
- 10-Year Treasury (per Visser): Range-bound 4–4.70; a breakout would invalidate his "fighting the government" framework.
- Trade Brigade: "Critical support" cited — level unavailable (metadata-only, no ticker).
4. Long-Horizon Macro & Structural Views (🌍)
- Bitcoin as the purest AI trade (Visser): AI agents compress innovation cycles and decay terminal value across all public companies, breaking DCFs; Bitcoin is the one asset not disrupted by AI. A 0% position implies a 0% probability of the thesis.
- Sovereign debt vs. Bitcoin (Visser): The system permits repeated spending of future time; Satoshi built Bitcoin to eliminate it. Crypto reframed as US financial dominance, not speculation.
- Stripe–OpenRouter acquisition (Visser): Cited as an agent-economy stack — money, compute, tokens, intelligence, revenue; "tokens are the new dollar."
- Policy layer (Visser): Bessent intervening on yen and changing quarterly refunding language; Warsh building five task forces around supply-side deflation; White House crypto event, Clarity Act pressure, and Treasury Genius Act rulemaking landing in the same window. Fed regime change implied.
- AI infrastructure debate (All-In): David Sacks vs. Dario on AI/data-center contradictions — public disagreement over the AI capex narrative; specifics unverified.
5. Scenario Analysis (🔄)
- Bull — Visser's third-wave adoption thesis triggers: Bitcoin's three candles through the 200-day + seven-sigma weekly move match April 2019 and January 2023 prints that roughly doubled within two months; Ethereum's 200-day turn-up and gold/silver confirmation support. Probability: Not established by the available evidence.
- Base — Constructive drift without breakout: Bitcoin holds above the 200-day; Ethereum leads as beta; tech momentum remains unhealthy for months; macro regime (range-bound 10-year, liquidity support) supports without explosive upside. Supported by Visser. Probability: Not established by the available evidence.
- Bear — Endgame bias inverts the tape: 10-year breaks 4–4.70, Fed hikes, oil to 200, AI bubble burst — reversing the third-wave thesis. Short-term foil: Trade Brigade's "ugly open at critical support" flags immediate downside risk at an unspecified level. Supported by Visser's risk scenario and Trade Brigade's (unverified) claim. Probability: Not established by the available evidence.
6. Chronological Stream (📌)
- [12:30 ET] | Jordi Visser | The AI Crypto Macro Nexus Point | Bitcoin as the purest AI trade; 200-day breakout with policy support, awaiting confirmation.
- [14:02 ET] | TheChartGuys | This makes your journey a lot easier! | Educational TA roadmap; no market claims.
- [20:30 ET] | All-In Podcast | Sacks Calls Out Dario's Contradictions on AI & Data Centers | AI infrastructure debate; specifics unverified.
- [11:00 ET] | Capital Allocators | Miller: Why Clarity Beats Cleverness | Marketing case study (99% sales lift claim); non-market content.
- [11:30 ET] | Trade Brigade | Pre-Market Prep — UGLY open at CRITICAL support | Short-term bearish open claim; no ticker or level specified.
7. Evidence-Bound Watchlist (🎯)
- Treasury/yen intervention trail (Visser's claim): Verify Bessent's quarterly refunding language changes, buyback announcements, and yen intervention via official Treasury/BOJ releases.
- Stripe–OpenRouter acquisition and crypto policy window (Visser's claim): Confirm deal announcement and the White House crypto event, Clarity Act pressure, and Genius Act rulemaking timeline.
- Trade Brigade's "critical support": Access the 08/24 video to extract the specific ticker and level — currently undefined in metadata; treat as unverified until confirmed.
Weekly Intelligence Brief — August 17–23, 2026
1. Executive Summary (📰)
Long-duration Treasury yields hit a 19-year high amid a global bond selloff, while equities proved unusually resilient; crypto strengthened into a White House meeting, and a contested AI-trade outlook (bull structural thesis versus bear valuation case) split creator commentary.
2. Narrative Over Time (⏳)
- Mon Aug 17–18: Week opens with retail-earnings focus — TJX, HD, TGT catalysts and weekend 13F digestion (Stock Market Live, 08/17). The Compound flags a 19-year high in long-term Treasury yields with pressure shifting from the front end to long-duration rates, alongside Big Tech off-balance-sheet AI commitments and Workday takeover reports (08/18 22:22).
- Tue Aug 19: BTC tightens a 3D equilibrium into a White House crypto meeting (TheChartGuys, 05:37). Animal Spirits presents "the best bear case on AI" with $3T in money markets and bond yields competing with stocks (10:00). Stock Market Live headlines a Moderna breakthrough and "Bessent pump" before TJX/TGT earnings (20:21).
- Wed Aug 20: "Young People: Stop Complaining" repeats the Animal Spirits 478 agenda — bull market, falling valuations, next recession, financial nihilism (00:29). Trade Brigade declares "The AI Trade Is FAILING" (03:22).
- Thu–Fri Aug 21: TCAF 256 frames the bull market as supported by powerful earnings and AI capex despite debt/rate concerns (10:00). All-In covers Dario's regulatory-capture essay, open-source AI ban risk, and a16z DOJ investigation (14:26). Stock Market Live reports the S&P "back in the box" at the top of its range on a big options expiration (21:32).
- Fri–Sat Aug 22–23: TheChartGuys links Bessent bond news to rips in metals/crypto and cancer-vaccine biotech volatility (13:48). Calacanis claims an AI backlash: "sharpening the guillotines" (18:26). Jordi Visser delivers the week's most complete structural thesis: Bitcoin as the purest AI trade via AI-driven terminal-value decay, with a Bessent/Warsh Fed-regime framework (08/23).
3. Key Technical Levels & Signals (📈)
- Treasury yields broke a 19-year high on long duration — The Compound (exact level not in evidence).
- BTC: tightening 3D equilibrium ahead of White House crypto meeting (TheChartGuys, 08/19); "three large candles through the 200-day" with comparable 7-sigma weekly prints (April 2019, January 2023) that roughly doubled within two months; Ethereum 200-day turned up; gold/silver joined (Jordi Visser, 08/23). Entry/stop/target levels: not established by the available evidence.
- 10-year yield: Visser frames a multi-year 4.00%–4.70% range; breakout above invalidates his thesis (Jordi Visser, 08/23).
- S&P 500 returned to the top end of its monthly range around options expiration — Stock Market Live, 08/21 (specific level not in evidence).
- Micron and IBM 90-day volatility spiked while the S&P did not move — described as unprecedented (Visser, 08/23).
- Trade Brigade chapters for SPY (00:50), QQQ (13:15), IWM (24:30) promise support/resistance levels — values not present in metadata.
4. Long-Horizon Macro & Structural Views (🌍)
- Global bond selloff pressures long duration after a front-end shift, concentrated in high-debt, politically dysfunctional countries — The Compound.
- $3T in money markets as potential equity competition or dry powder — The Compound (Animal Spirits 478; TCAF 256).
- Big Tech off-balance-sheet AI commitments as structural risk; Bill Ackman's Pershing Square pursuing permanent capital — The Compound.
- Visser: AI agents compress innovation cycles and decay terminal value; Bitcoin is the one asset not disrupted by AI, "the purest AI trade"; a 0% position implies 0% probability of the thesis — Jordi Visser.
- Fed regime change: Bessent's yen intervention and refunding-language changes; Warsh's five supply-side-deflation task forces — Jordi Visser.
- All-In: AI regulatory capture, SRO (FINRA/MPAA) governance models, open-source ban risk, a16z DOJ investigation; Calacanis "guillotine" AI-backlash metaphor.
- Flock (surveillance): 7-day retention claimed to solve 90% of crimes, 9 Georgia officers fired via internal audit, 20 cities re-adopting cameras — All-In.
5. Scenario Analysis (🔄)
- Bull: AI capex and corporate earnings remain powerful while Treasury pressure stays contained; Workday takeover reports confirm an enterprise-SaaS bottom; Bitcoin's third-wave adoption thesis confirmed by closes above the 200-day — supported by The Compound (TCAF 256: "market keeps going all the way up") and Jordi Visser (7-sigma print historically doubling in ~2 months; Ethereum 200-day up). Probability/target: Not established by the available evidence.
- Base: S&P range-bound with rotation and broadened breadth despite yield headwinds; TJX/TGT earnings proxy staples/consumer strength; put mania builds without a triggering event — supported by Stock Market Live (08/21 "back in the box") and The Compound (breadth/rotation discussion). Probability/target: Not established by the available evidence.
- Bear: Bond vigilantes drive a 10-year breakout above 4.00%–4.70% (Visser's stated invalidation); AI valuation compression plus off-balance-sheet commitments weigh; "the AI trade is failing"; recession and financial-nihilism indicators — supported by Animal Spirits, Trade Brigade, Stock Market Live (bond-vigilante pressure), All-In (AI backlash). Probability/target: Not established by the available evidence.
6. Chronological Stream (📌)
- [10:30] | Capital Allocators | Gary Klein: Pre-Mortem | A junior participant's single observation forced abandonment of a flawed Air Force plan.
- [20:20] | Stock Market Live | Retail Earnings & 13Fs | TJX, HD, TGT earnings and 13F digestion frame the week.
- [01:06] | All-In | Flock CEO | 7-day retention, 9 officers fired, 20 cities re-adopting cameras.
- [14:33] | The Compound | Josh Brown: Behind the Music | Metadata only; no thesis stated.
- [22:22] | The Compound | Treasury Yields Break 19-Year High | Global long-duration selloff; AI off-balance-sheet commitments.
- [02:04] | The Compound | Spotify 1B Subscribers? | Media-scale question amid bond selloff and AI capex.
- [05:37] | TheChartGuys | BTC Strength Into Event | Tightening 3D equilibrium ahead of White House crypto meeting.
- [10:00] | The Compound | Best Bear Case on AI | $3T money markets, yield competition, AI outcomes debate.
- [11:00] | Capital Allocators | Pre-Mortem Framing | "Crystal-ball" reframing is the key to effective pre-mortems.
- [12:42] | All-In | Saronic CTO | Metadata only; no investment content.
- [17:47] | The Compound | When Will Market Crash Again? | Crash recurrence, longevity risk, stocks vs real estate.
- [20:21] | Stock Market Live | MRNA Breakthrough & Bessent Pump | Headline catalysts unverified; TJX/TGT define staples.
- [00:29] | The Compound | Young People: Stop Complaining | Bull market, falling valuations, financial nihilism, $3T money markets.
- [01:30] | TheChartGuys | Cancer Cured? Crypto Explodes! | Metals bull thesis; rotational scenarios; sensational title.
- [03:22] | Trade Brigade | The AI Trade Is FAILING | Midweek SPY/QQQ/IWM review; core list for options.
- [10:00] | The Compound | How to Play the Money Game | Powerful earnings and AI capex support the bull; debt/rates risk.
- [11:00] | Capital Allocators | Paul Johnson Pre-Mortem | Leader missed 4 of 5 path-critical risks; cognitive diversity value.
- [12:22] | The Compound | Real Estate vs Stocks | Longevity risk, crash question, inflation and spending rates.
- [14:26] | All-In | Dario, Datacenter Panic, AI Doomer | AI regulatory capture; FINRA/MPAA SRO models; a16z DOJ probe.
- [16:02] | The Compound | Michael Santoli | Metadata only; no identifiable thesis.
- [20:33] | The Compound | One of the Strangest Bull Markets | Bull resilience amid bond selloff; SaaS bottom question.
- [21:03] | The Compound | Olive Garden of Comedy? | Animal Spirits topics: money markets, valuations, AI debate.
- [21:32] | Stock Market Live | Back In The Box | S&P returns to range top on big options expiration.
- [13:48] | TheChartGuys | Bonds Move Shakes Up Markets | Bessent bond news rips metals/crypto; vaccine biotech volatility.
- [18:16] | Trade Brigade | It's Now or Never | Urgent setups across core lists; no levels in metadata.
- [18:26] | All-In | Calacanis: Sharpening the Guillotines | America's AI backlash as structural force.
- [12:30] | Jordi Visser | AI Crypto Macro Nexus | Bitcoin as purest AI trade; Bessent/Warsh Fed framework.
- [14:02] | TheChartGuys | Free TA Roadmap | Educational promo; no market claims.
7. Evidence-Bound Watchlist (🎯)
- Verify the 19-year high long-term Treasury yield level and whether the 10-year breaks the 4.00%–4.70% range cited by Visser — his stated invalidation trigger for the bullish macro/crypto thesis.
- Verify the $3T money-market figure against Federal Reserve/ICI data — cited repeatedly by The Compound (Animal Spirits 478; TCAF 256) as an equity-competition or dry-powder indicator.
- Confirm TJX/TGT actual earnings versus expectations and any Workday takeover confirmation — both framed by multiple creators as sector-defining catalysts for staples/consumer and enterprise SaaS.
WEEKEND INTELLIGENCE BRIEF
August 21–23, 2026
1. Executive Summary (📰)
Creator commentary converged on two dominant themes: a global bond selloff pressuring long-term rates is testing equity market resilience, while AI infrastructure spending and associated regulatory backlash emerged as the central structural risk. Multiple sources noted unusual bull market persistence despite elevated valuations, with money-market cash at $3 trillion cited as a key technical backdrop.
2. Narrative Over Time (⏳)
Friday, August 21: The Compound's TCAF 256 (10:00 ET) framed the bull market as supported by earnings and AI capex despite debt concerns. Capital Allocators (11:00 ET) shifted focus to decision-making process, highlighting pre-mortem analysis for risk identification. The Compound's "Real Estate vs Stocks" (12:22 ET) covered longevity risk and asset allocation. All-In Podcast (14:26 ET) introduced AI regulatory-capture themes and data center backlash, while Santoli's TCAF episode (16:02 ET) mirrored the morning's content. "Strangest Bull Markets Ever" (20:33 ET) flagged off-balance-sheet Big Tech AI commitments. Stock Market Live (21:32 ET) reported the S&P 500 falling to the top of its range after "historic" Treasury action.
Saturday, August 22: TheChartGuys (13:48 ET) reported Bessent bond news triggered rips in metals and crypto. Trade Brigade (18:16 ET) pushed urgent index and large-cap technical analysis. All-In's Calacanis segment (18:26 ET) escalated to "They're Sharpening the Guillotines" rhetoric on AI backlash.
Overarching narrative: Bond vigilante pressure intensified through the week, yet equity indices showed resilience—creating tension between macro risk and market momentum.
3. Key Technical Levels & Signals (📈)
- S&P 500: Re-entered the top end of a previously identified range; no specific price levels provided (Stock Market Live).
- SPY/QQQ/IWM: Technical analysis segments at 00:50, 13:15, and 24:30 respectively; levels unavailable (Trade Brigade).
- S&P Sectors: Analysis at 29:45; no levels provided (Trade Brigade).
- No other specific levels, zones, or invalidation points are established by the available evidence.
4. Long-Horizon Macro & Structural Views (🌍)
- Bond market: Global selloff pressure shifting from front-end to long-term rates (The Compound); "bond vigilantes" pressuring markets (Stock Market Live).
- AI capex: "Massive off-balance-sheet AI commitments" from Big Tech flagged as hidden leverage risk (The Compound); AI regulatory capture and data center backlash discussed (All-In Podcast); Calacanis claims societal "guillotines" being sharpened (All-In Podcast).
- Enterprise SaaS: Possible bottom signaled by Workday takeover reports (The Compound).
- Capital structure: Pershing Square's search for permanent capital described as structural evolution (The Compound).
- Money markets: $3 trillion cited as competing with equities (The Compound).
- Policy: FINRA vs. MPAA SRO models for AI governance debated (All-In Podcast); potential open source AI ban risk (All-In Podcast); midterm election dynamics and DOJ investigation of a16z noted (All-In Podcast).
- Demographics: Longevity risk increasingly relevant for allocation planning (The Compound).
5. Scenario Analysis (🔄)
- Bull: Corporate earnings continue growing and AI spending delivers returns, sustaining valuations; Workday takeover confirms enterprise SaaS bottom; money markets rotate into equities. Support: The Compound, Stock Market Live (break above range). Probability/targets: Not established by the available evidence.
- Base: Market persists within established ranges amid mixed signals—bond competition, AI uncertainty, and falling valuations offsetting resilient earnings; weekly consolidation continues. Support: TheChartGuys, Stock Market Live. Probability/targets: Not established by the available evidence.
- Bear: Global bond selloff intensifies long-end pressure; Big Tech off-balance-sheet AI commitments create hidden leverage; debt load or AI capex failures trigger valuation compression; recession or intensified AI regulatory backlash materializes. Support: The Compound, All-In Podcast, Stock Market Live. Probability/targets: Not established by the available evidence. Disagreement: The Compound and Stock Market Live differ on whether bond pressure will meaningfully break equities—the former notes persistent market strength, the latter emphasizes range-bound resistance.
6. Chronological Event Log (📅)
[2026-08-21 10:00 ET]| The Compound | Bull market supported by earnings and AI capex despite debt and rate concerns[2026-08-21 11:00 ET]| Capital Allocators | Pre-mortem analysis reveals cognitive diversity failures in risk identification[2026-08-21 12:22 ET]| The Compound | Stocks vs. real estate comparison addresses longevity risk and inflation[2026-08-21 14:26 ET]| All-In Podcast | Dario essay covers AI regulatory capture; DOJ investigating a16z; SRO debates[2026-08-21 16:02 ET]| The Compound | Santoli's TCAF episode mirrors earlier content; metadata sparse[2026-08-21 20:33 ET]| The Compound | Global bond selloff, Big Tech off-balance-sheet AI commitments, SaaS bottom debate[2026-08-21 21:03 ET]| The Compound | Covers $3T money markets, bond yields competing with stocks, recession timing[2026-08-21 21:32 ET]| Stock Market Live | S&P falls back to range top after historic Treasury week[2026-08-22 13:48 ET]| TheChartGuys | Bessent bond news triggers metals/crypto rips; biotech volatility on cancer vaccine news[2026-08-22 18:16 ET]| Trade Brigade | Urgent technical setups across SPY, QQQ, IWM; core list of 12 large-cap names[2026-08-22 18:26 ET]| All-In Podcast | Calacanis claims "They're Sharpening the Guillotines" on AI backlash
7. Watchlist (🎯)
- Bond yields: Monitor long-term Treasury yields for sustained upward pressure; verify Bessent news specifics and market response (TheChartGuys, Stock Market Live).
- Big Tech AI commitments: Review quarterly filings for off-balance-sheet disclosure; assess ROI evidence (The Compound).
- Enterprise SaaS: Track Workday takeover news flow and sector sentiment (The Compound).
- AI regulation: Monitor SRO proposals, open source ban risk, and DOJ investigation of a16z; seek transcripts of All-In segments (All-In Podcast).
- Money markets: Verify $3T figure against Fed/ICI sources; watch rotation into equities (The Compound).
- Index levels: Confirm SPY/QQQ/IWM setups via video timestamps; require explicit price levels before any assessment (Trade Brigade).
- Metals and crypto: Confirm Bessent-related rips with independent price data (TheChartGuys).
- Pershing Square: Watch for permanent capital structure announcements (The Compound).
- Pre-mortem methodology: Full Capital Allocators EP.109 needed to verify process claims (Capital Allocators).
- Verification note: All items above are metadata-derived; transcript access is required to upgrade any item from watch-level to evidence-backed.
DAILY INTELLIGENCE BRIEF — FINANCIAL CREATOR COMMENTARY
Date of Coverage: 2026-08-22 (Session Window: 13:48 – 18:26 ET)
1. Executive Summary
Creator sentiment split between short-term technical catalysts (unexpected bond news, biotech volatility) and a long-horizon structural warning regarding an accelerating public/political backlash against AI. Trading-focused commentary was largely unverified, with no specific entry or level data available in the source evidence.
2. Narrative Over Time
The session opened with TheChartGuys at 13:48 ET, attributing a cross-asset market shuffle (metals, crypto strength; biotech volatility) to surprise bond news from Bessent and a cancer vaccine headline. This positioned immediate catalysts at the center of short-term technicals.
By 18:16 ET, Trade Brigade posted an urgent ("it's now or never") video, claiming multiple index and large-cap tech setup opportunities but provided no traceable price levels or risk parameters in the available evidence.
Closing the session at 18:26 ET, the All-In Podcast shifted the focus from technicals entirely, to a long-horizon macro thesis. The claim warns of severe structural backlash against AI, described metaphorically as "sharpening the guillotines."
Chronological Picture: Immediacy of news-driven catalysts (bonds, biotech) transitioned into an urgent technical assessment and finally into a weighty macro/structural social-political forecast — three distinct horizons with no narrative overlap between technicals and structural risk.
3. Key Technical Levels & Signals
- TheChartGuys: Claimed a ripping move in metals and crypto following Bessent bond news; no specific ticker, level, or price provided. Noted ongoing weekly consolidation "in many places."
- Trade Brigade: Cited technical segments on SPY (00:50), QQQ (13:15), IWM (24:30), and S&P sectors (29:45). Core list: NVDA, AAPL, MSFT, AMZN, GOOGL, AVGO, META, MU, TSLA, JPM, AMD, INTC. No exact support/resistance figures available.
- All-In Podcast: No technical levels cited.
4. Long-Horizon Macro & Structural Views
- Claimed macro driver #1: Surprise bond news from Bessent as a catalyst for cross-asset moves (TheChartGuys).
- Claimed sector driver: Cancer vaccine news as a biotech volatility trigger (TheChartGuests).
- Claimed structural theme: America is experiencing a serious backlash against AI, potentially escalating into a severe political/societal reaction (All-In Podcast).
- Claimed macro/capital rotation: Metals and crypto strength read as a response to fixed-income news (TheChartGuys).
5. Scenario Analysis
Creators addressed distinct horizons, making a single collective scenario difficult to reconcile. The three consolidated scenarios are characterized below based on contributors' specific claims.
- Bull Scenario: Trigger is confirmation of sustained strength in metals/crypto and a constructive resolution of the Bessent bond news. Supported by TheChartGuys; Trade Brigade's "now or never" framing implies a bull case in indices/large caps, but this is unverified in the evidence. Probability/Targets: Not established by the available evidence.
- Base Scenario: Markets continue absorbing the bond surprise via weekly consolidation, with short-term volatility in biotech/news-specific names. Supported by TheChartGuys. Probability/Targets: Not established by the available evidence.
- Bear Scenario: Trigger is the realization of the claimed AI backlash leading to structural de-rating of the AI complex. Supported by All-In Podcast. Probability/Targets: Not established by the available evidence. Note: this scenario is unrelated to the short-term market drivers cited by the other creators; no direct disagreement exists, merely separate focus areas.
6. Chronological Stream
- [13:48 ET] | TheChartGuys | "Bonds Move Shakes Up Markets" quex | Claimed bond news (Bessent) driving rips in metals/crypto and biotech volatility; markets otherwise consolidating weekly.
- [18:16 ET] | Trade Brigade | "It's now or never..." | Claimed urgent setups across indices (SPY, QQQ, IWM) and a large-cap core list (NVDA, AAPL, MSFT, etc.); specifics unverified in metadata.
- [18:26 ET] | All-In Podcast | "Jason Calacanis on America's AI Backlash: 'They're Sharpening the Guillotines' | Claimed an escalating structural societal/political AI backlash; evidence not provided beyond the headline claim.
7. Evidence-Bound Watchlist
- Bessent Bond News: Verify the specific announcement and the claimed impact on metals, crypto, and broader rates positioning as cited by TheChartGuys.
- Cancer Vaccine Headlines: Identify the specific biotech news; monitor subsequent sector price direction to confirm or refute the claimed volatility driver.
- AI Backlash Data: Seek quantitative evidence (polling, legislative actions, policy shifts) relating to the All-In Podcast's structural claim regarding escalating public backlash.
DAILY INTELLIGENCE BRIEF — August 22, 2026
Prepared by: Market-Intelligence Desk | Source Horizon: Intraday (PT-1 session window)
1. Executive Summary (📰)
Creator sentiment diverged today between near-term catalysts — bond-related news rippling into metals/crypto and claims of an urgent setup across major indices — and a longer-horizon warning of a structural political/societal backlash against AI. All evidence is metadata-only; no price levels or probabilities were established in any source summary.
2. Narrative Over Time (⏳)
- 09:48 ET — Bond-driven volatility (TheChartGuys): The session's first framing attributed market movement to surprise bond news from Treasury Secretary Bessent, claimed to have triggered rips in metals and crypto, while unrelated cancer-vaccine news introduced biotech volatility. Broader markets were characterized as consolidating weekly.
- 14:16 ET — Urgent technical opportunity claimed (Trade Brigade): The mid-session postures a "now or never" trading window, with a structured technical roadmap across SPY (00:50), QQQ (13:15), IWM (24:30), and S&P sectors (29:45), plus fundamental (43:50) and technical (48:00) evidence segments. The creator flagged a core list including NVDA, AAPL, MSFT, AMZN, GOOGL, AVGO, META, MU, TSLA, JPM, AMD, INTC and speculative ideas (PLTR, ORCL, NET, TWLO, FROG, MDB, RBRK, CRWD, PANW, TEAM, SPCX, MRVL, NBIS).
- 14:26 ET — Structural AI backlash warning (All-In Podcast): The late-session segment shifted horizon entirely, with Jason Calacanis claiming America is "sharpening the guillotines" — positing a severe societal/political reaction against AI, decoupled from intraday technicals.
3. Key Technical Levels & Signals (📈)
- Exact levels, zones, stops, or targets: Unavailable. TheChartGuys cites no tickers, prices, or levels for metals, crypto, or biotech moves.
- Trade Brigade provides chapter timestamps only (SPY 00:50, QQQ 13:15, IWM 24:30, sectors 29:45) — video content itself was not part of evidence. No entries, stops, or targets were established in the metadata.
- Interpretive note (analyst): Both technical-focused creators converge on a watch bias over broad indices but provide no quantified reference points; treat all as unverified watch topics.
4. Long-Horizon Macro & Structural Views (🌍)
- AI backlash as structural risk (All-In Podcast/Calacanis): Claimed American sentiment is turning hostile toward AI, framed as a severe — guillotine-level — societal or political reaction. No specific policies, data points, or affected tickers cited.
- Macro catalyst, near-term (TheChartGuys): Bessent bond news as a claimed macro driver for metals/crypto strength; details of direction and magnitude unverified.
- Sector catalyst (TheChartGuys): Cancer-vaccine news introducing biotech volatility — noted as unverified and direction-agnostic.
5. Scenario Analysis (🔄)
- Bull (metals/crypto continuation): Trigger — confirmation of Bessent bond news and sustained follow-through in metals and crypto. Support: TheChartGuys (claims a rip occurred). Probability/target: Not established by the available evidence.
- Base (broad weekly consolidation): Trigger — markets continuing the described sideways weekly pattern absent new catalysts. Support: TheChartGuys (prevailing setup claim). Probability/target: Not established by the available evidence.
- Bear (AI backlash repricing): Trigger — materialization of the claimed political/social AI backlash into policy, regulation, or public-company fundamentals. Support: All-In Podcast/Calacanis. Probability/target: Not established by the available evidence. Conflict noted: this macro-bear view is chronologically last (14:26 ET) and inherently disconnected from the intraday technical narratives earlier in the session — no reconciliation offered or possible at metadata level.
6. Chronological Stream (📌)
- [09:48 ET] | TheChartGuys | "Bonds Move Shakes Up Markets" | Bessent bond news claimed as catalyst for metals/crypto rips; weekly consolidation elsewhere.
- [14:16 ET] | Trade Brigade | "it's now or never..." | Urgent technical opportunity claimed across SPY/QQQ/IWM plus a 12-ticker core list.
- [14:26 ET] | All-In Podcast | "Jason Calacanis on America's AI Backlash: 'They're Sharpening the Guillotines'" | Warning of severe societal/political backlash against AI.
7. Evidence-Bound Watchlist (🎯)
- Verify the specific Bessent bond announcement and its claimed directional effect on metals and crypto (TheChartGuys trigger).
- Inspect biotech volatility stemming from the cancer-vaccine news — direction and magnitude remain fully unverified.
- Obtain transcript or show notes for the All-In Podcast segment to extract any verifiable data behind the AI-backlash characterization.
Daily Intelligence Brief — 2026-08-05
1. Executive Summary (📰)
One creator video was processed this session, addressing long-term homeownership versus index investing. The creator's view skews structurally cautious on real estate in high-cost cities while remaining constructive on broad equity index accumulation, with human capital formation as the primary wealth lever.
2. Narrative Over Time (⏳)
- [2026-08-05 17:52 ET] — The Compound published "Is Buying a Home Still a Good Investment?" The discussion frames homeownership as frequently suboptimal in high-cost urban markets, citing New York price points and ancillary ownership costs. The creator simultaneously argues that AI commoditizes intelligence, elevating the premium on manual foundational skills and career flexibility. The sentiment expressed is moderately pro-risk-asset (index funds), anti-leverage, and anti-illiquid-real-estate for younger cohorts.
3. Key Technical Levels & Signals (📈)
- No tradable technical levels, price zones, or market signals were cited. All figures referenced are illustrative cost benchmarks, not market data.
- $2.5 million — minimum price for a "decent" three-bedroom apartment on Manhattan's Upper West Side (cited as Jack's StreetEasy review).
- $1,400/month — New York HOA fee example for a condo (cited as illustrative).
- $200,000 — creator Jack's cited single-day loss on buy-now-pay-later warrants while earning a $56,000 salary (historical example, self-reported).
- $10,000 → $700,000 — Riley's cited eight-year tax-free account growth via extreme frugality (van living).
- $15,000/year — cited tax-free draw from a 401(k) assuming 10% early-withdrawal penalty plus standard deduction.
4. Long-Horizon Macro & Structural Views (🌍)
- AI commoditization of intelligence — Manual foundational skills (e.g., hand-built financial models) are argued to become more valuable before layering AI tools atop them.
- Renting over buying in high-cost metros — Price-to-own metrics plus HOA, taxes, and maintenance skew the decision toward renting for younger cohorts.
- Homeownership sentiment shift — Under-40 homeownership as "a good investment" is at its lowest recorded level (Pew Research, as cited); under-40 stock ownership has tripled this decade (Fed data, as cited).
- Optionality premium — Early-life flexibility (relocation, career risk, travel) outweighs early-dollar saving; income scaling in high-growth careers compounds more reliably than speculative returns.
- Leverage as structural risk — Concentrated leverage removes long-term compounding potential; survival is prioritized over upside maximization.
5. Scenario Analysis (🔄)
- Bull — Trigger: Young professionals prioritize human capital formation and maintain broad index exposure; wealth compounds via income scaling and equity markets. Creator support: The Compound (Jack). Probability/target: Not established by the available evidence.
- Base — Trigger: Renting in high-cost cities alongside S&P ETF accumulation yields returns consistent with long-term equity averages. Creator support: The Compound (Jack, explicit recommendation of S&P ETFs). Probability/target: Not established by the available evidence.
- Bear — Trigger: AI adoption outpaces human skill development, rendering fundamentals obsolete; or rents rise faster than incomes, eroding the renting advantage. Creator support: The Compound (acknowledged risk, not a central forecast). Probability/target: Not established by the available evidence. Disagreement noted: The creator's own "fire-style" retirement example (van living, $15k/year draw) is flagged as carrying social isolation and regret risk — a tension within the same video.
6. Chronological Stream (📌)
- [17:52 ET] | The Compound | "Is Buying a Home Still a Good Investment?" | Homeownership is often financially suboptimal in high-cost cities; prioritize human capital, rent, and hold broad index funds over leverage or illiquid real estate.
7. Evidence-Bound Watchlist (🎯)
- Under-40 equity ownership data — Verify Fed data cited: "under-40 stock ownership has tripled this decade." Confirm series, scope, and measurement period.
- Pew Research homeownership sentiment series — Verify "under-40 homeownership as a good investment at lowest level" — confirm question wording and year-over-year trend.
- NYC multi-family cost components — Track whether HOA/tax/maintenance burden relative to rents (the cited ~$1,400/month HOA benchmark) is shifting in either direction, which would test the renting-over-buying thesis.
No briefings yet
Consolidated daily, weekly, and weekend summaries appear here once generated.